From Shasta, CA to Adams to Baker, WA to Kokanee, BC to Banff, AB High Glacier Mass Loss in 2021

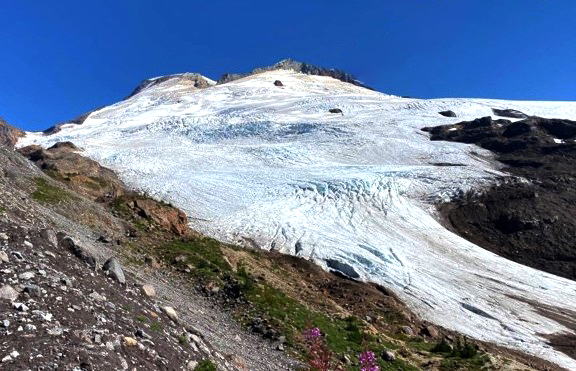
Easton Glacier on Mount Baker in late August 2021, with less than 20% of the glacier retaining snowpack.

The exceptional heat of the summer of 2021 across glaciated mountain ranges of the Pacific Northwest, reduced snowcover extent from Mount Shasta, CA north to Mount Adams and Mount Baker, WA and east to Glacier National Park, MTKokanee Glacier, BC and Bonnet Glacier, Alberta.  Here we examine late summer images to illustrate the extent of exposed bare ice and firn across glaciers in the region. For a glacier to be in equilibrium requires at least 50% to be in the accumulation zone, snow covered at the end of the summer. At the end of the summer the snowcovered area varied from 0-20% on all of the glaciers reviewed here, the snowcovered area is the accumulation area ratio. Low accumulation area ratios such as this indicate mass loss of at least 2 m w.e. in 2021 on these glaciers. That is the equivalent of losing a 2 m thick slide of ice off the surface of the entire glacier.

When there is a persistent pattern of snowcover loss on the upper part of the glacier this indicates the lack of a consistent accumulation zone indicating the glacier cannot survive (Pelto, 2010). One indicator of this is new bedrock being exposed on the upper glacier as seen on both Easton and Bonnet Glacier here.

As the winter season begins hopefully a La Nina pattern will deliver much needed deep snowpacks.

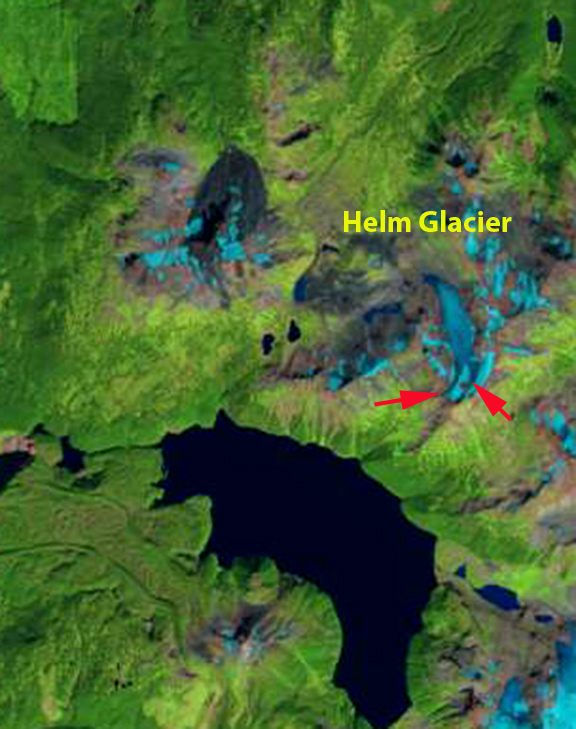
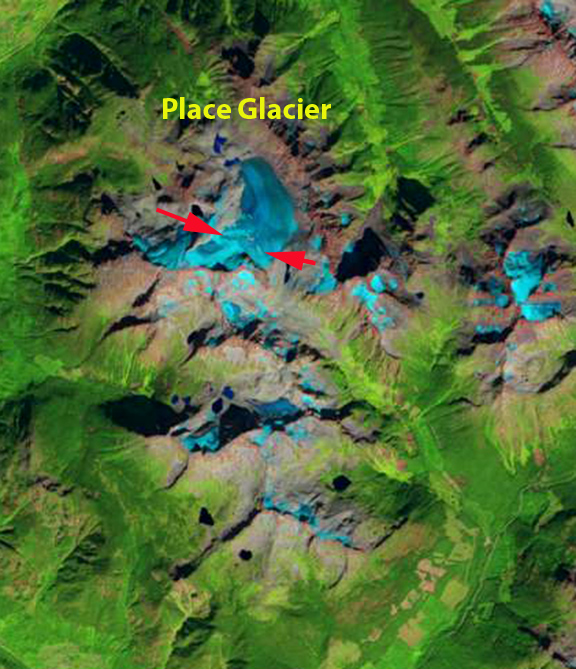
Sentinel 2 False and True Color images from 8-25-2021.  Yellow arrows indicate where glacier is separating and blue arrows the small remanent of 2021 snowpack remaining. This remanent will not last to the end of the melt season. 

Jackson and Blackfoot Glacier in early September Sentinel 2 false color images. Point A indicates exposed ice showing annual layers. Point B indicates exposed firn that had been retained through previous summers. The gray color of the firn indicates how dirty it is and that its albedo would enhance melting.  

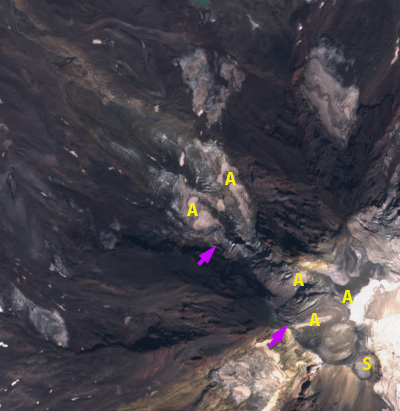
Adams Glacier on Mount Adams in Sentinel 2 True Color image from 8-30-2021. Pink arrows indicate icefall top and bottom. S=summit area, A=Areas where limited pockets of 2021 snowpack has been retained through August.

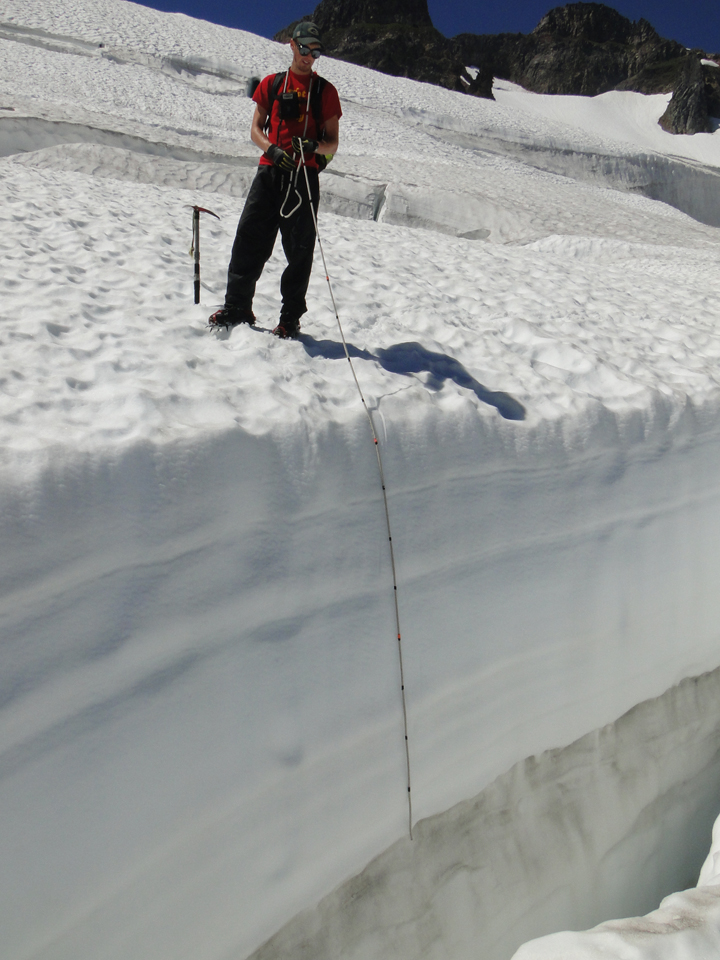
The upper reaches of Kokanee Glacier to Cond Peak (2800 m) with no retained snow in 2021. Bare ice is exposed on the lower half of the image, and firn, or multi-year snow above.  Picture taken during fieldwork by Ben Pelto.

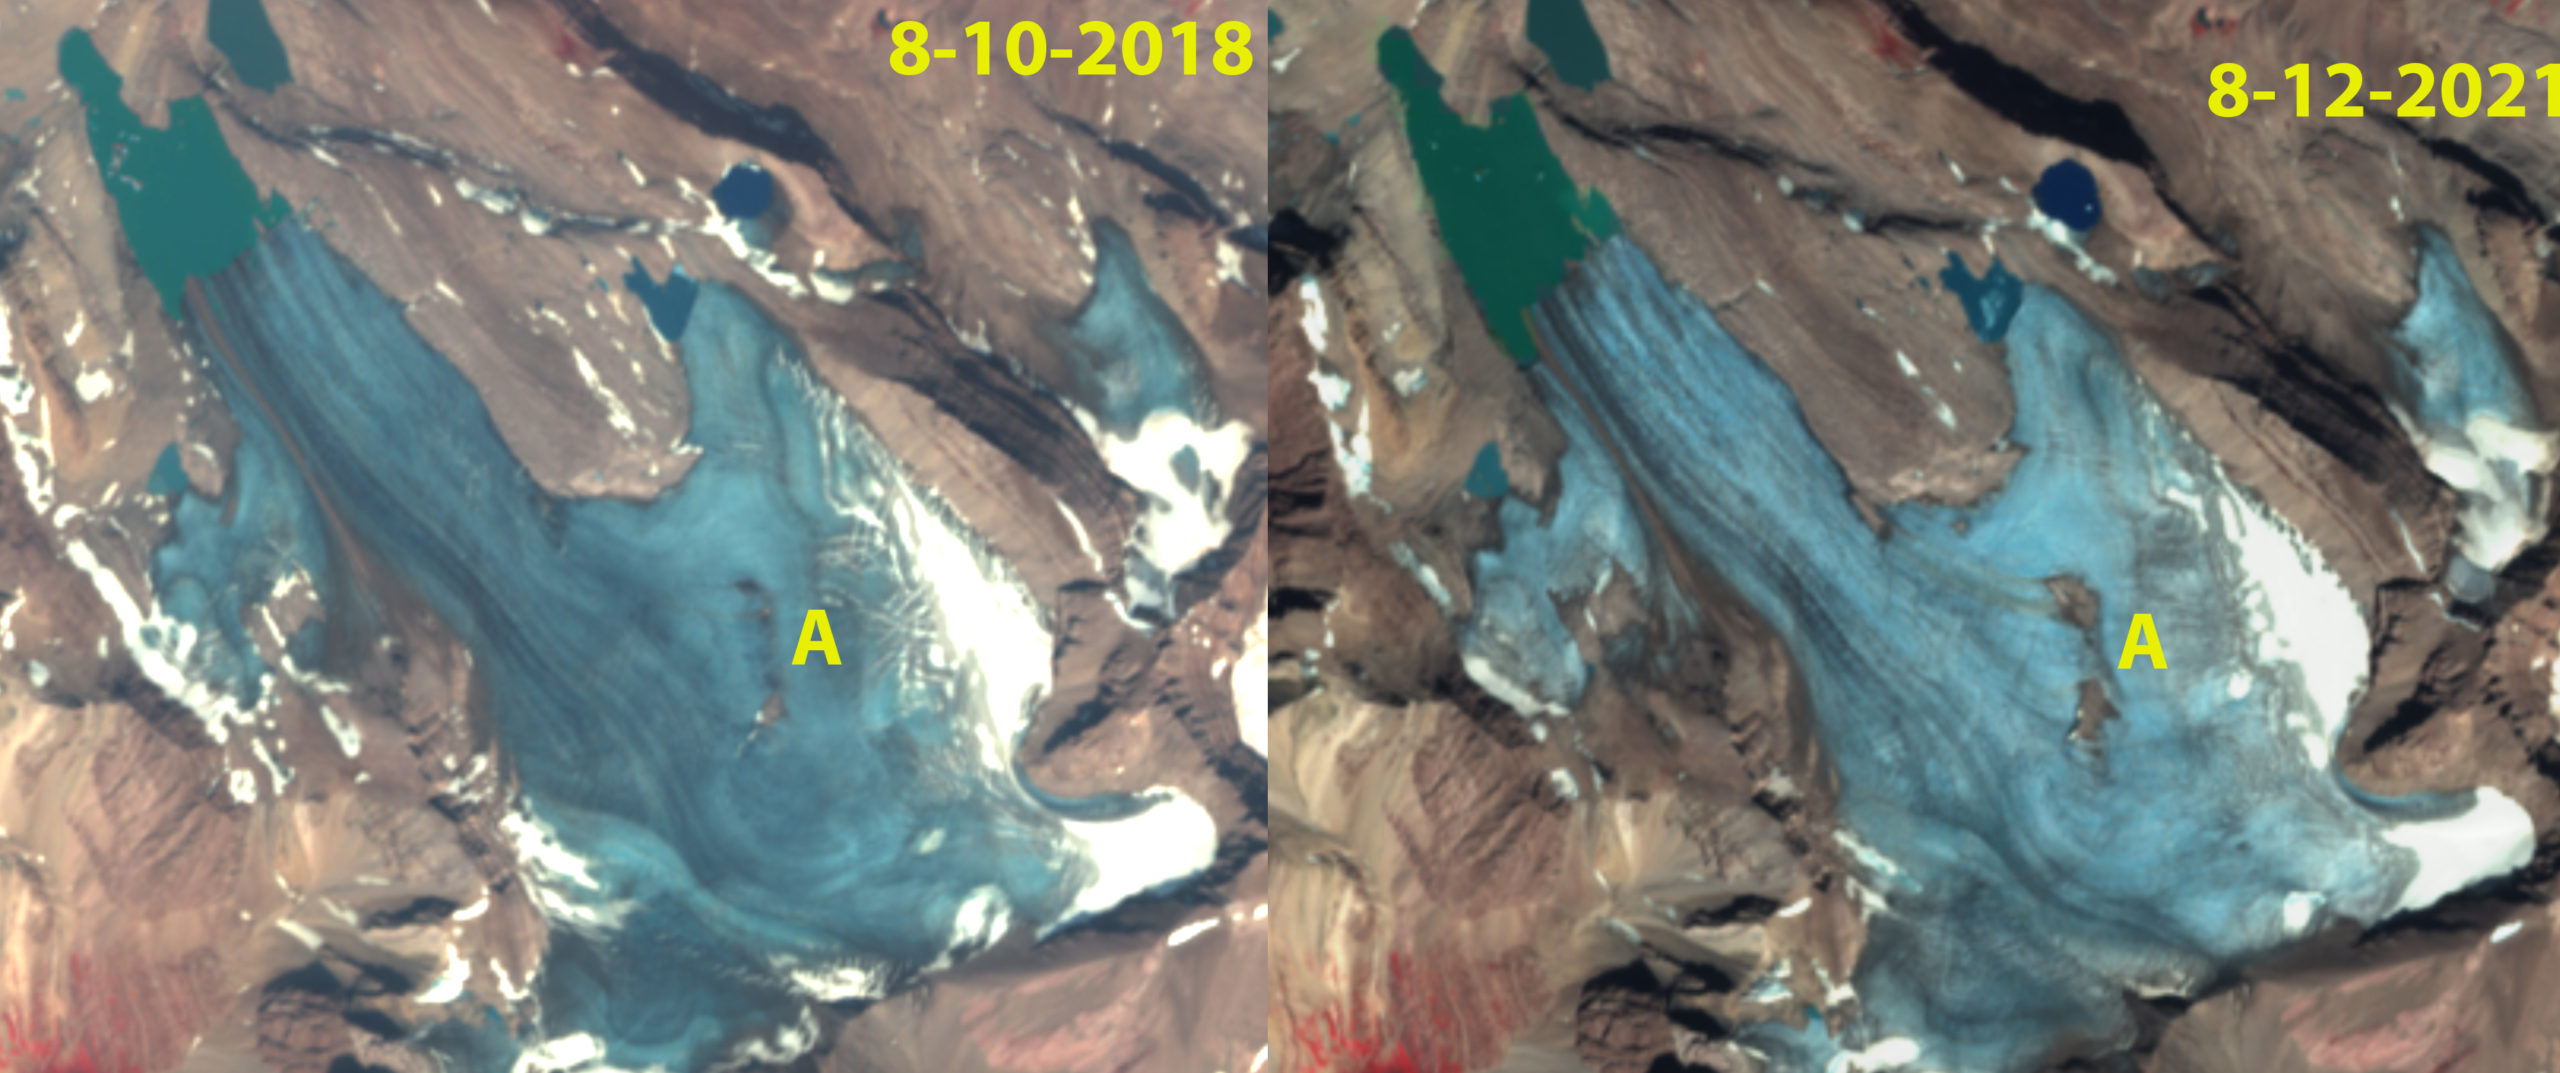
Bonnet Glacier in Sentinel 2 images indicating the emergence of bedrock due to thinning in the former accumulation zone, Point A. Note the lack of retained snowcover in both years with at least a month left in the melt season.


Pacific Northwest Glacier Mass Balance 2013

North Cascades Climate Conditions:
The 2013 winter accumulation season featured 93% of mean (1984-2013) winter snow accumulation at the long term USDA Snotel stations in the North Cascades, Washington (Figure 1). The melt season was exceptional by several measures. The mean summer temperature from June-September and July-September at Lyman Lake is tied with the highest for the 1989-2013 period (Figure 2). The average minimum temperature at Lyman Lake was the highest since 1989 for the July-September period, and tied with the highest for the June-September period (Figure 3). SeaTac airport minimums were high as well indicating the regional nature.

Glacier Mass Balance:
Snow depth was measured at a 30 m spacing across the entire glacier on August 4th. The position of the snowline indicates the location where snow depth is zero. Assessment of stakes emplaced in the glacier from Aug. 3-20 indicates mean ablation during the period of 7.8 cm/day. Assessment of ablation from remapping of the snowline on Sept. 1 indicates mean ablation of 7.5 cm/day during the August 4th-Sept. 1st period. A preliminary map of Sholes Glacier mass balance for Aug. 8th is seen below (Figure 6). The contours are in meters of water equivalent, which is the amount of water thickness that would be generated if the snow or ice was melted. Note the similarity of the 1.75 m contour and the Sept,. 12th snowline.The best measure of ablation over the period from August 4th to Sept. 12th is the shift in the snowline, as identified in satellite imagery (Figure 7 and 8). The snow depth at a particular location of the snowline on Sept. 12th indicates the snow ablation since August 4th. Observations of the snowline margin on Aug. 20, Sept. 1 and Sept. 12 indicated mean ablation of 7.4 cm per day from Aug. 4th to Sept. 12th.

sholes 2013 August melt
Figure 4 Comparison of snowpack on Sholes Glacier on August 4th and September 1st, 2013

sholes glacier network
Figure 5. Sholes Glacier snow depth measurement network

sholes 2013 8-8
Figure 6. Snow depth distribution in snow water equivalent on Sholes Glacier on Aug. 8th, 2013.

sholes 8-4-2013
Figure 7 August 4th satellite image showing snowline on Sholes Glacier from Landsat imagery.

sholes 9-12-2013
Figure 8. September 12 snowline on Sholes Glacier from Landsat imagery

Snow depth observations on Easton Glacier on the bench below the main icefall at 2000 m, yielded an average depth of 3.1 m on Aug. 10th. The bench was completely snowcovered on Aug. 10th. GPS measurements of the snowline on Sept. 15th indicate ablation of 2.75 m since Aug. 10th. This is an ablation rate of 7.6 cm of snow melt per day. This is 0.2 cm/day higher than Sholes Glacier. The time period is not identical either. The southern orientation of Easton Glacier typically leads to higher ablation rates at specific elevations than on Sholes Glacier. Satellite observations of the change in snowline position compared to snow depth observations from Aug. 4th to Sept 12th indicate mean ablation of 7.2-8.0 cm/day.

On the four Mount Baker glaciers a total of 380 snow depth measurements were made on (Figure 9). The initial mass balance assessment is -0.78 m on Columbia Glacier. -1.58 m on Easton Glacier, -0.5 m on Foss Glacier, -0.76 m Ice Worm, -0.85 m on Lower Curtis Glacier, -0.40 m Lynch Glacier, -1.85 m on Rainbow Glacier, -1.7 m on Sholes Glacier and -1.15 m on Yawning Glacier. easton crevasse depth
Figure 9 Snow depth in crevasse on Easton Glacier.

columbia glacier Ba 2013
Figure 10 Mass balance map for Columbia Glacier in meters of water equivalent.

On the Juneau Icefield in southeast Alaska the ablation season was warmer and longer than normal. The result was snowlines rising above average at Lemon Creek and Taku Glacier, where the Juneau Icefield Research Program measures mass balance. For Taku Glacier the ELA was 1050 m, 75 m above an equilibrium snowline, and 1115 m, 100 m above an equilibrium snowline for Lemon Creek Glacier. The final mass balance for these glaciers will be in the -0.5 to -1.0 m range for both. Further north the USGS reports preliminary results, from there two Alaskan benchmark glaciers, which indicate that Gulkana Glacier in the Alaska Range, mass balance was the 5th most negative year. At Wolverine Glacier in the Kenai Mountains mass balance will likely be the most negative on record. In British Columbia both the Helm Glacier and Place Glacier are observed annually for mass balance. On Sept 12, 2013 Landsat imagery indicates limited remaining snowcover on both of these glaciers. The snowline is at 2050 m on Helm Glacier and 2300 m on Place Glacier, red arrows. The snowcovered area is less than 20% on Helm Glacier and 30% on Place Glacier, which will lead to large negative mass balances (Figure 11 and 12). Hence, all 16 glaciers examined here will have significant negative mass balances in 2013.

taku lemon creek snowline 2013
Figure 11. Landsat image indicating the snowline on Sept. 24, 2013 on Lemon Creek and Taku Glacier.

helm glacier 2013
Figure 12 Helm Glacier in Landsat imagery 9-12-2013

place glacier 2013
Figure 13 Place Glacier in Landsat imagery 9-12-2013