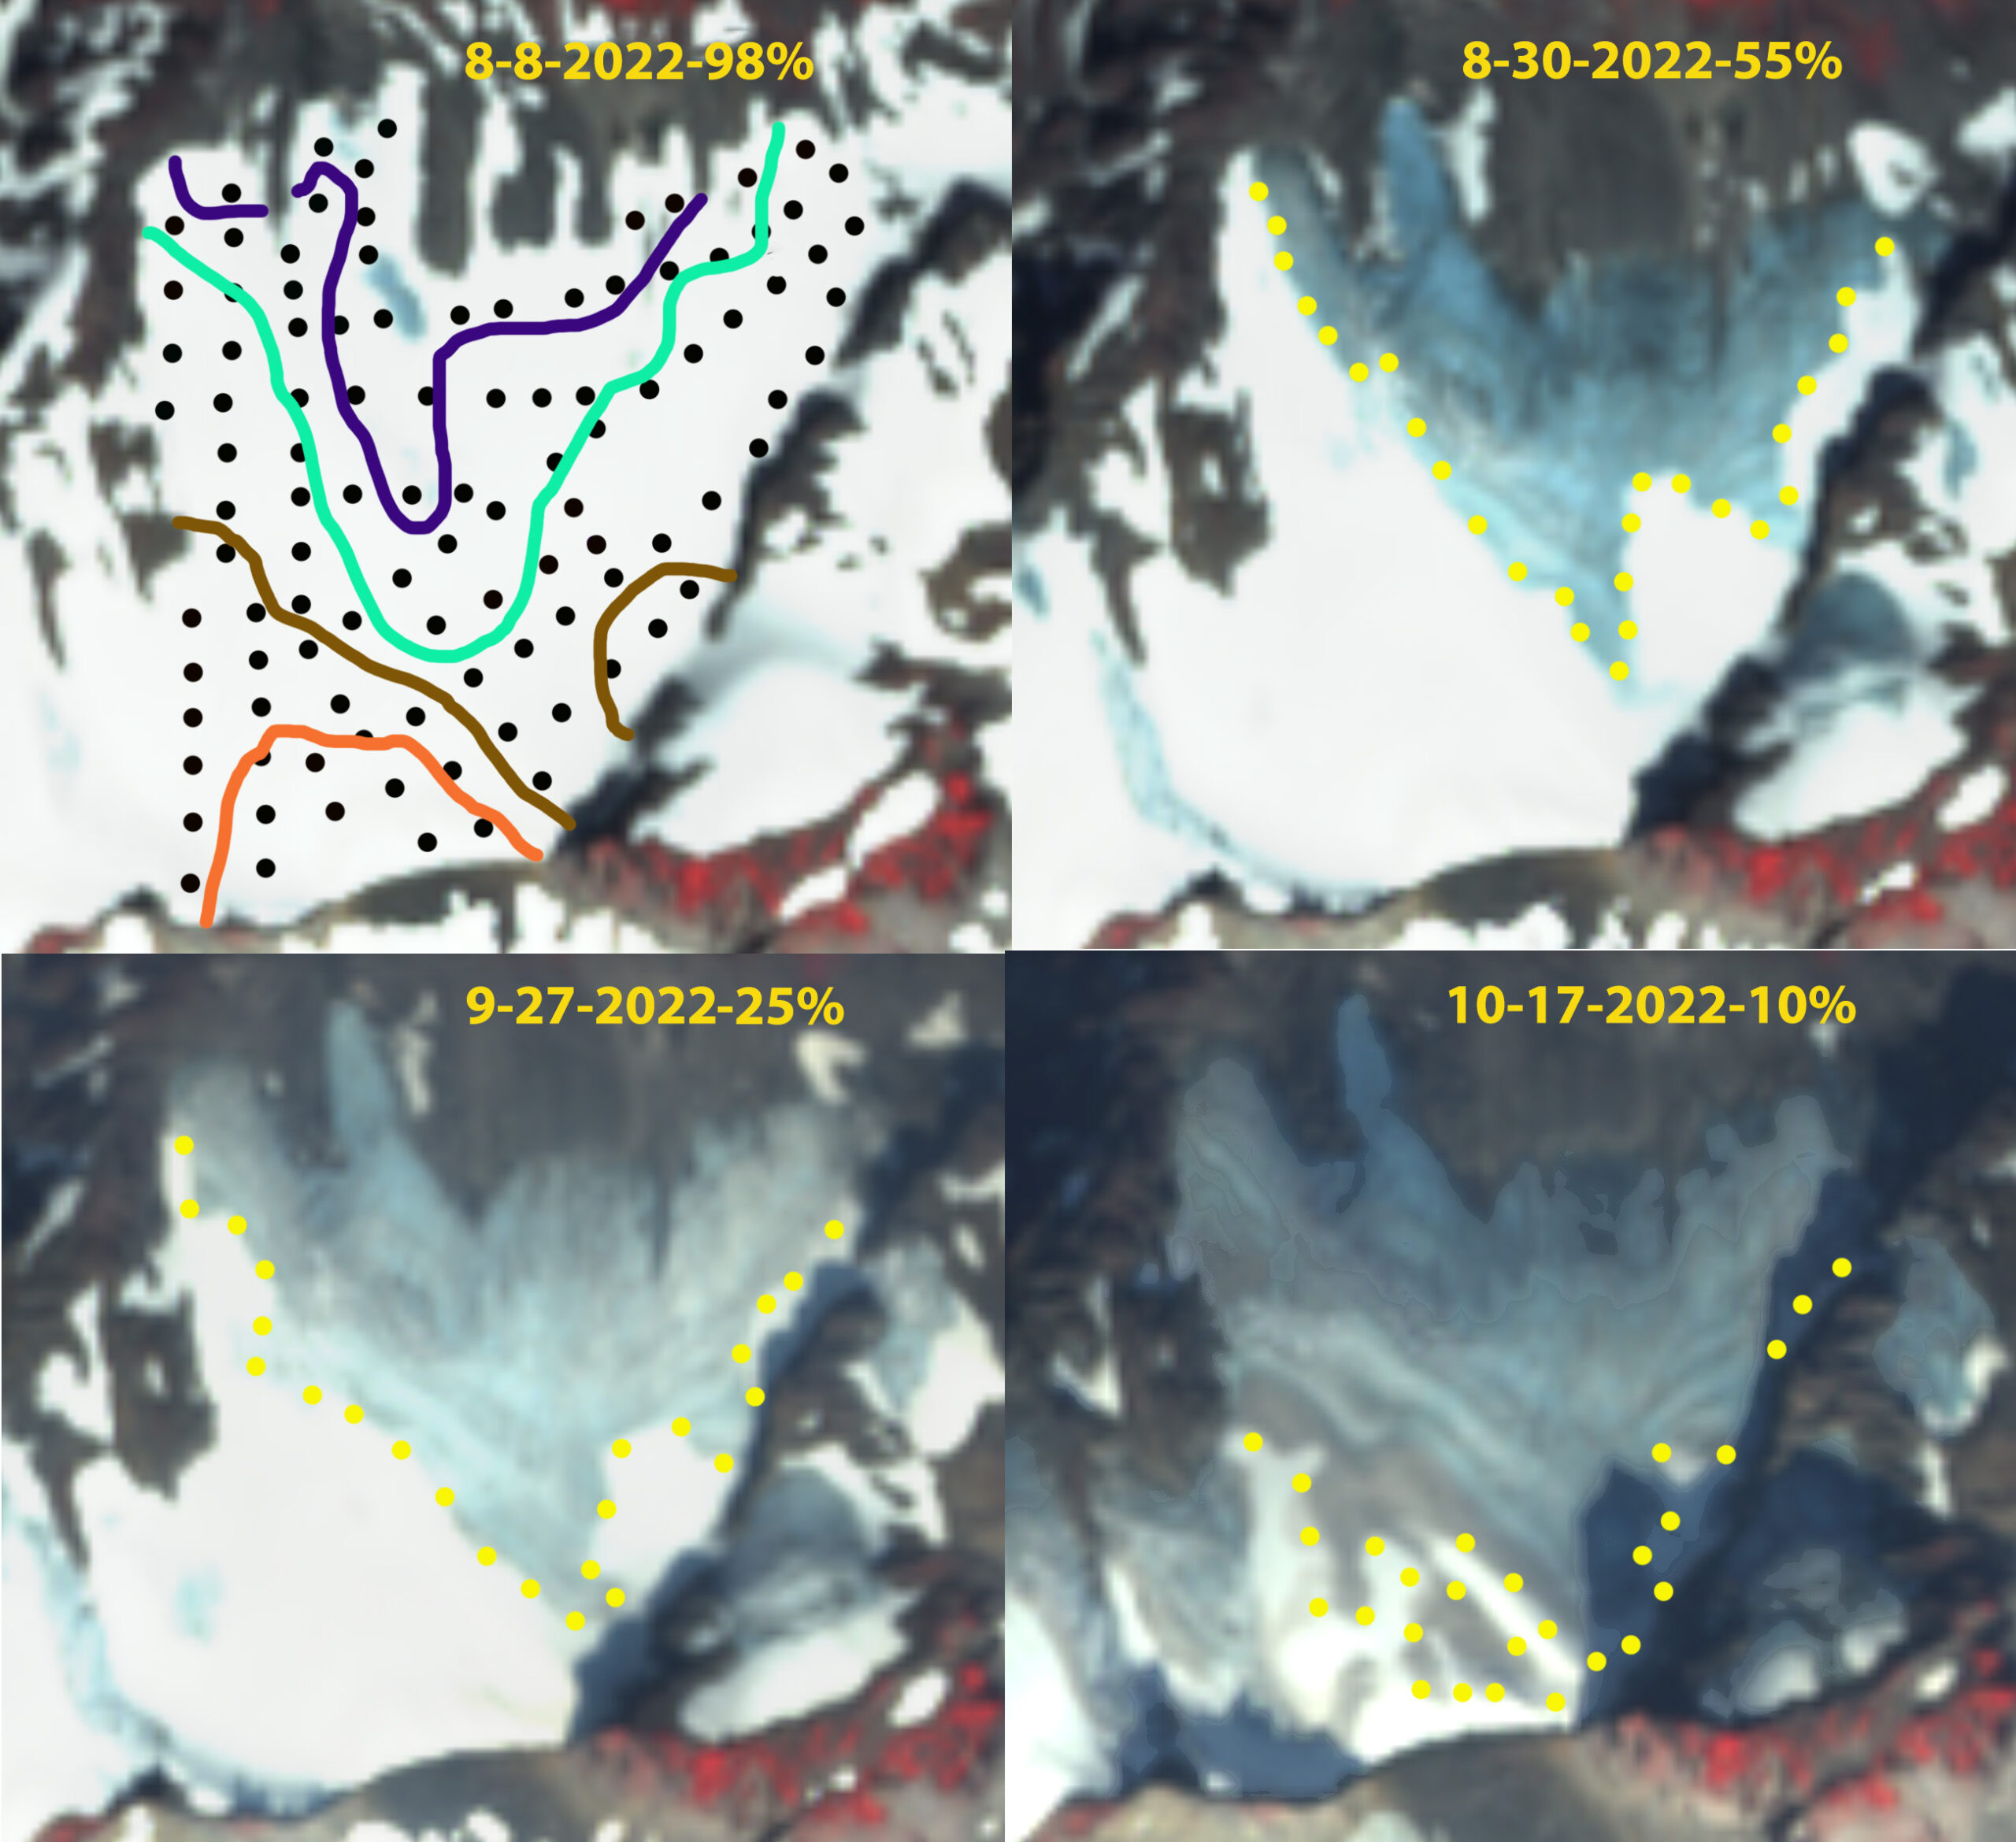
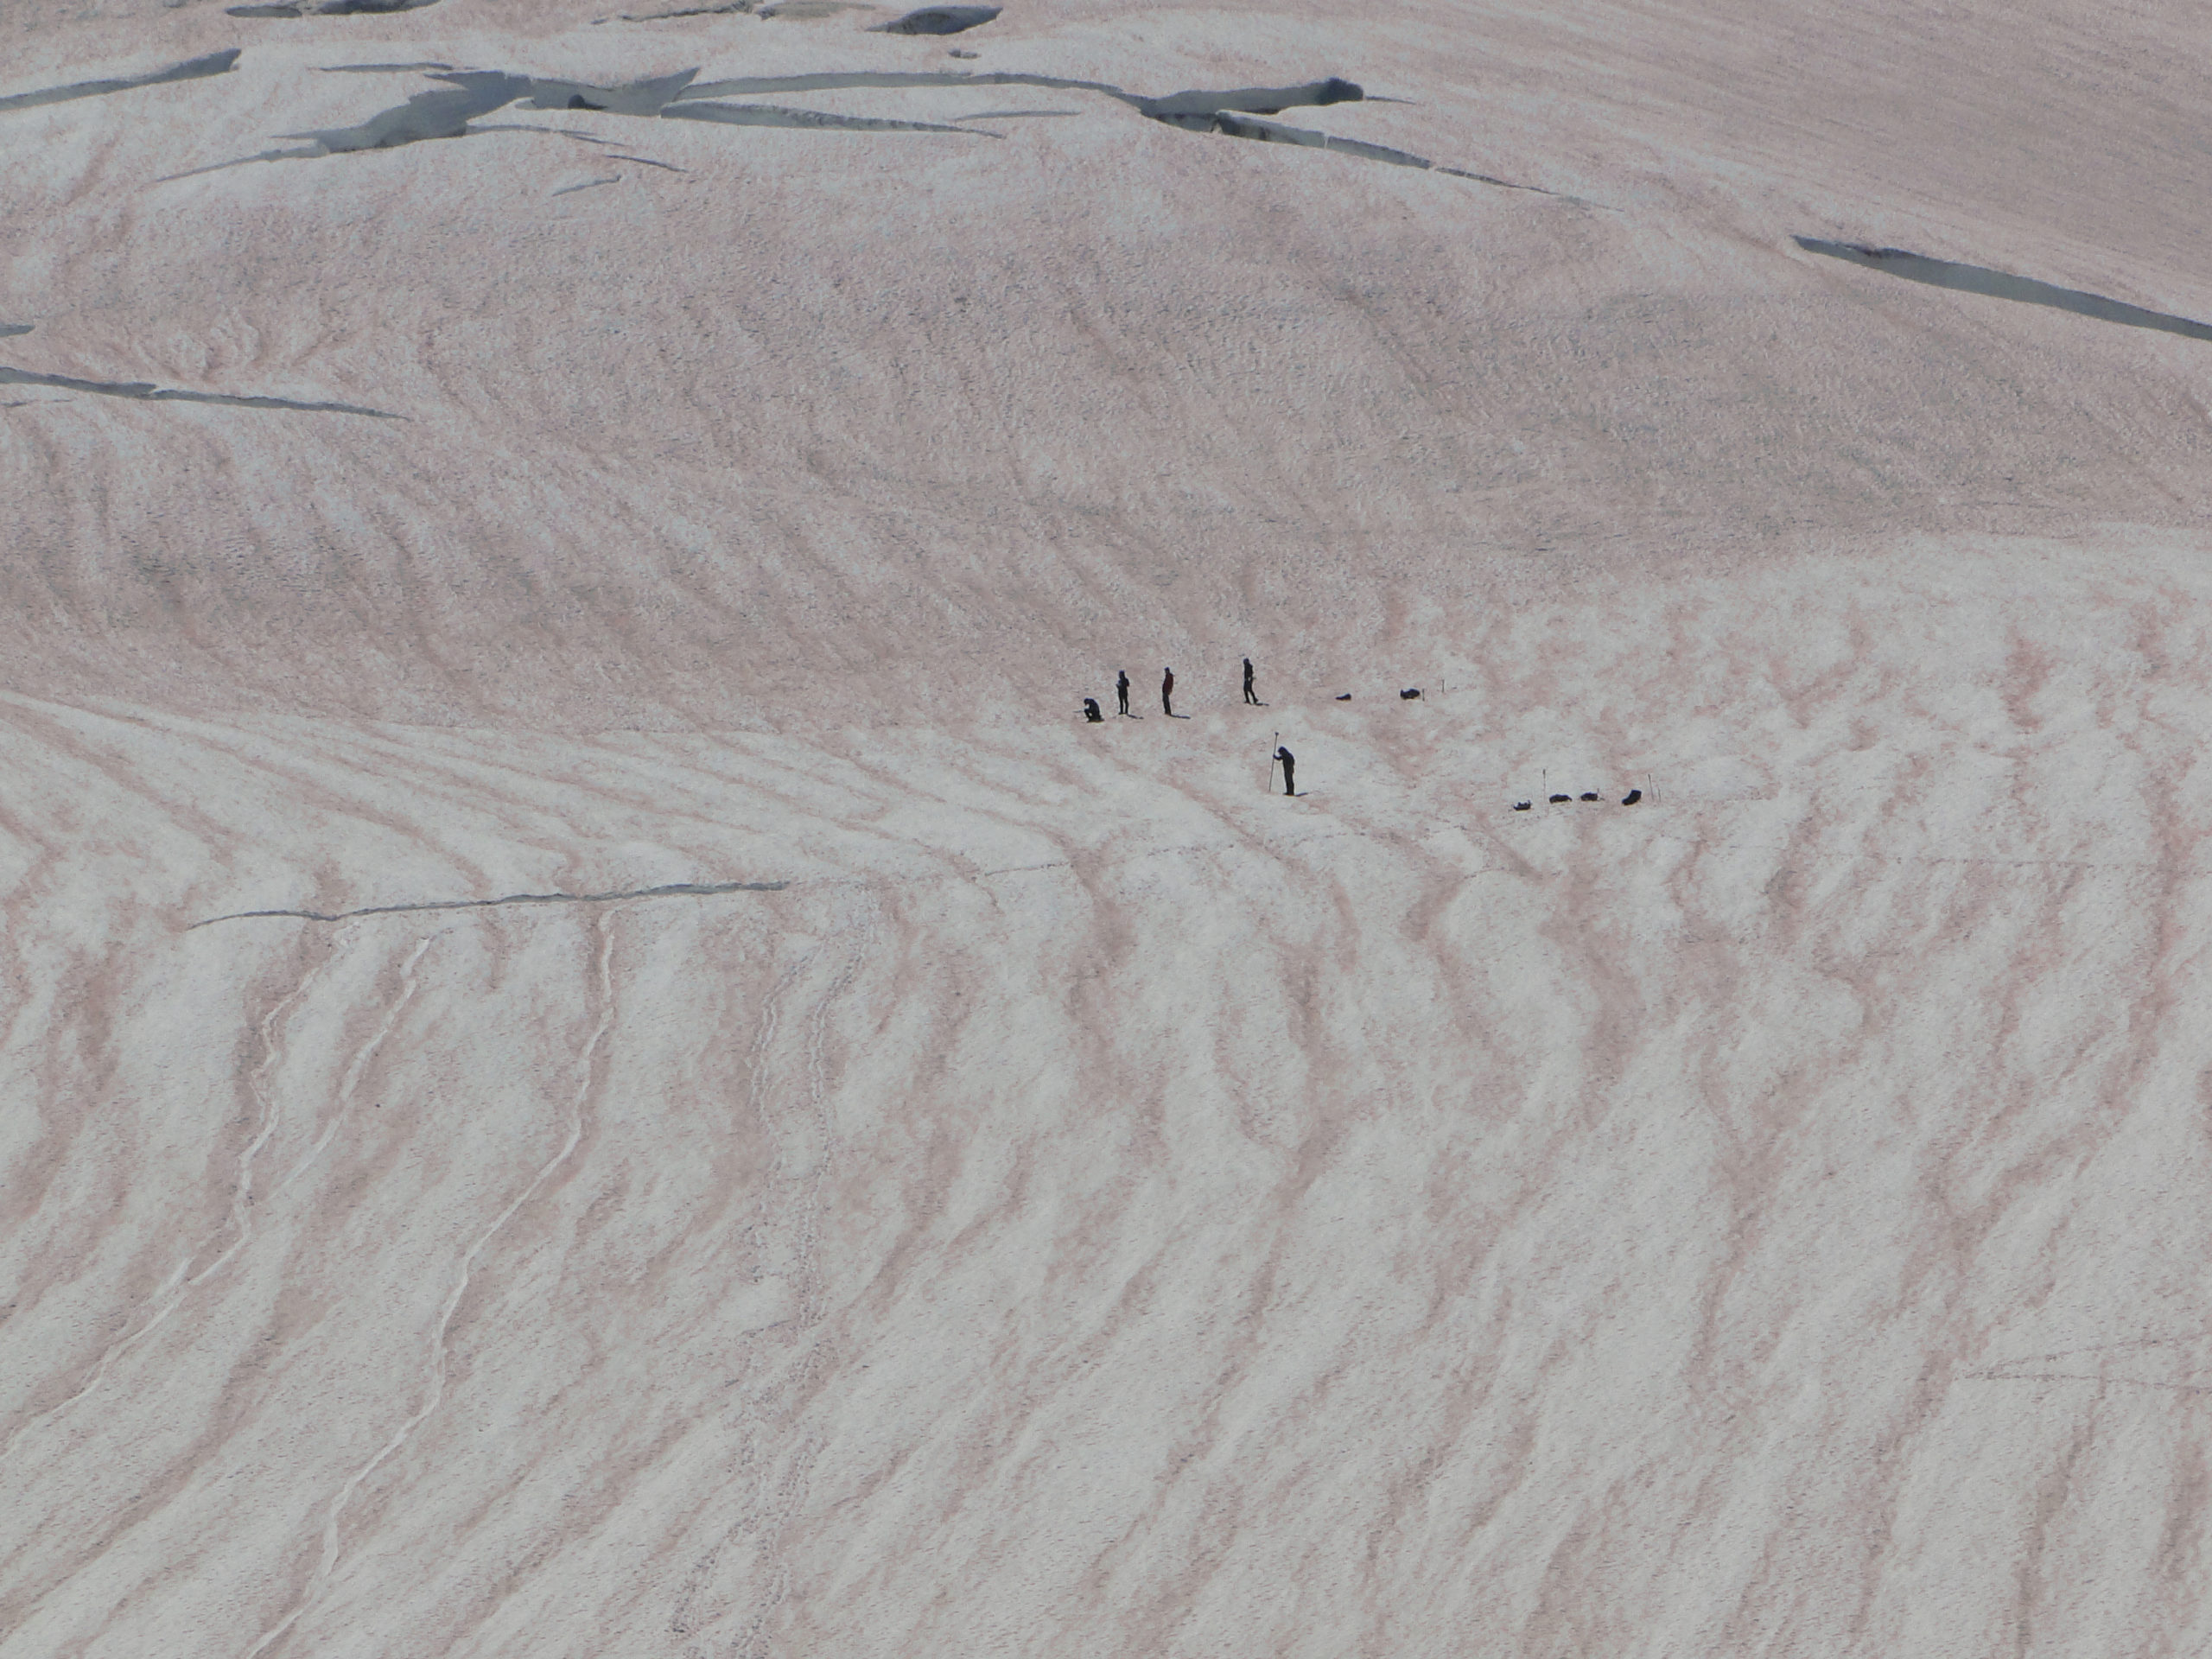
Sholes Glacier snowcover extent change from 8-8-2022 to 10-17-2022. Snowcover declined from 98% of glacier to 10% of glacier during this period. Black dots are measurement sites, yellow dots the transient snowline, purple contour= 1.5 m, green contour= 2 m, brown contour= 2.5 m, and orange contour= 3 m snow depths on 8-8-2022.
The 2022 melt season for Moutn Baker glaciers was one for the record books, with a slow start and a prolonged intense melt lasting into Late October. Peak snowpack was not reached until May 20, 2022 at the Lyman Lake (1515 m) and Middle Fork Nooksack (1825 m) Snotel sites, with limited melt before June 1. These two sites have the highest correlation with our glacier mass balance observations (Pelto, 2018). Peak snowpack at Paradise, Mount Rainier (1565 m) was reached on May 26. The snowpack on June 1 at LL and MFN was 1.45 m Snow Water Equivalent (SWE) and 1.40 m SWE respectively. Snowpack at LL melted completely on July 14 and at MFN on July 11, with an average daily loss of 3.2 cm/day SWE. From June 1-Oct. 19 when the melt season ended, observed melt exceeded the previous highest years, we have observed during the 1984-2022 period. In 2023 peak snowpack was reached in mid-April at both LL and MFN, with rapid melt reducing snowpack during the first half of May.

Lyman Lake and Midde Fork Nooksack Snotel site snowpack depth in cm SWE observations beginning April 1 in 2022 and 2023. In 2022 May was a period of snowpack increase in 2022, while the first half of May 2023 has resulted in rapid snowpack depletion.
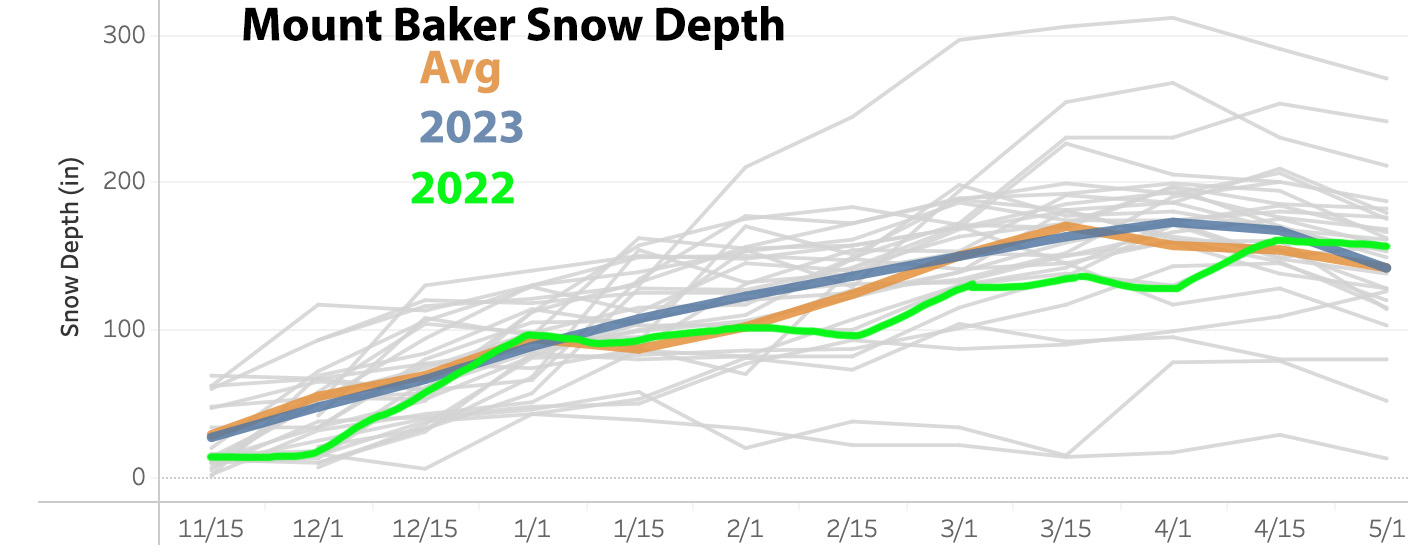
Heather Meadows snowpack depth (inches) at 1300 m, with 2022 rising above average during late April, while 2023 dips to average by the start of May.
On Sholes Glacier on August 6th-8th, 2022 we observed snow depths at 110 locations with an average snow depth of 2.25 m, 1.35 m SWE. We also checked two ablation stakes emplaced on June 1 indicating 3.55 m of snow melt, 2.1 m SWE. Sentinel images from Aug.8, Aug. 30, Sept. 9, Sept 27 and Oct. 17 reveal the recession of the snowline through the observation network allowing identification of snow ablation during these intervals. On Aug. 8, 98% of the glacier was snowcovered. On Aug 30, this had declined to 55%, with the snowline intersecting regions of the glacier that had 1.1 m SWE of snow cover on Aug. 8. By Sept. 9, the glacier was 40% snowcovered. On Sept. 27 the glacier was 25% snowcovered, with the snowline interseting sites that had 1.9 m SWE on Aug. 8. This is usually approximately the end of significant melt. However, in 2022 summer conditions continued through Oct. 19. The glacier was 10% snowcovered on Oct. 17, with the snowline intersecting sites that had 2.7 m SWE on Aug. 8.
The total observed snow melt for the June 1-Oct. 17 period was 4.8 m SWE on Sholes Glacier, eclipsing the previous June-end of melt season highs in 2015 of 4.0 m and in 2021 of 4.4 m. In both of those years the melt season did not extend into October, though May had significant melt. The Sholes Glacier did not suffer as much mass loss, because the initial snowpack was significantly greater in 2022. To have an equilibrium mass balance a glacier typically requires 55-65% of its area be snowcovered at the end of the melt season. A 10% snowcover indicates substantial mass losses.
On Rainbow Glacier on Mount Baker observations of snow depth on Aug 5-6, 2022 identified snow depths across the glacier. By Oct. 17th the areas of the glacier with 3.8 m or less of snowpack in early August had lost snowcover, indicating ablation of 2.4 m SWE of snowpack after early August. There was an area of exceptional snow algae at ~2100 m downwind of Dorr Steamfield on Rainbow Glacier, that Alia Khan’s Western Washington University research group examined. We led them through the Rainbow Icefall to this location.
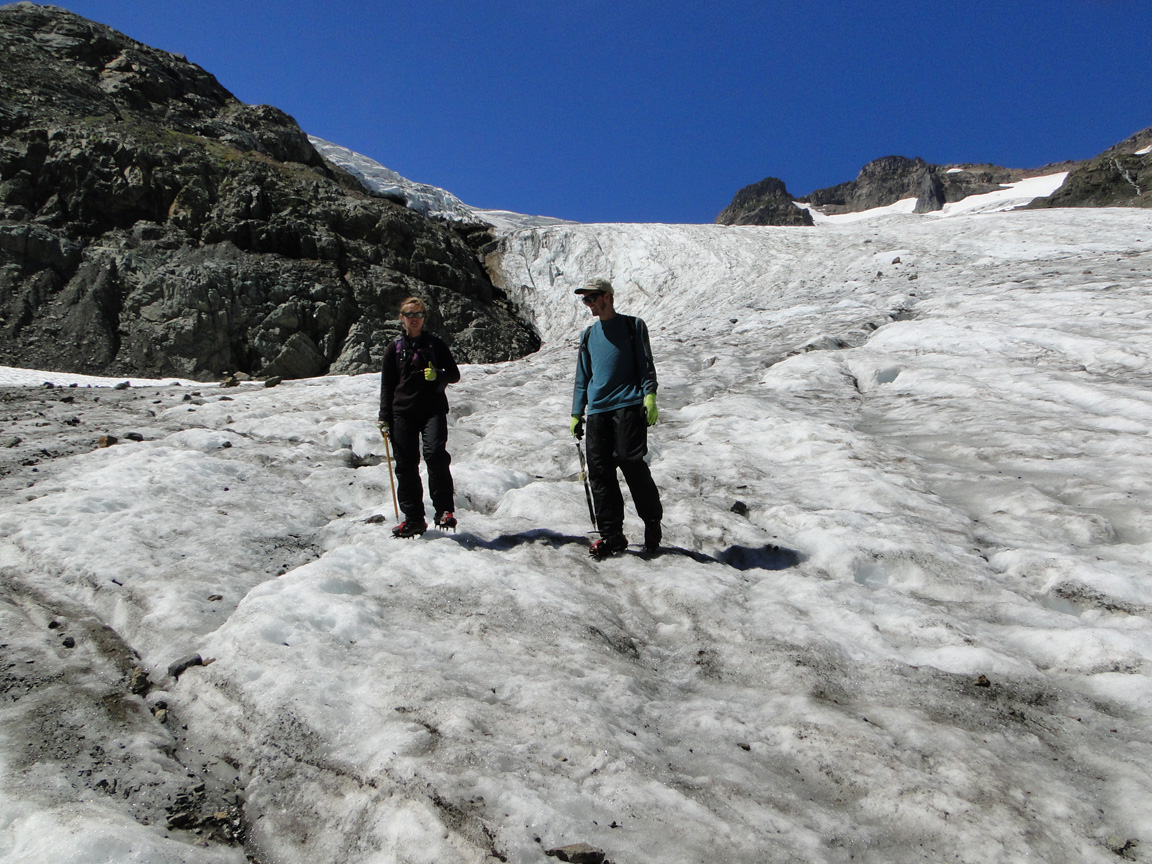
On Easton Glacier, Mount Baker at 2500 m on Aug. 10th there was 5.25 m of snow remaining, compared to 2.75 m on September 27. At 2100 m there was 2.6 m of snowpack on August 10th with this snowpack melting completely between Sept,. 22 and Sept. 27. Indicating 1.6 m SWE of ablation during this period.
What 2022 illustrated is that a good winter season of accumulation, followed by a delayed melt season start, still cannot offset the persistent extended heat the region has experienced the last two summers. With the melt season off to a faster start in 2023 the outlook for Mount Baker glaciers is for another significant mass loss.

Snow depths on Rainbow Glacier on Aug 5-6, 2022.
Snow algae on Rainbow Glacier at 2100 m on Aug. 5th. Alia Khan’s WWU collecting samples.
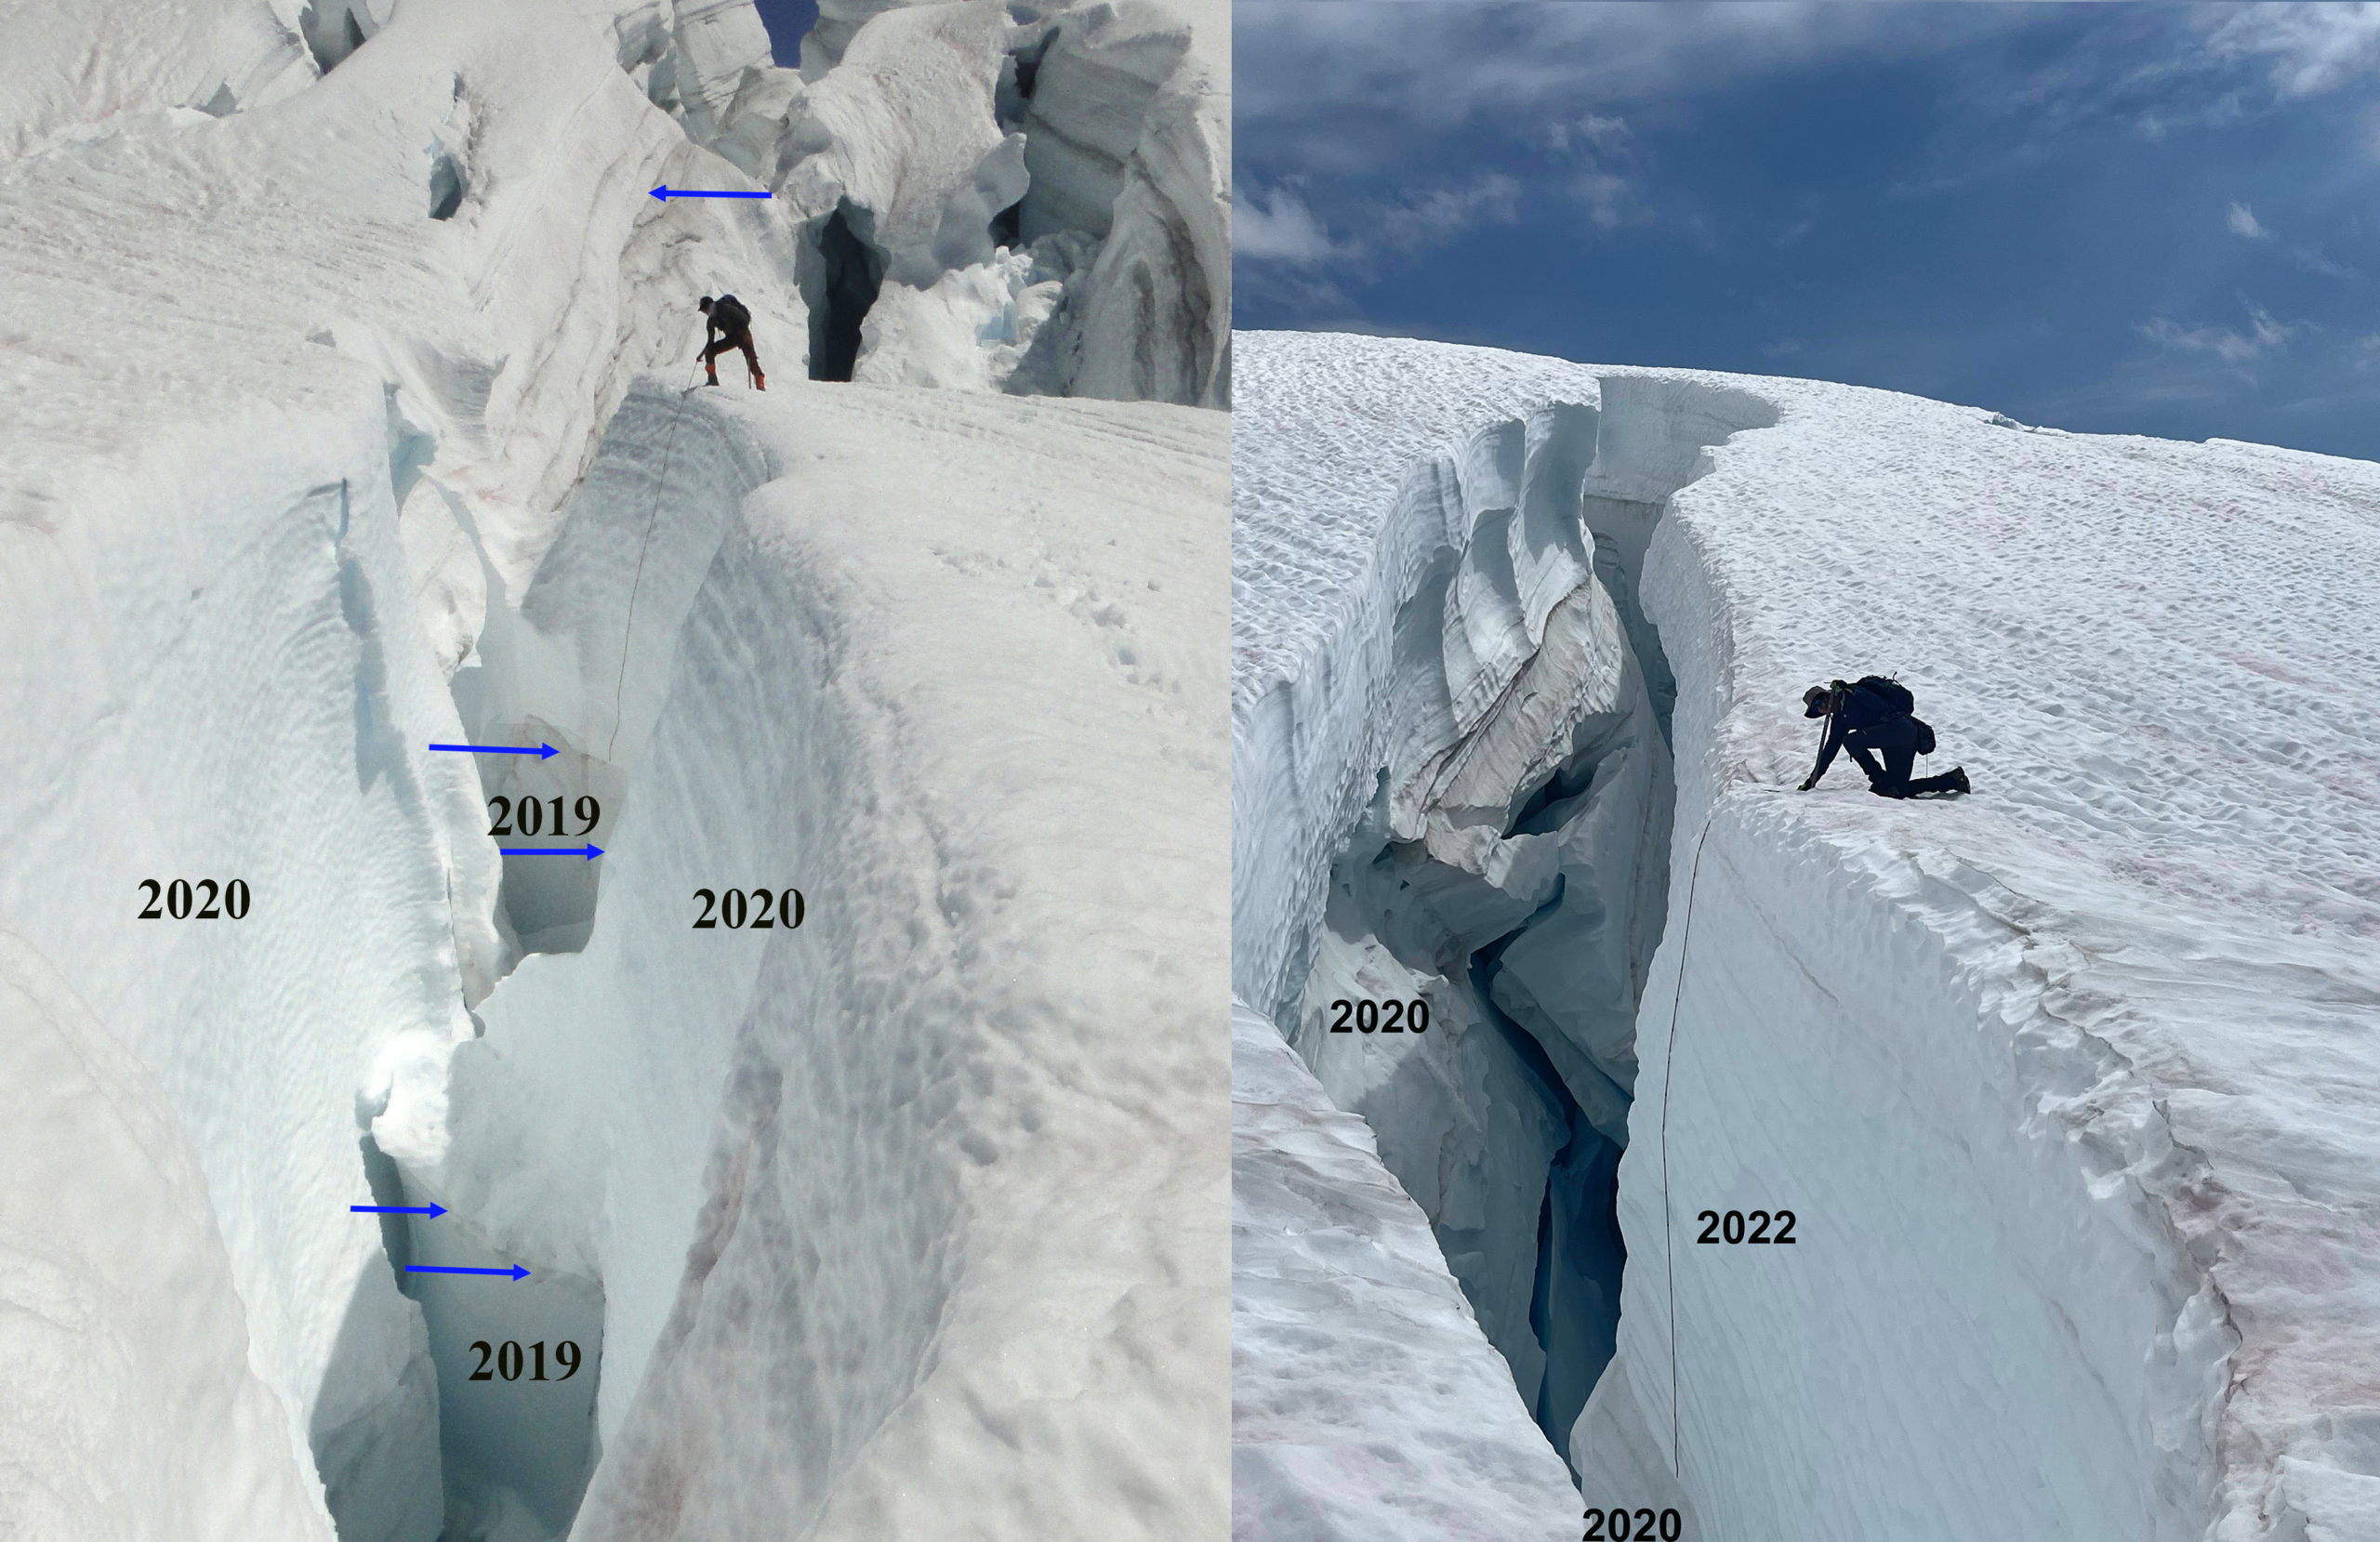
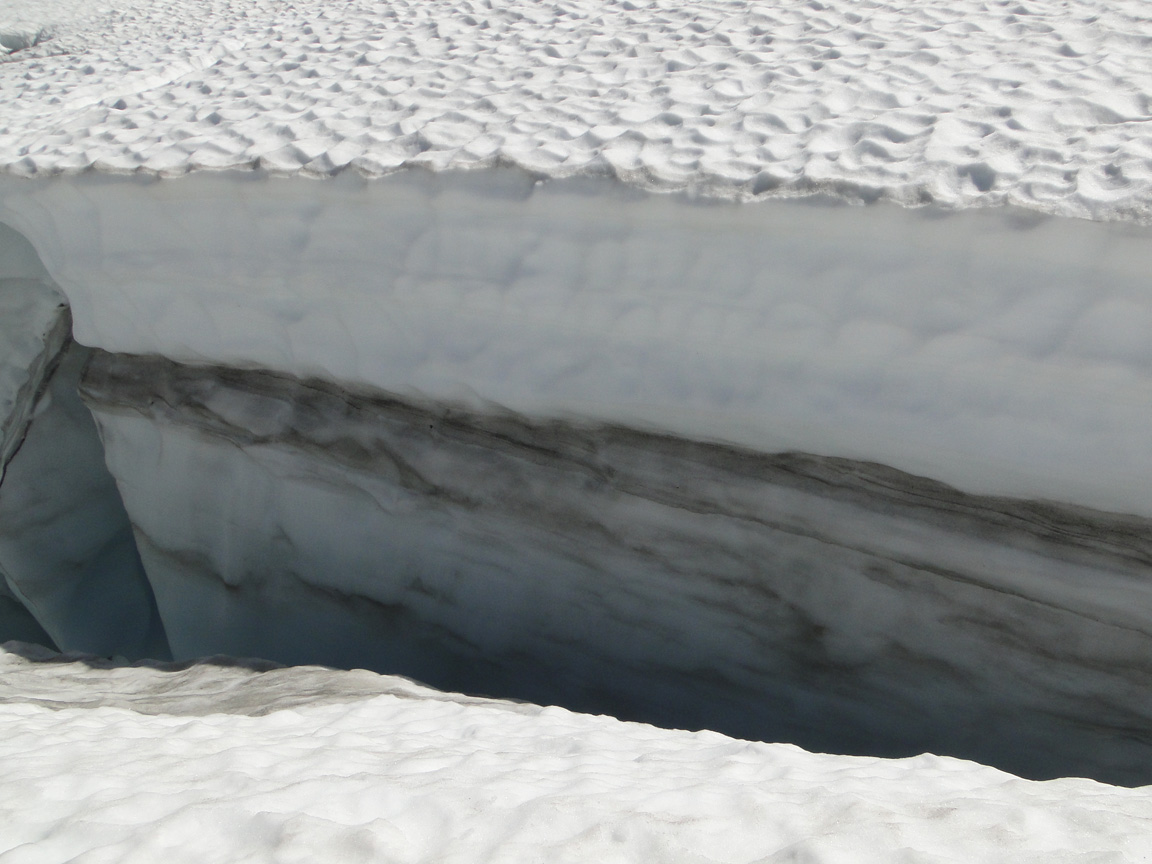
Contrasting snow depth in crevasse in mid-August of 2020 and 2022 at 2500 m on Easton Glacier. Snow depths remaining on August 10, 2022 was ~5.25 m in 2022.
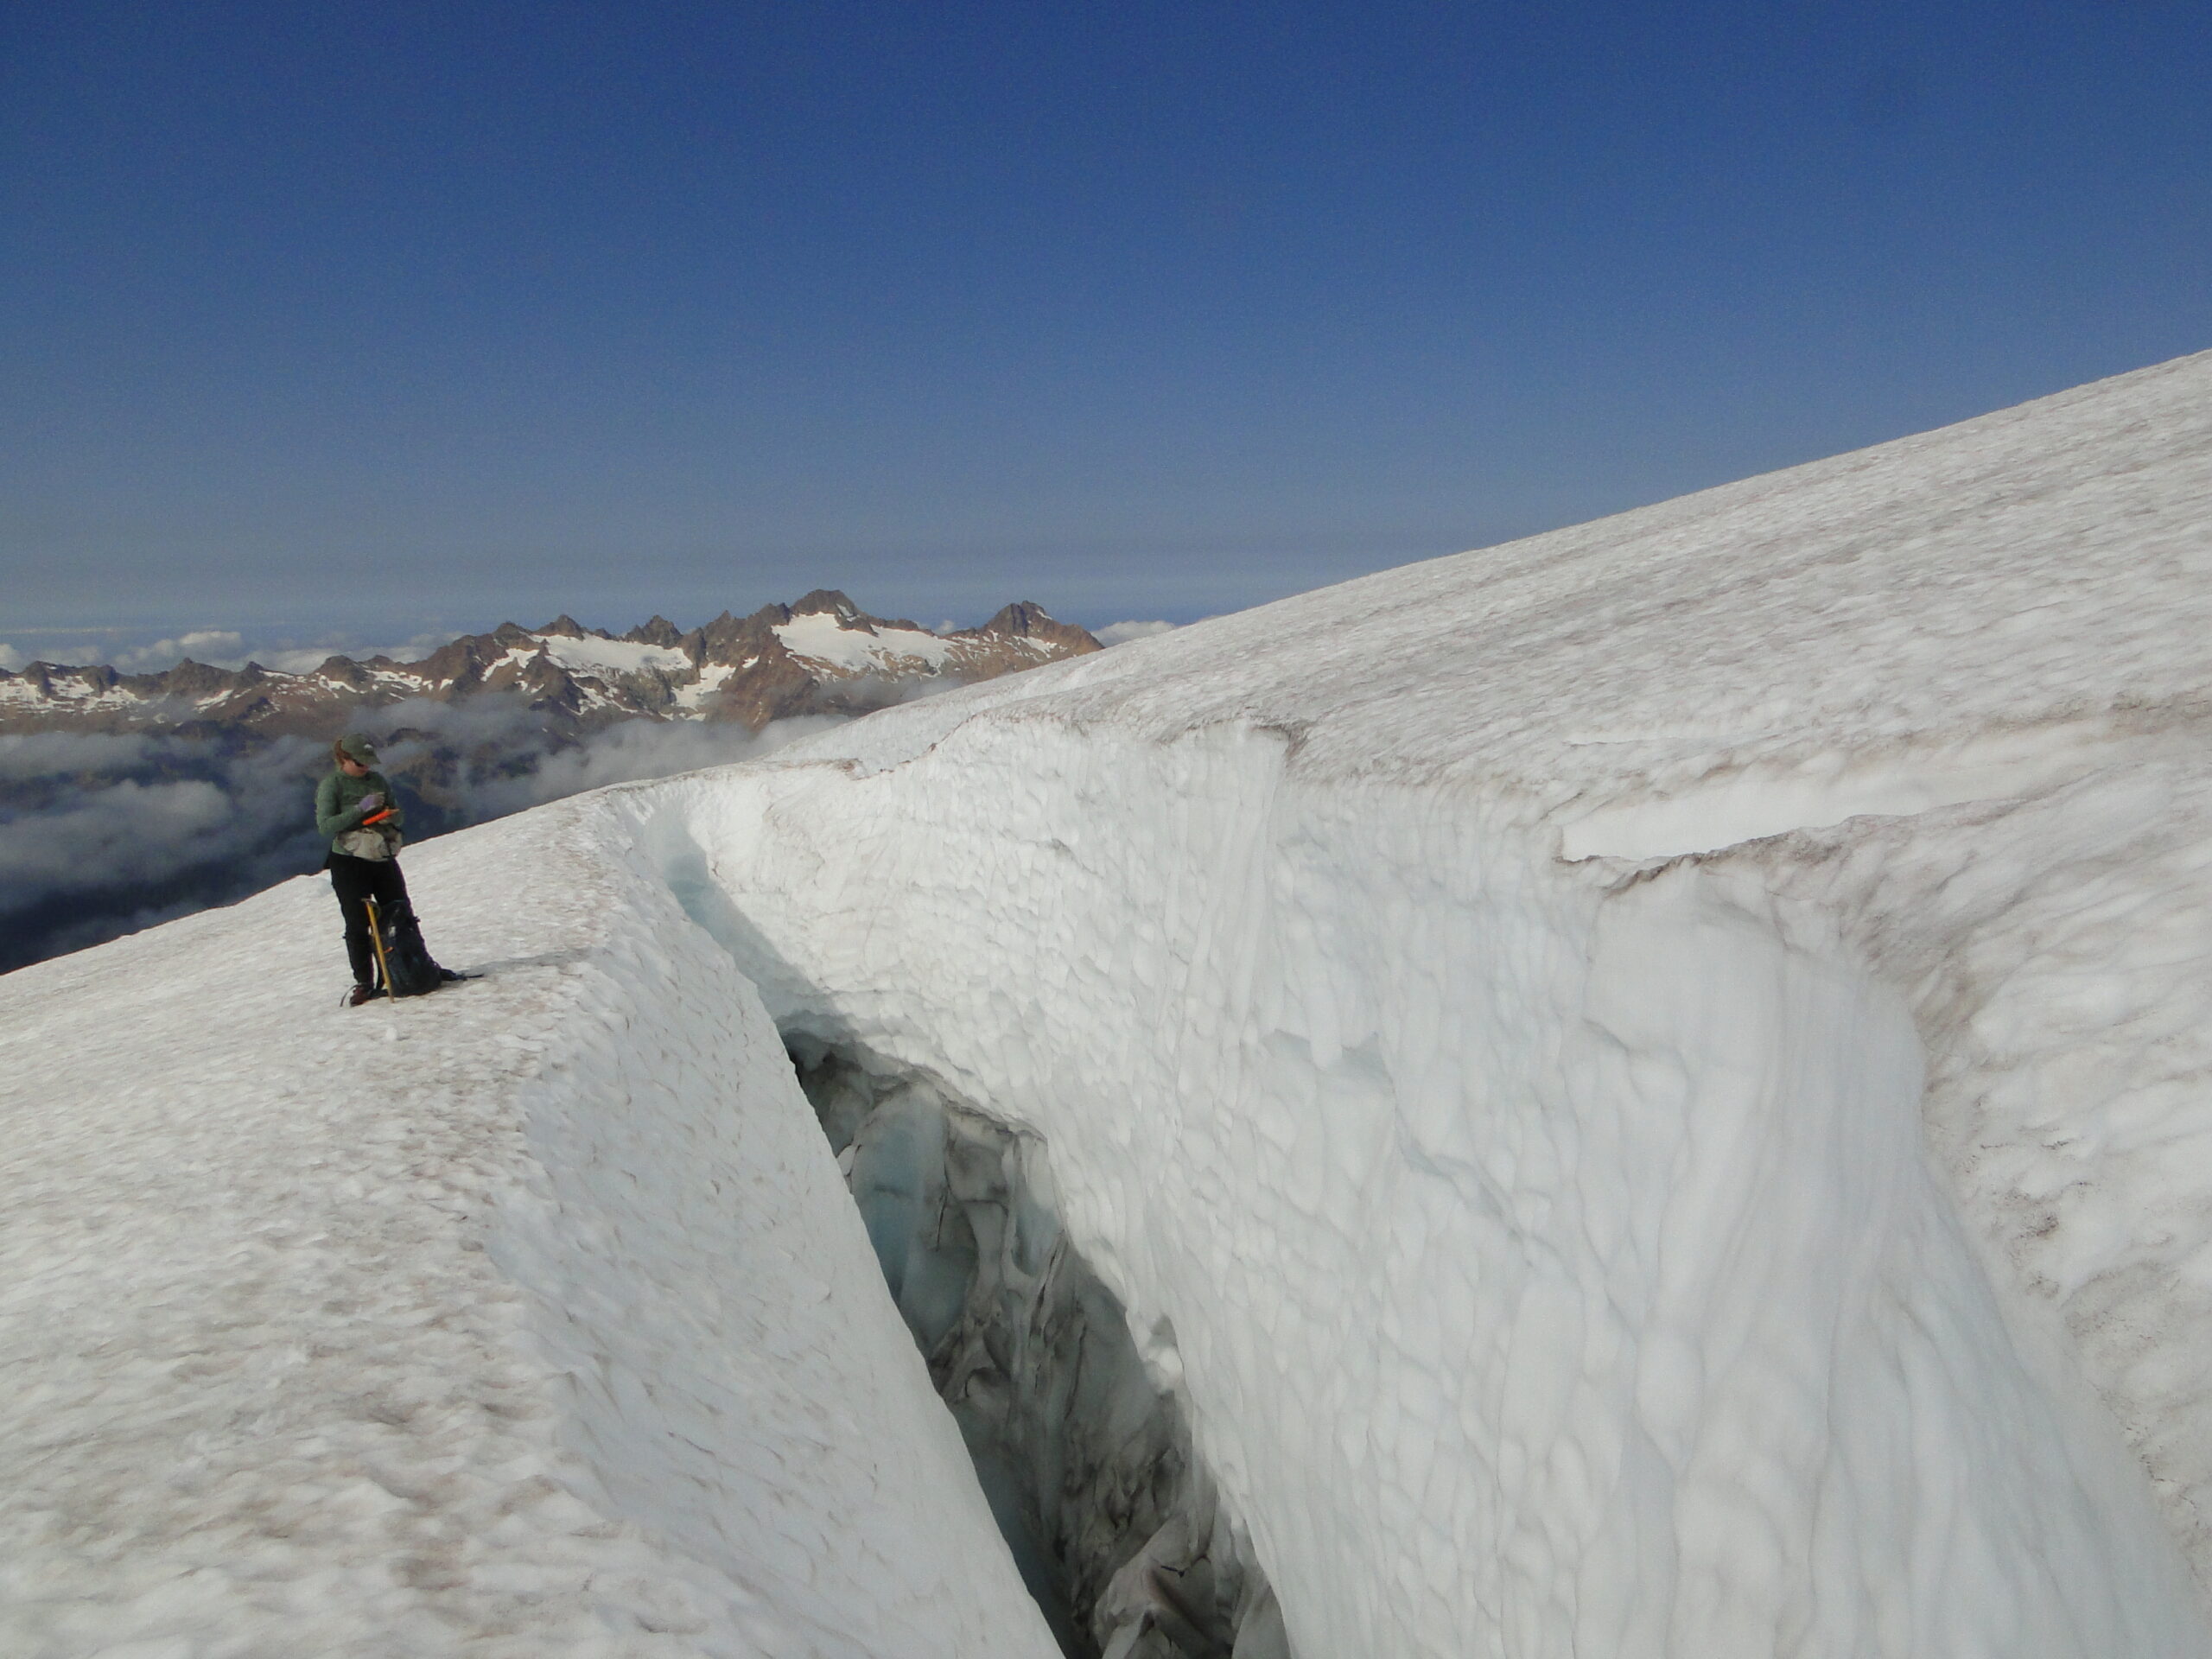
Snow depth at 2100 m on Aug 10th, 2022 on Easton Glacier