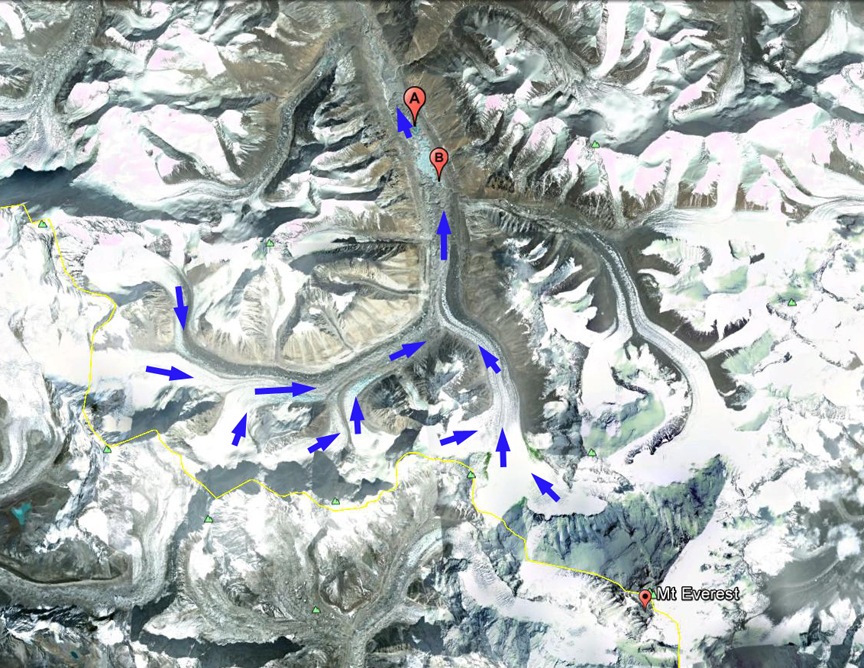
Mount Everest region snowline identified on Dec. 11, 2019 Landsat image (yellow dots). Green dots indicate the terminus and pink arrows flow direction of specific glaciers: T=Trakarding, DN=Drogpa Nagtsang, M=Melung, BK=Bhote Koshi, S=Shalong, Y=Yanong, G=Gyabarg, YN=Yanong North, GY=Gyachung, J=Jiuda, R=Rongbuk, ER=East Rongbuk, I=Imja, L=Lhotse, M=Marala, K=Khumbu, N=Ngozumpa.
The winter monsoon for the Himalaya is a dry cold period with limited new snow accumulation. The Landsat image of Dec. 11, 2019 highlights the snowline at 5500-6200 m on glaciers around Mount Everest. This high of an elevation indicates the accumulation area of the glaciers is too small to sustain the current ablation areas. This is explored in detail below. King et al (2019) found during the 2000-2015 period Himalaya mass balance losses of debris-covered and clean-ice glaciers to be substantially the same, with mass balance loss for lake-terminating glaciers being significantly higher. The overall mean was −0.39 m/year. Maurer et al (2019) found a doubling of the average rate of loss across the Himalaya during 2000–2016 relative to the 1975–2000 interval. King et al (2017) observed the mass balance of 32 glaciers in the Mount Everest area from 2000-2015 finding a mean mass balance of all glaciers was −0.52 m/year, increasing to -0.7 m/year for lake terminating glaciers. Brun et al (2017) identify a mean balance of -0.33 m/year for 2000-2016 in Eastern Nepal, similar to King et al (2019) and not the highest loss rate in the region. Dehecq et al (2018) examined velocity changes across High Mountain Asia from the 2000-2017 period identifying a widespread slow down in the region. The key take away is warming temperatures lead to mass balance losses, which leads to a velocity slow down, and both will generate ongoing retreat.
For an alpine glacier to be in equilibrium requires at least 50% of its area to be in the accumulation zone, this is the accumulation area ratio (AAR). On Dec. 11, 2019 the snowline indicates where the accumulation zone begins. The elevation ranges from 5500 m on Melung Glacier to 6200 m East Rongbuk Jiuda and Gyabarg Glacier. The area above the snowline, AAR, is less than 30% of the total glacier on: Trakarding, Drogpa Nagtsang, Melung, Bhote Koshi, Shalong, Yanong, Gyabarg, Jiuda, Rongbuk, East Rongbuk, Imja, Lhotse, Marala Glacier. Gyachung and North Yanong Glacier have an AAR between 30 and 40%. Khumbu and Ngozumpa Glacier have a high mean elevation and an AAR of close to 50%.
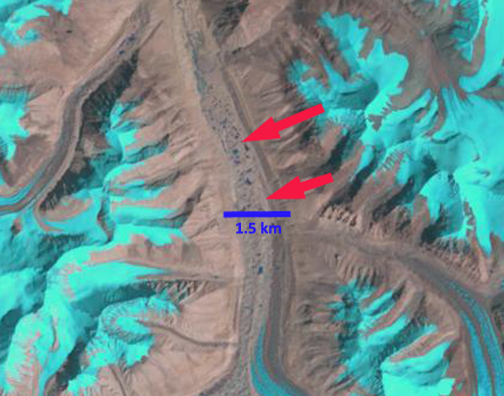
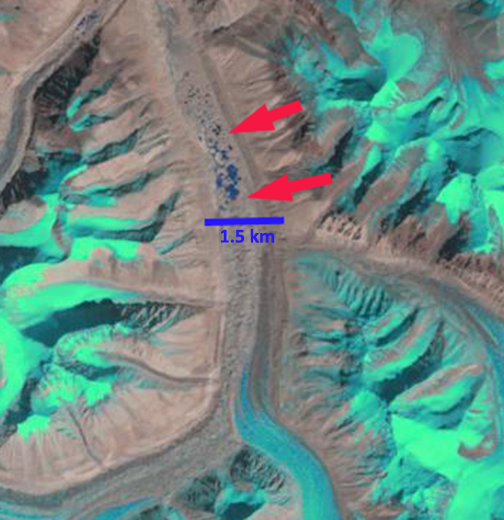
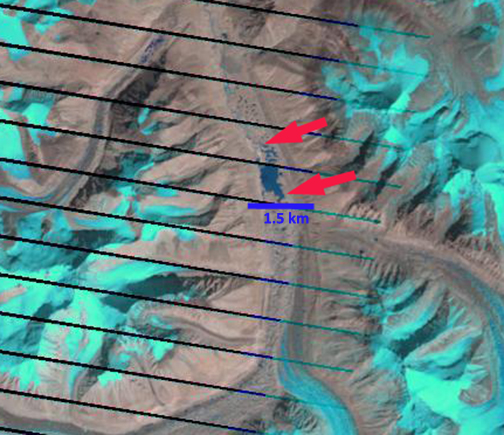
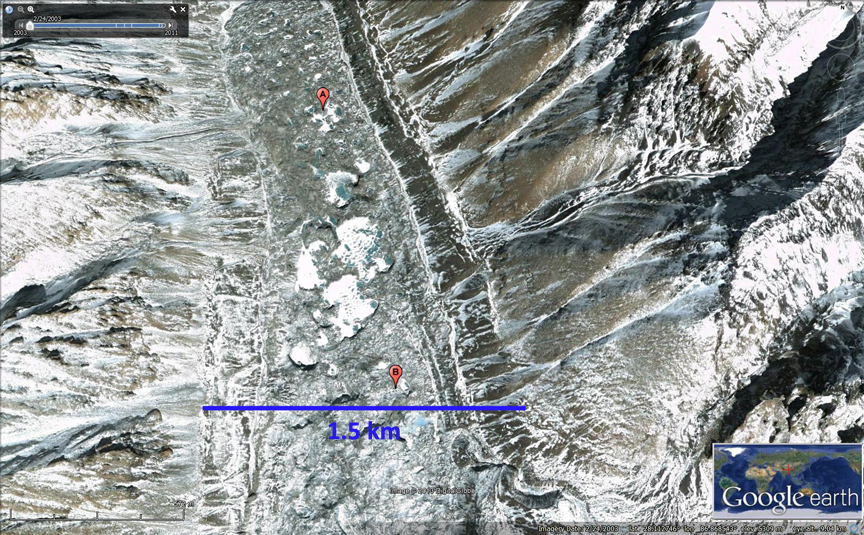
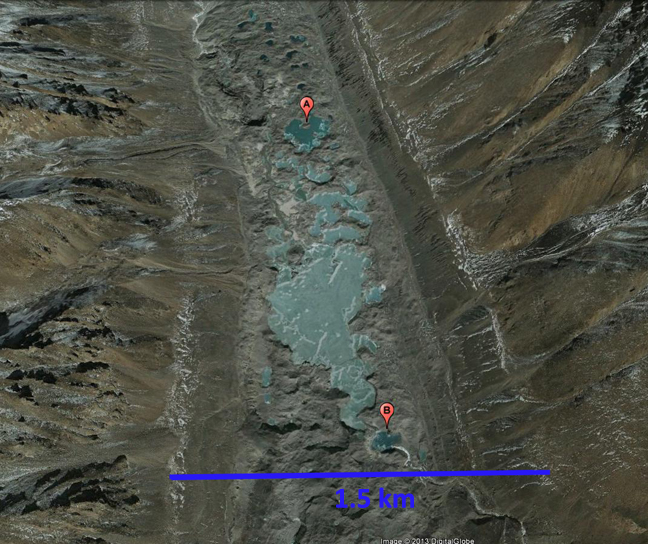
In 2015 and again in 2018 high winter snowlines indicated the same process in the Mount Everest region. See below the rise from Nov. 2017 to Feb. 2018 to similar elevation as seen in Dec. 2019. The high snowlines indicate an accumulation area that is too small to maintain these glaciers, which drives continued retreat, such as reported at Drogpa Nagtsang and Yanong Glaciers.
Dec. 11, 2019 snowline:
6200 m =East Rongbuk, Jiuda, and Gyabarg
6100 m = Gyachung,
5900 m= Rongbuk, Imja, Lhotse
5800 m=Trakarding, Melung, Yanong North
5700 m= Ngozumpa, Drogpa N., Yanong, Shalong, Bhute Khosi
5600 m= Marala, Khumbu
5500 m= Melung
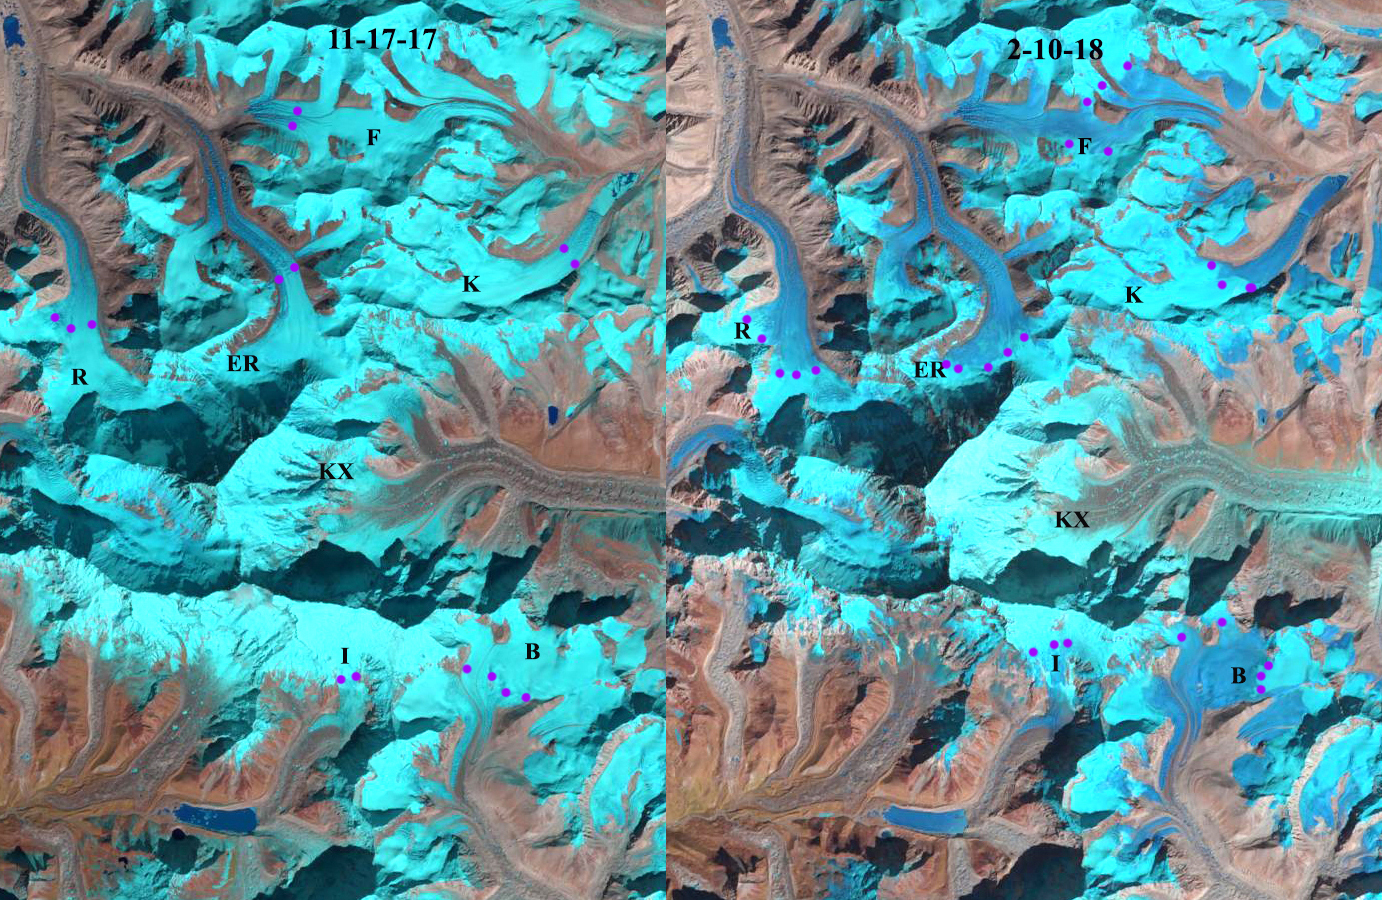
Landsat images from Nov. 17 2017 and Feb. 10 2018 indicate a rise in the snowline, purple dots, on glaciers east of Mount Everest, indicating ablation even in winter from the terminus to the snowline. Rongbuk Glacier=R, East Rongbuk Glacier=ER Far East Rongbuk Glacier=F, Kada Glacier=K, Barun Glacier=B, Imja Glacier=I and Kangshung Glacier=KX.