Arnesenbreen, Svalbard Retreat, Separation and Surge

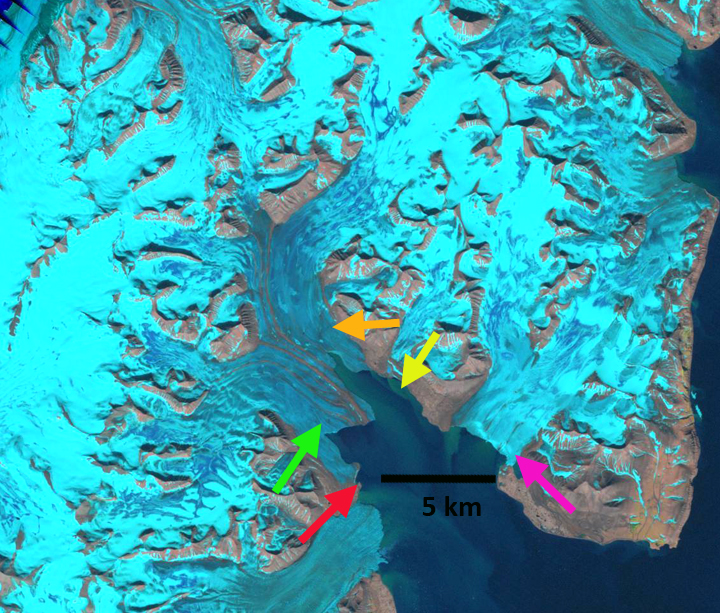
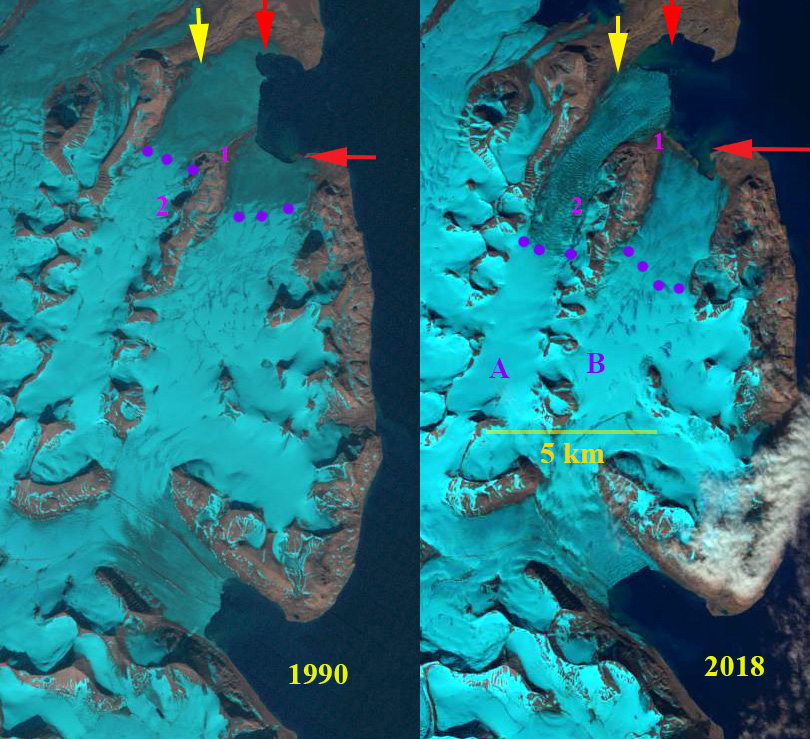
Arnesenbreen (A) and Bereznikovbreen (B) in 1990 and 2018 Landsat images.  Red arrow is 1990 terminus location, yellow arrow the 2018 terminus location and purple dots the transient snowline.

Arnesenbreen and Bereznikovbreen are glaciers in Svalbard on the east coast of Spitsbergen that in 1990 had a joint calving front near Kapp Murchison. Blaszczyk et al’s (2009) analysis identified 163 Svalbard glaciers that are tidewater with the total length calving ice−cliffs at 860 km for the 2001-2006 period. They observed that 14 glaciers had retreated from the ocean to the land over the last 30–40 year period. Some of these are surging glaciers, which are common in Svalbard.  Arnesenbreen was observed to surge in the 1930’s and in 2018 a surge was observed that was initiated from its terminus, which is a more unusual type of surge (Holmund, 2018).  Sevestre et al (2018) document mechanisms that help generate terminus initiated surges, include tidewater retreat from a pinning point and/or crevasses allowing meltwater rainwater to access the bed. The surge generated considerable crevassing that extended from the tidewater terminus to an elevation of 300 m, 5 km inland of the terminus. Here we examine the behavior of these glaciers using Landsat imagery from 1990-2018.

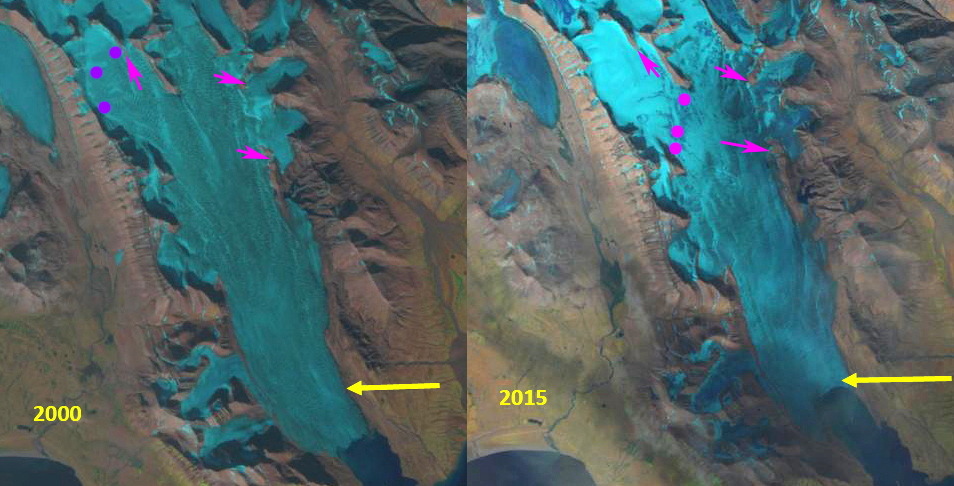
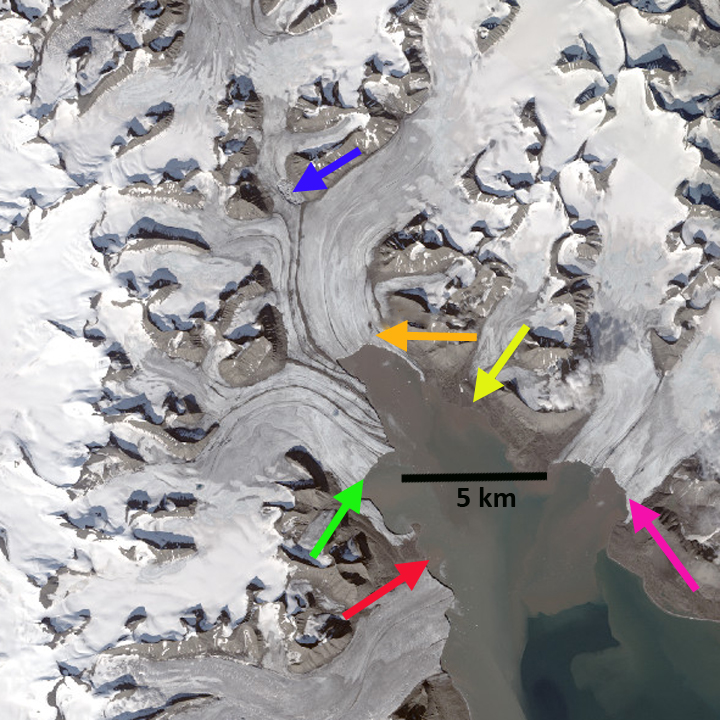
In 1990 Arnesenbreen-Bereznikovbreen had a shared 5 km long tidewater front. The transient snowline in this July image is at 200 m. The glacier terminus reach is not extensively crevassed.  In 2002 the two glaciers are separating at Point 1 each having retreated ~400-500 m, crevassing remains limited.  The transient snowline in 2002 is at 300 m. By 2014, Arsenenbreen has retreated 1400 m since 1990 and crevassing remains limited.  The transient snowline is at 300 m, though there is a saturated zone of snowpack above this line, that suggests extensive melt up to 500 m.  In 2018 the surge crevassing was most apparent in the April image of Holmund (2018).  On June 30 the extensive crevassing is still evident, particularly in the 200-250 m elevation band near Point 2, but is reduced from April in the terminus zone near Point 1.  By July 21 the image indicates much reduced calving in the terminus zone of the glacier.  Sevestre et al (2018) note a pattern of terminus initiated surge progression, “Upward migration of the surge coincided with stepwise expansion of the crevasse field.” This is exactly what is seen at Arnesenbreen, we are also seeing the surge terminating with calving reduction at the terminus first.  The short lived nature of the surge indicates the limited impact on the longer term retreat. The surge did not lead to a reconnection with Bereznikovbreen. Bereznikovbreen has retreated 700-800 m since 1990 and Arnesenbreen has retreated ~1500 m from 1990-2018.

The ongoing retreat here is like that of Svalbard glaciers in general including surging glaciers (Nuth et al 2013).  Strongbreen Glacier has separated from key tributaries. The ongoing retreat has prompted the question on other surging Svalbard glaciers, can the glaciers continue to surge? On Fridtjovbreen it appears a future significant surge is unlikely.  For Arnesenbreen the terminus reach below 150 m is where the glacier expands laterally and is an area of reduced slope.  This configuration remains and would allow further surges unless further retreat of more than ~1500 m occurs.

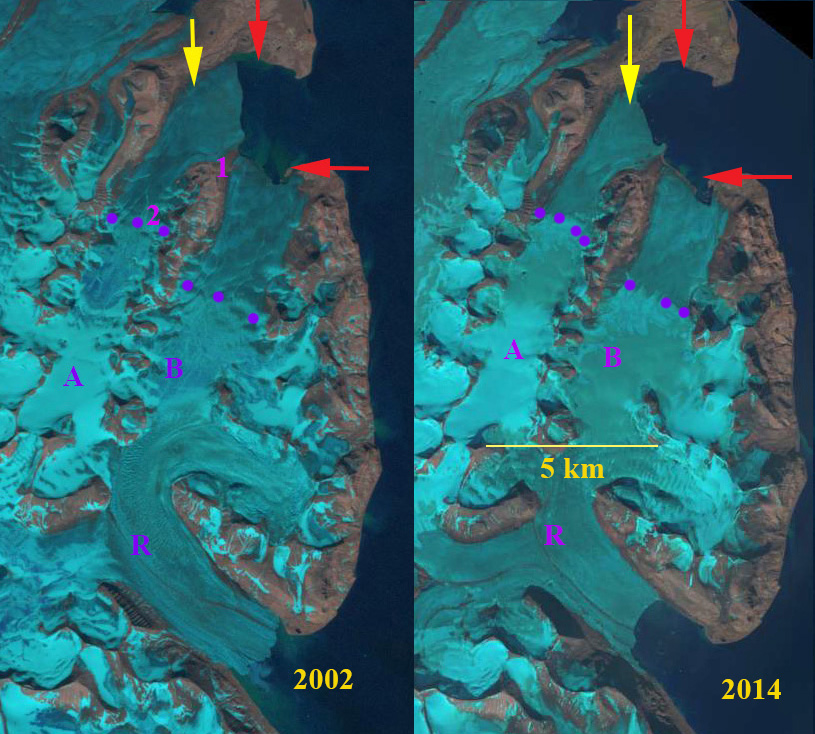
Arnesenbreen (A) and Bereznikovbreen (B) in 2002 and 2014 Landsat images.  Red arrow is 1990 terminus location, yellow arrow the 2018 terminus location and purple dots the transient snowline.

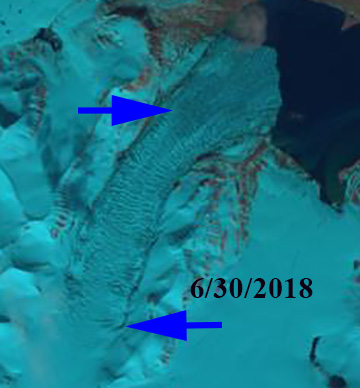
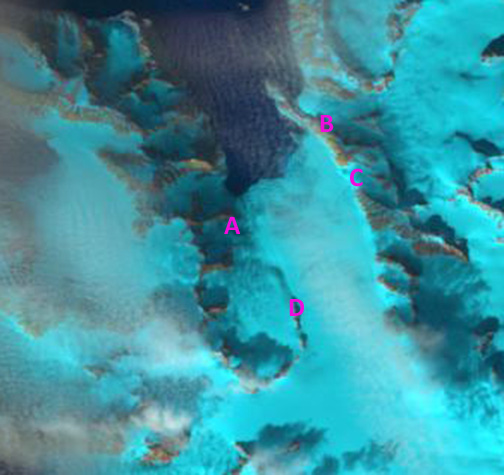
Arnesenbreen in Landsat image from6/3/2018 indicating zone of most extensive crevassing.

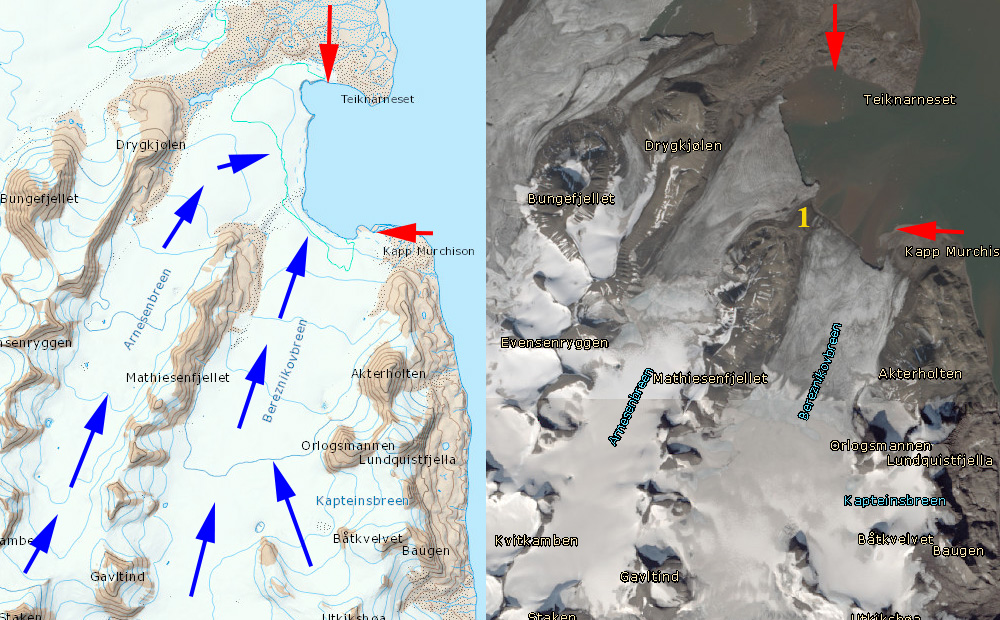
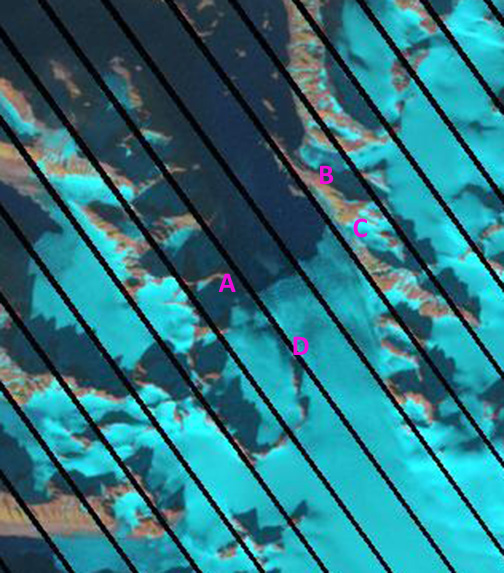
Arnesenbreen (A) and Bereznikovbreen (B) in Toposvalbard map and recent Landsat imagery from Toposvalbard.

Monacobreen Separates from Seligerbreen, Svalbard

Monacobreen Separation from Seligerbreen in 1999 and 2016 Landsat images.  The red arrow is the 1999 terminus location and yellow arrow the 2016 terminus location. 

Moancobreen  is a glacier that terminates at the head of Liefdefjorden , a branch of Woodfjorden in Spitsbergen, Svalbard. NW Spitsbergen is a region that has experienced extensive long term glacier thinning from 1965 to 2007 (Nuth et al, 2010). Svalbard is host to 163 tidewater glaciers with a collective calving front of 860 km (Błaszczyk et al, 2009), Monacobreen has a 4.4 km wide calving front.  The glacier has surged in the past. Oceanwide Expeditions has expeditions to the region that capture the beauty including the polar bears and ringed seals of the area. 

In 1999 Seligerbreen and Monacobreen had a joint terminus that was 6.5 km wide.  By 2013 the glaciers had separated and the tidewater terminus of Monacobreen was 4.4 km long.  Monacobreen had retreated 2200 m from 1999-2016. The snowline in 2016, see below, was at 525 m.  There are significant melt features apparent in the 2013 Google Earth image of the 500 m elevation area and melt ponds in the 1999 image. The retreat of Monacobreen  is similar to that of most tidewater glaciers in Svalbard such as,  PaierbreenHornbreen and Svitjodbreen.

Google Earth image of Monacobreen from 2013, indicating separation had occurred, note plume of sub glacial meltwater outflow. 

TopoSvalbard place name image of the area

Landsat image indicating melt features and snowline in 1999 and 2016 Landsat images. 

Melt water drainage features in the region from 400-550 m on Monacobreen

Has Fridtjovbreen, Svalbard Surged for the last time?

fridtjovbreen-compare

Fidtjovbreen, Svalbard comparison in 1998 and 2016 Landsat imagery.  Red arrow marks the 1998 terminus, yellow arrow the 2016 terminus and purple dots mark the snowline.  The Yellow numbers indicate area of separation between glaciers. Pink arrows indicate areas on the upper glacier where thinning is exposing more bedrock. F=Fridtjovbreen, S=Sagabreen, G=Gronfjordbreen

Fridtjovbreen, Svalbard, is a tidewater-terminating glacier that started a 7-year surge advance during the 1990’s. This central Spitsbergen glacier drains into Van Mijenfjorden and is currently 13.5 km long.  The glacier advanced ~2.8 km during a surge in the 1990’s at a maximum rate of ~4 m per day (Murray et al, 2003).  Murray et al (2012) observed that from 1969 to 1990, the glacier retreated ~500 m and lost 5% of its volume.  During this interval the glacier thinned up to 60 m in the lower elevations while thickening up to 20 m in its higher elevations. The upper part of the glacier is considered the reservoir zone, which after sufficient thickening and slope increase versus lower glacier glacier, receiving zone, surges yielding an increased flux into the receiving zone. If the reservoir zone is not an accumulation zone due to climate change, than the surge mechanism in this case is lost.  Murray et al (2012) observed that the reservoir zone thinned by up to ~120 m and the receiving zone thickened by ~140 m during the most recent surge. Lonne et al (2014) examined glacial surges in Svalbard noting they are protracted and characterized by individual dynamic evolution. Fridtjovbreen provides a well documented example of a 12 year (1991–2002) surge. that Lonne et al (2014) report  relocated 5 km2 of ice into the fjord, yet 15 years later leaves little visual evidence behind. The advance led to the overriding of Sagabreen (S) observed by Glasser et al (1998).

The most recent surge occurred in a climate of decreasing overall ice volume, but in an environment of accumulation zone thickening on Fridtjovbreen (Lonne et al 2014). Here we examine Landsat imagery that illustrates both retreat from 1998 to 2016 and that instead of thickening during the quiescent phase, high snow lines have led to thinning even at the head of the glacier.  From 1998 to 2016 the glacier has retreated 2.2 km.  This had led to separation from Sagabreen (1) from Fridtjovbreen.  Thinning at higher elevations had led to bedrock expansion at each pink arrow in the comparison of 1998 and 2016, as well as the 2000 to 2015 imagery below.  In each of the four years the snowline has risen to above 500 m by the end of the melt season.  In 2016 the image is from the end of July, by early September the snowline had risen well above 500 m. There is also separation of glaciers adjacent to Gronfjordbreen at an elevation of 300 m, at Point 2 and 3. This implies that the reservoir zone is losing mass and cannot initiate a future surge. The thinning, retreat and volume loss parallels that of other glaciers in the area, that are not surging Frostisen and PaierbreenLonne et al (2014) note that although the surge mechanism itself is unrelated to climate, climatic conditions play a major role in the course of a surge.  I would add that climate can eliminate the potential for a surge if the reservoir region is no longer an area of accumulation, without which there will not be thickening.

fridtjovbreen-landsat-tsl

Fridtjovbreen, Svalbard comparison in 2002 and 2015 Landsat imagery.  Yellow arrow the 2016 terminus and purple dots the snowline.  Purple dots indicate the snowline and Pink arrows indicate areas on the upper glacier where thinning is exposing more bedrock. 

 fridtjovbreen-map

Strongbreen Retreat, Fjord Expansion, Svalbard

Strongbreen is a glacier in Svalbard on the southern part of Spitsbergen draining east into the Kvalvagen Fjord. Blaszczyk et al’s (2009) analysis identified 163 Svalbard glaciers that are tidewater with the total length calving ice−cliffs at 860 km for the 2001-2006 period. They observed that 14 glaciers had retreated from the ocean to the land over the last 30–40 year period. One glacier they observed having separated from neighboring glaciers was Strongbreen, which they noted was retreating at a rate of approximately 40 m/year since the previous inventory. The glacier had been connected with the Kvalbreen and Perseibreen Glacier. They also identified this as a surging glacier with the last known surge in the 1870’s.
strong breen map
strongbreen place
Map from TopoSvalbard

Here we examine Landsat images from 1990. 2002, 2014 and a Digital Globe image from 2010, to identify changes in the glacier over the last 25 years, the colored arrows are in the same location in each image. In 1990 the glacier extended down fjord to the red arrow and yellow arrow on the south side and north side of Kvalvagen respectively. On the southern side the terminus is at Sergievskijfjellet. Kvalbreen at the pink arrow terminates nearly parallel with the northern shore of the fjord. At the blue arrow is the glacier junction with a very small glacial dammed lake between the glacier and the adjacent mountain. By 2002 a small fjord is beginning at the pink arrow where Kvalbreen terminates. Strongbreen on the southern side of the fjord has a much narrower connection to the peninsula at the red arrow and has retreated on the north side from the yellow arrow. By 2014 the glacier has retreated to the green arrow on the southern side of the fjord from the red arrow, a distance of 3.75 km in 24 years. On the northern side the glacier has retreated almost to the orange arrow a similar distance of 3.5-3.8 km. This is a retreat of 150 m/year for Strongbreen quite an acceleration. Kvalvagen has retreated 1 to 1.25 km up the newly developing fjord, a retreat of 1 km in 25 years, 40 m/year. The glacial dammed lake at the blue arrow has expanded. A better view of this lake is in the 2010 image, last one, indicating that the lake now is almost half the tributary glacier width. The expansion of this lake will lead to this tributary having a separate terminus and undermine the stability of the lower section of Strongbreen.

The lower portion of the glacier is largely uncrevassed indicating quite slow velocities. Blaszczyk et al (2009) report a velocity of less than 30 m/year from 2000-2006. The low slope, limited crevassing, expanding supraglacial lake all indicate continued retreat. It then seems likely the glacier will separate into two fjords with a southern and a northern arm. The only thing that could forestall the retreat for a brief period is a surge as happended on nearby Perseibreen in 2000 (Dowdeswell and Benham, 2003). The retreat of this glacier paralells that of other glaciers in southern Svalbard: Vasilievbreen, Olsokbreen, Hornbreen and Hambergbreen.

strongbreen 1990
1990 Landsat image

strongbreen 2002
2002 Landsat image

strongbreen 2014
2014 Landsat image

strongbreen image
2010 Digital Globe image posted in TopoSvalbard.

Svitjodbreen Retreat, Northwest Svalbard

Svitjodbreen is a 10 km long tidewater outlet glacier in northwest Svalbard, Albert Land. The glacier drains north into Fugelfjorden, the highest elevation of the main glacier is 600 meters with a few neighboring peaks reaching 800 m, not very high. NW Svalbard is a region that has experienced extensive long term thinning from 1965 to 2007 (Nuth et al, 2010), with an average glacier wide thinning of 0.5 m/year and frontal thinning of over 1 m/year. nw svalbardjarlbreen overview copyThe retreat is similar to that of Southern Svalbard at Hornbreen and Hambergbreen and much faster than in Eastern Svalbard at Edgoya. Here we examine Landsat images from 1987, 2000 and 2011 and a Google Earth image from 2009. In each image there are four fixed points: Point A is on the south side of the ridge just south of Rissabreen. Point B is at a small peak, Hirdfjellet. Point C is at the beginning of the Skutelen Peninsula just south of Hirdfjellet and Point D is a small bedrock ridge. In 1987 the terminus extends across the 2 km wide fjord one kilometer north of the ridge on the west side of the glacier labelled A and extends directly across the fjord to Point B. Point D is 3 km behind the glacier front and Point C is 1.5 km from the ice front. By 2000 the western side of the terminus has retreated nearly 500 meters and the east side by Point B very little. In 2011 the terminus has retreated beyond the bedrock ridge at Point A and extends across the fjord to Point C. The bedrock Point D is now just 1.6 km from the glacier front. Jarlbreen has retreated 1200 to 1500 meters from 1987 to 2011, with most of the retreat occurring after 2000.

jarlbreen 1987

jarlbreen 2000
jarlbreen 2012
The front of the glacier is heavily crevassed indicating considerable calving activity. Google Earth refers to this glacier as Jarlbreen, but Jarlbreen is east of the Skutulen Peninsula. The ridge at Point D has expanded as the glacier has thinned. Oerlemans et al (2011) noted a similar retreat rate for Hansbreen. They further determined that calving losses were of the same magnitude as melting losses. jarlbreen ge

Retreat of Nannbreen, Svalbard

Nannbreen is a 5 km long land terminating glacier in southwest Svalbard. The glacier is just north of Hornsund. During the course of the 20th century Nannbreen retreated from its Little Ice Age moraine complex forming a new proglacial lake. The glacier ends at an elevation of 150 meters descending from 600 meters, the snowline in several Landsat images from the last decade has been 400-450 meters. By 2000 (first image below)the glacier had retreated 750 meters from the moraine complex and the glacier ended in a lake, that was over 500 meters long. In 2010 (second image below) the glacier had retreated out of the lake, 250 meters of retreat in 10 years, 1000 meters of retreat in the last century. Certainly the 21st century retreat rate is far above the average 20th century retreat rate. Most of the large glaciers in Svalbard are tidewater calving glaciers, such as the nearby Hansbreen, which retreated 400 meters from 2000-2005. Svalbard glaciers have been losing considerable volume, indicative of negative mass balance and glacier retreat. Nuth et al (2010) concluded that over the past 40 years for Svalbard ice loss is 9.71 ± 0.55 cubic kilometers/year. This is an average thinning of 0.36 meters/year for an annual contribution to global sea level rise of 0.026 mm yr.