Roncagli Glacier Retreat, Tierra del Fuego, Chile

The Cordillera Darwin in Tierra Del Fuego, Chile is a remote area that is notorious for stormy, cloudy weather that makes for only a few good satellite images. Roncagli(Alemania) Glacier is the focus of this post and is an update to a previous post. The glacier has a terminus adjacent to the Beagle Channe(BC) and a secondary terminus in Lago Martinic (LM), 5 km upglacier. Velocity profiles by Melkonian et al (2013) indicate the highest velocities directed toward the LM terminus, making this the primary terminus. They also found that the glacier thinned by 5-10 m along most of its length from 2000-2011. Here we examine Landsat imagery from 1997 to 2014.
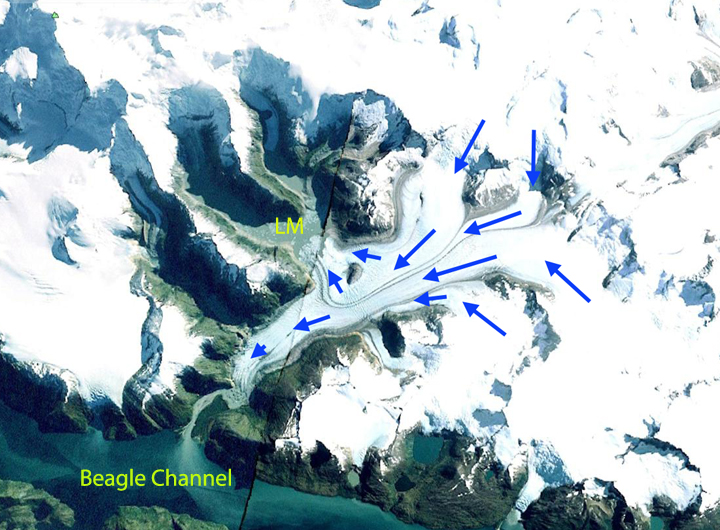
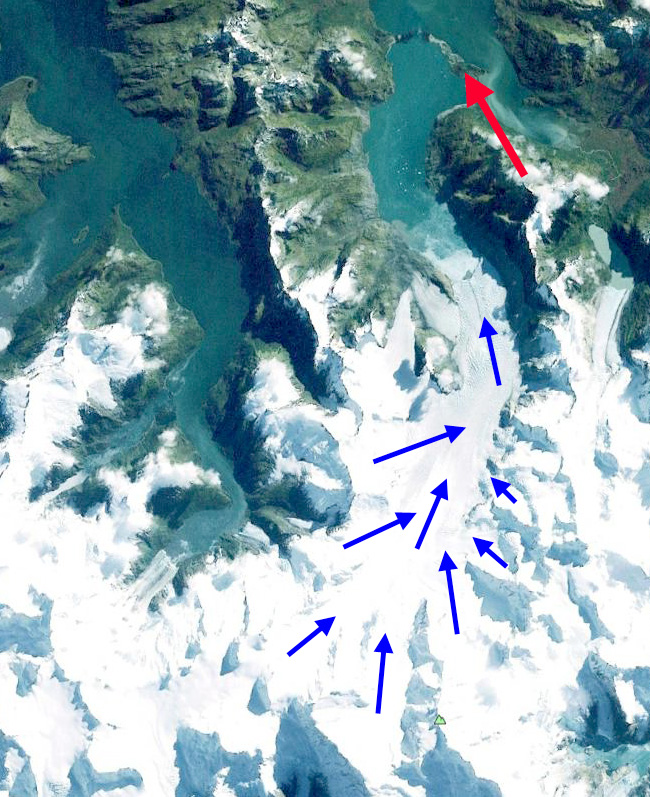
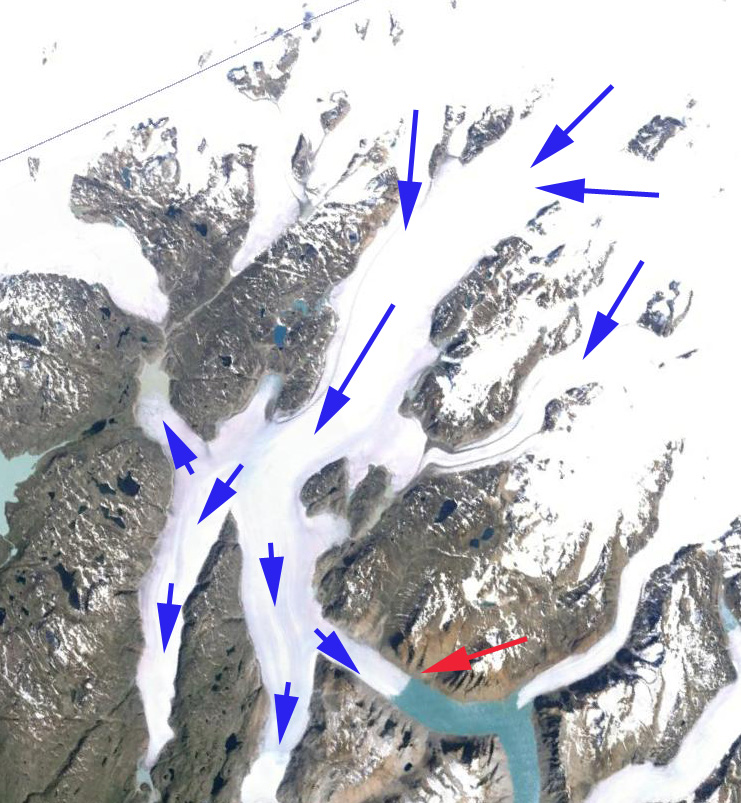
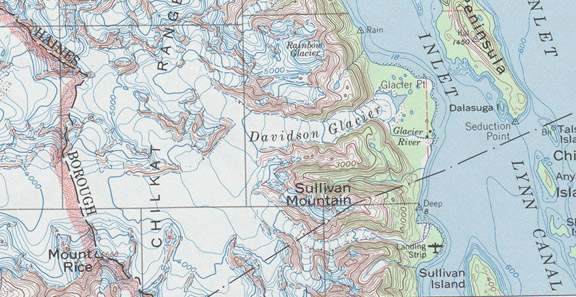
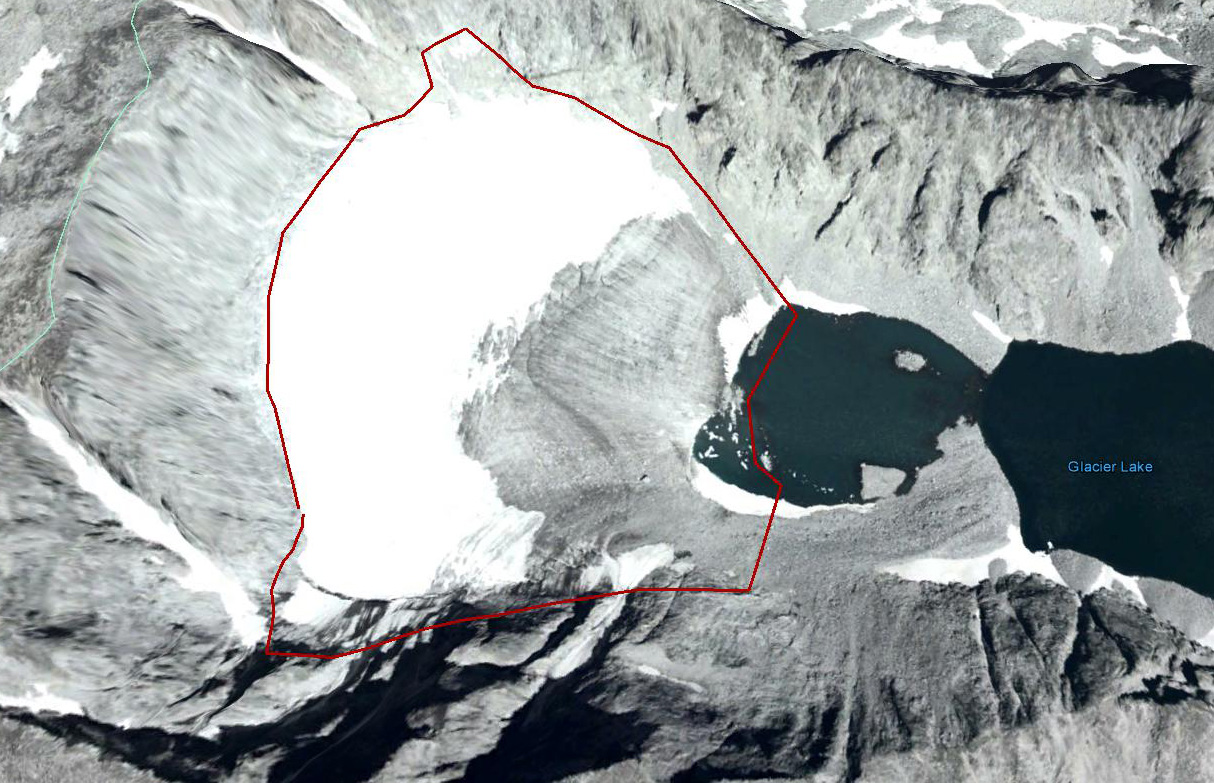
Roncagli ge
Googel Earth image
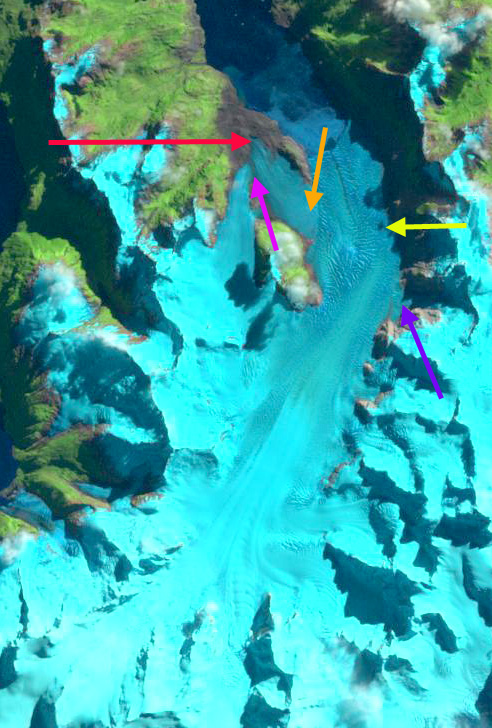
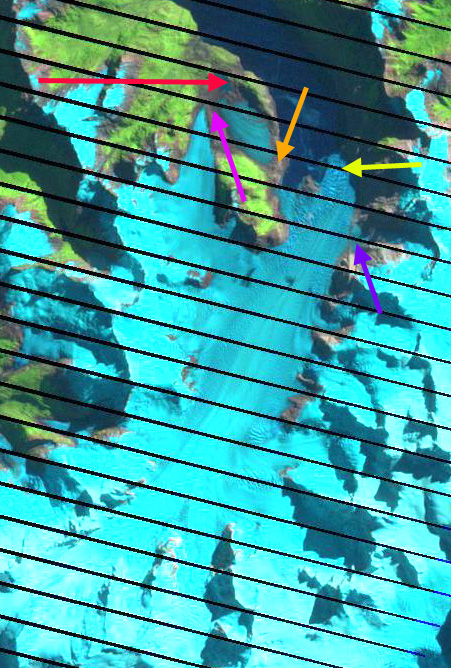
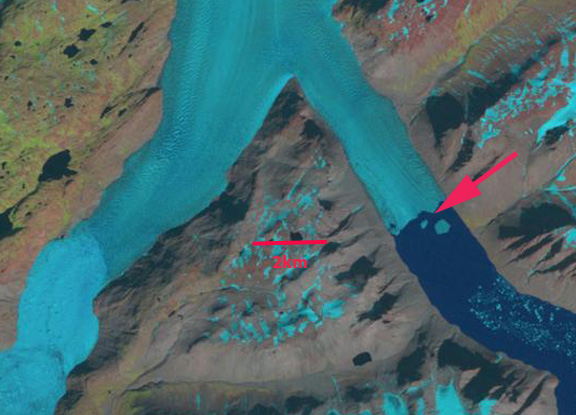
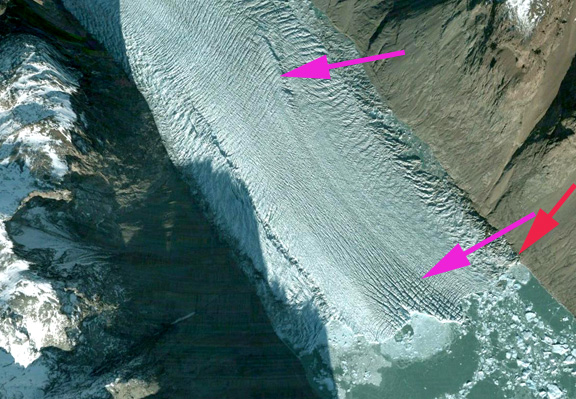
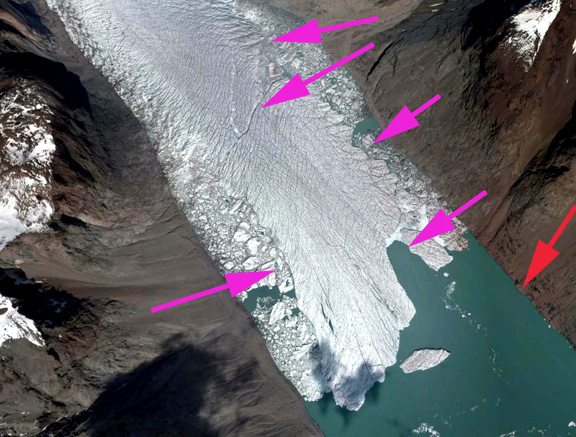
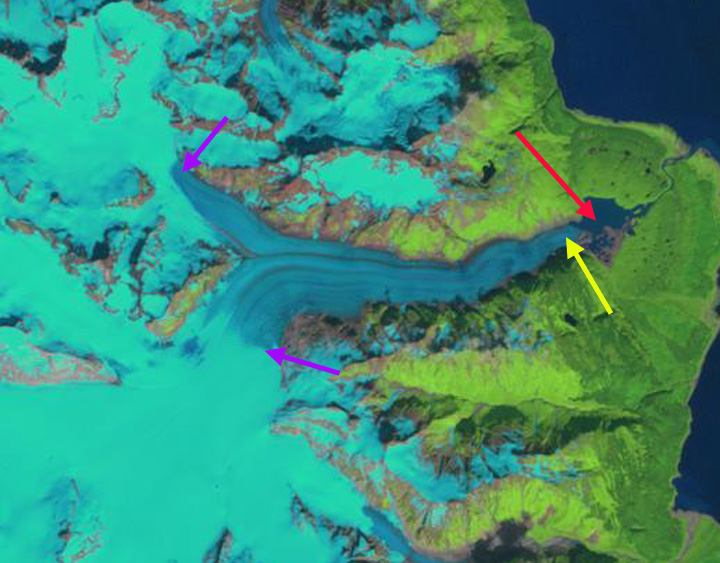
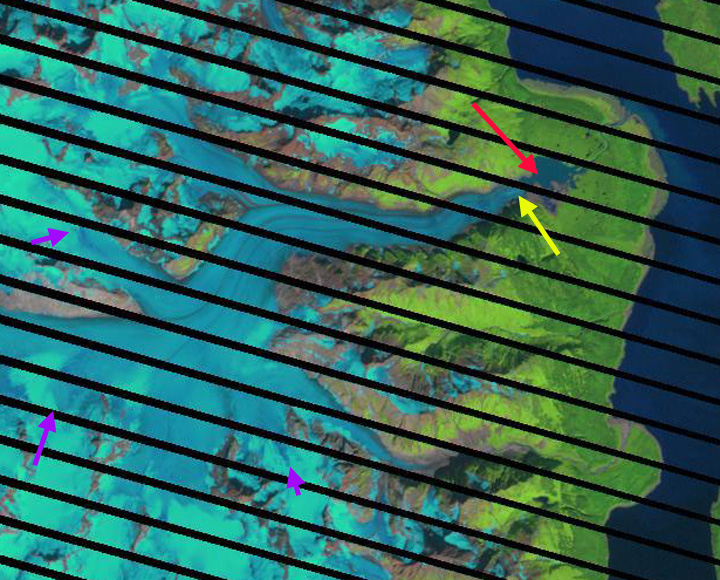
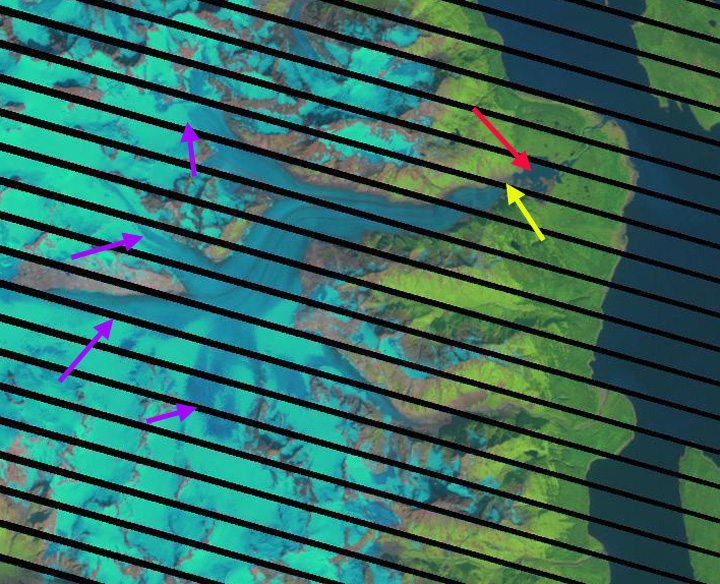
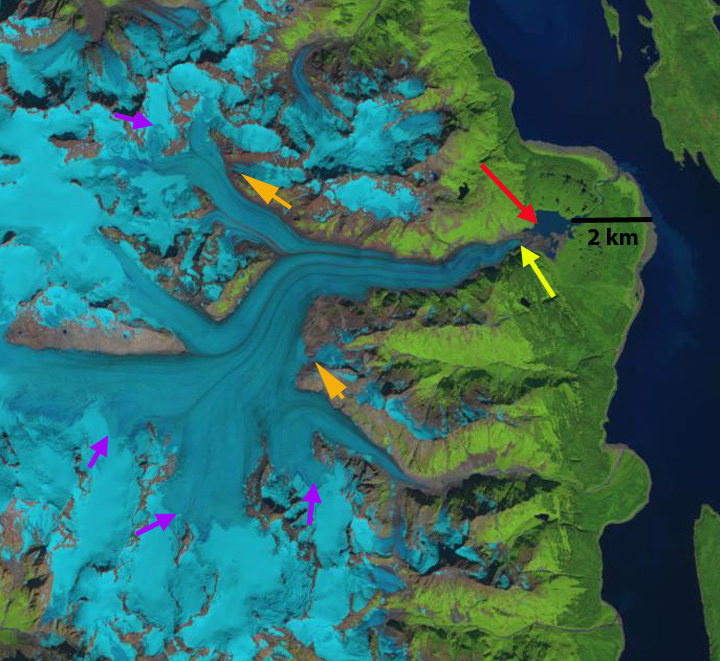
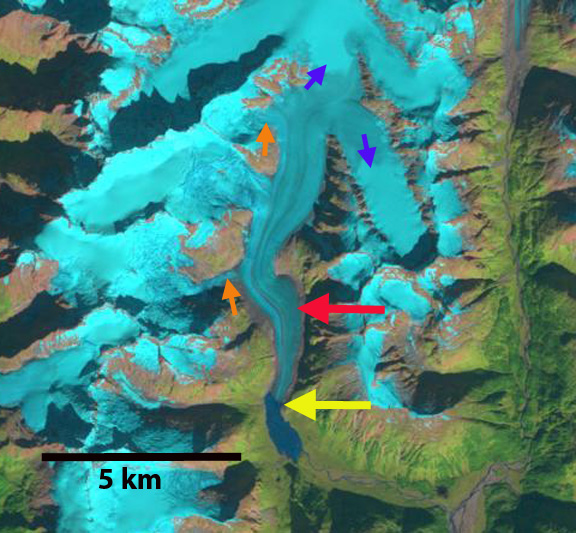
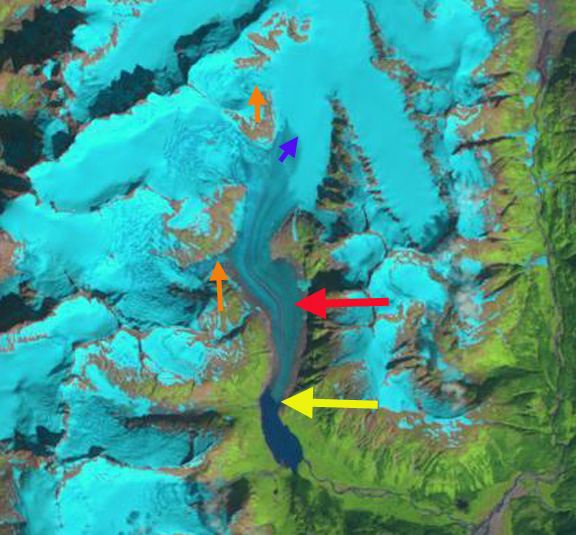
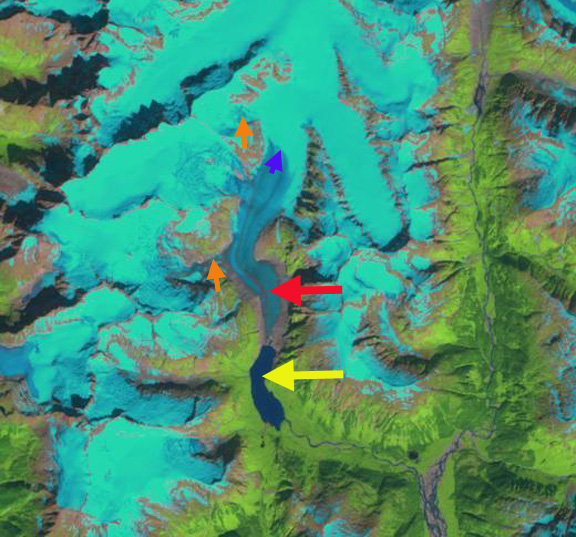
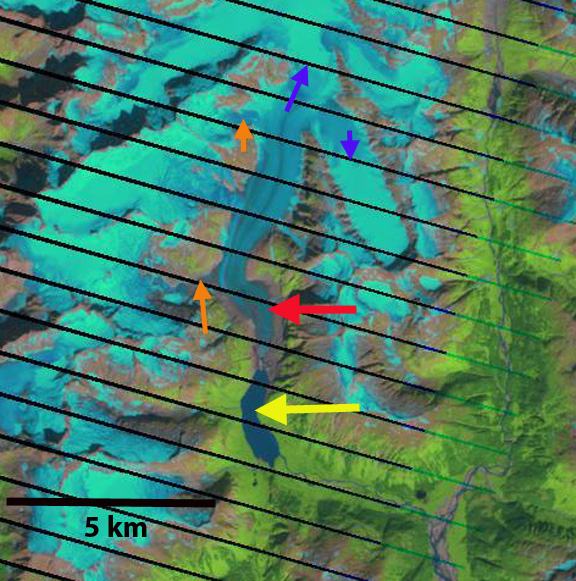
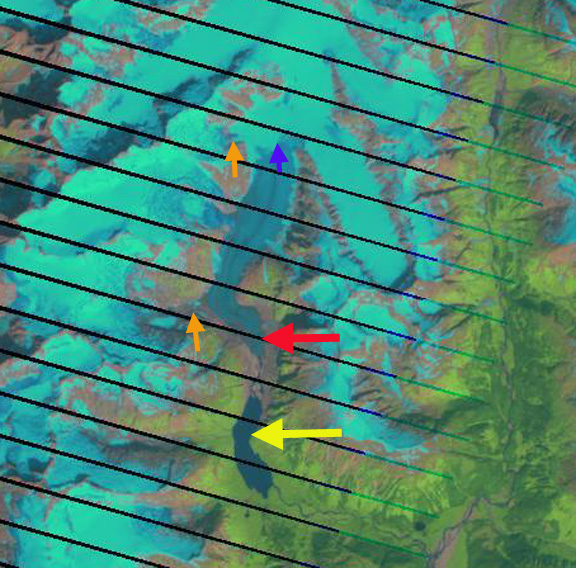
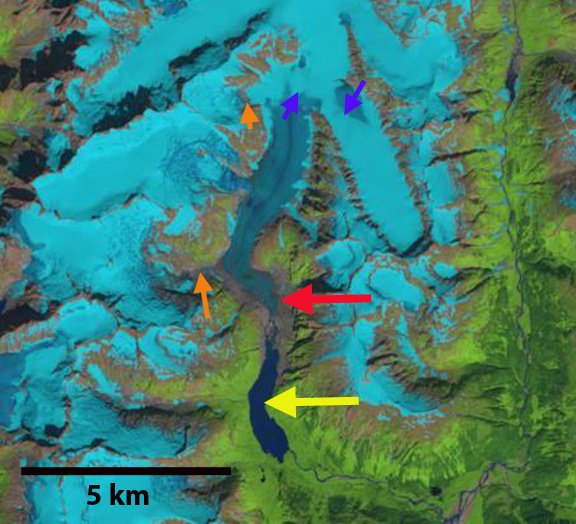
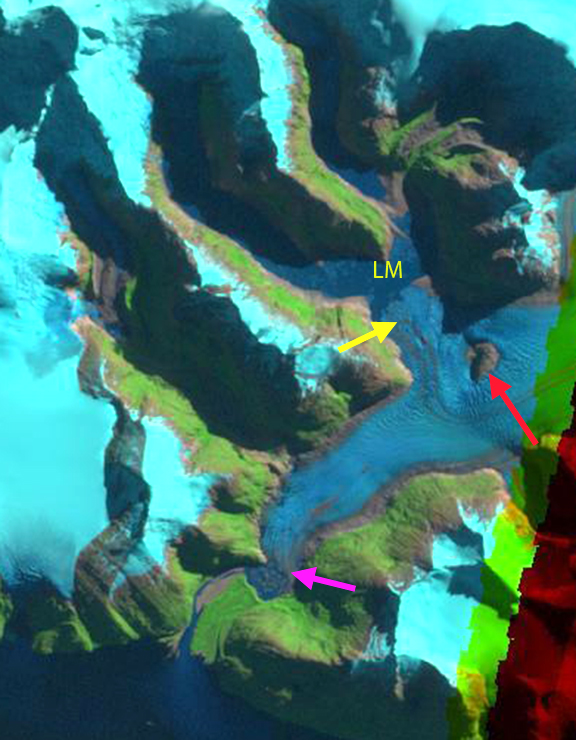
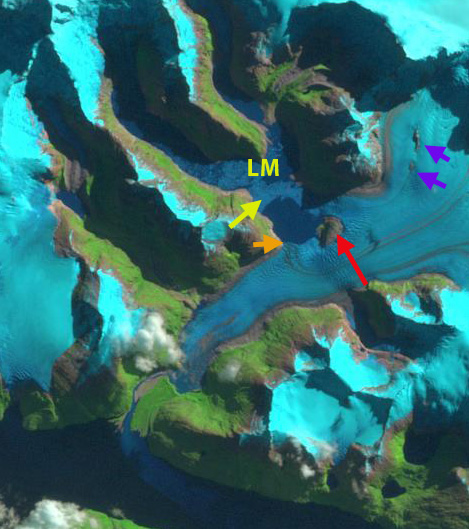
In 1997 the BC terminus at the pink arrow is at a narrowing of the valley. The LM terminus is at the yellow arrow with two primary glacier branches encircling the nunatak at the red arrow. In 2000 the terminus positions are relatively unchanged with the LM terminus actively releasing icebergs into Lago Martinic. Upglacier a single area of bedrock is emergent through the glacier, purple arrow. In 2001 the BC terminus remains unchanged, the water level in LM has declined exposing more bare rock surfaces around the LM terminus. By 2008 the LM terminus has separated, both still ending in the lake, the lake again is at a full stage on the date of the imagery. The lake experienced periodic filling and draining episodes during the 1997-2008 period. There are now two upglacier areas with exposed bedrock now. By 2014 the BC terminus has retreated 1 km along the southeastern margin and 200 m along the northwest side. This retreat from the pinning point that restricted calving at the pink arrow, suggests further retreat will occur in the near future. Lago Martinic has largely drained. The LM terminus has separated into two tongues and the former nunatak is no longer surrounded by glacier ice, red arrow. The retreat at LM terminus is 1500 m on the west side, orange arrow, and 800-1000 m on the east side. Upglacier both areas of bedrock that are emergent are expanding, purple arrows, indicating the thinning observed by Melkonian et al. (2013). The continued upglacier thinning indicates reduced flux to the terminus and continued retreat. The degree to which Lago Martinic can refill is uncertain, MODIS imagery from late 2014 shows the lake is still not filled. I have not seen imagery indicating even a nearly full lake in the 2011-2014 period. The rate of retreat is less than on Marinelli Glacier to the north or Glaciar Steffen.
racongli 1997
1997 Landsat image
racongli 2000
2000 Landsat image
racongli 2001
2001 Landsat image

roncagli 2008
2008 Landsat image
racongli 2014
2014 Landsat image

Marinelli Glacier Retreat, Chile

Marinelli Glacier, Chile is the largest glacier of the Cordillera Darwin Icefield. This ice cap is in Tierra del Fuego, a region famous for cloudy, stormy weather. Fernandez et al. (2011) indicate that rapid retreat particularly since 1945 has led to high erosion and sedimentation rates. They also provide an excellent diagram of the glacier from three time periods. The glacier extended to the Little Ice Age-Neoglacial moraine at the red arrow. Koppes et al (2009) indicate a retreat of  13 km from 1960 to 2005, 300 m/year.

marinelli ge
Marinelli Glacier in Google Earth

marinelli ela
Cross section of glacier from Fernandez et al (2011)
Melkonian et al (2013) note widespread thinning with a peak on Marinelli Glacier. They also note frontal velocities of 7.5 m/day to 10.5 m/day from 2000 to 2011. They note approximately a 4 km retreat during this period and an average accumulation area ratio (AAR) of 38 (Melkonian et al, 2013). A non-calving glacier needs an AAR over 50 and typically over 60, since calving is an additional loss, calving glaciers typically need an AAR above 70 (Pelto, 1987).

marinelli velocity
Change in thickness on Marinelli Glacier from Melkonian et al. (2013)

Here we examine Landsat imagery from 1998 to 2014. In 1998 Marinelli Glacier had a main calving tidewater terminus and a land based terminus, red arrow. The tidewater terminus extends beyond the land based terminus. The land based terminus is connected to a tributary at the pink arrow. A tributary from the east is connected to the main glacier at the purple arrow. The yellow arrow is the 2014 terminus position. By 2001 the tidewater terminus has retreated up fjord of the land terminating terminus. The tributary on the west is still connected with the land terminating section of the glacier. By 2008 the main terminus has retreated exposing a new island in the center of the calving front. The land terminating section is now separated from the main glacier and with no supply of new ice will melt away, orange arrow. The tributary from the west is separated from the land terminus now at the pink arrow. The east tributary sill has a connection at the purple arrow to the main glacier. By 2014 the island at the main terminus has expanded in size as the glacier has retreated. The east tributary at purple arrow is separated from the main glacier. The isolated stagnant former land based terminus section between the red and orange arrows continues to melt away. The tidewater terminus of the glacier has retreated about 3.75 km from 1998 to 2014.  This is a rate of less than 300 m/year the long term average. The glacier will not stop retreating until its AAR rises and the calving margin reaches a pinning point. In this case there is no lateral pinning point apparent, hence it will have to be a rise in the elevation of the base of the glacier. The velocity and thickness change profile indicate such a location may exist 3-4 km behind the current calving front.  This glacier is retreating faster than the other glaciers of this icefield and is more in line with glaciers in the Southern Patagonian Icefield such as, Onelli Glacier, Glaciar Steffen, Glaciar Chico and Jorge Montt Glacier.

marinelli 1998
Landsat image 1998

marinelli 2001
Landsat image 2001

marinelli 2008
Landsat image 2008

marinelli 2014
Landsat image 2014

Glaciers have the Wrong Business Model

This is the story of a glacier that recently went to a bank for a loan, the Sholes Glacier, North Cascade Range, Washington. … “A recent resolution of mine is to work to change my future. I first had to go to the trouble of getting registered as a business so the bank would even recognize my existence, simply having existing on a map was not sufficient. This despite the fact that the water I store and release each summer is valuable to many businesses. I was ushered into the loan office where my basic need was explained, I need to replenish my main asset snow and ice, otherwise the water resource service I provide to others will diminish. The documentation requested included the state of my overall sector.  The World Glacier Monitoring Service, collects data on glacier mass balance and terminus change from around the globe, showed that my sector had lost net assets for 25 consecutive years, see below.  This graph showed not only that global glacier mass balance has declined 25 years in a row, but that North Cascade glaciers have lost an equivalent amount of volume, the 2014 data is preliminary.

ba2014
Global Glacier Mass Balance

In fact auditors, glaciologists, have examined my asset sheet each of the last 25 years, and this data was not helpful. I then provided my own net asset sheet indicating a 25% asset loss in the last 20 years.  The increased stream of liability from me was eating the long term assets, that were literally no longer frozen. The bank officer, took a hard look and pointed out that, “banks loaned money with the expectation that there would be a return on their investment, improved assets of the loan recipient being crucial”. Given the recent history in the glacier sector I was told, “that our business model was wrong. We cannot expect after 25 consecutive years of loss that a positive asset trend is possible”.   I noted that the business model was hard to change and that is was the overall “business” climate that was wrong. This yielded a final rejection, “that maybe true, but until the business climate changes, you still have an unsustainable business model, and any loan would likely simply melt away, so to speak”.   So I ask for advice. What can I use for a business model? Will the business climate change in time for my business… How about the other businesses I supply too? I am afraid Kickstarter is not an option. Examine the other glaciers and their stories to see that my story is not unique.

sholes overvieew 2014

Sholes Glacier, North Cascades of Washington assets melting away.

sholes 2013 August melt

Snow melt from August 4th to Sept. 12th, 2013 on Sholes Glacier.

ba north america

Annual balance of glaciers in western North America all losing assets.

East Qorqup Glacier Terminus Disintegration, Greenland

Qorqup Glacier (Qooqqup) is in southern Greenland near Narsarsuaq. The glacier divides shortly above the terminus into an eastern and western glacier branch. Kuussuup Sermia is a distributary glacier of the Qorqup. Here we examine Landsat imagery from 1993 to 2014 and Google Earth imagery from 2005 and 2013. The eastern branch terminus is indicated by the red arrow.Qorqup galcier ge
A series of images from 1993 to 2008 indicate limited terminus change, the red arrow indicates the 1993 terminus position on each image. The main change was the minor retreat on the western side of the terminus between 1993 and 1997, where a 600 m wide and 600 m long area was lost. After 2010 the glacier retreated 750 m by 2014. However, in 2014 it is clear that the lower 3 km of the terminus is disintegrating. The disintegration is evident at the pink arrows, with both rifts and iceberg melange sections evident. The Google Earth imagery from 2005 and 2013 indicate a vast change in the character of this terminus reach. In 2005 the terminus is still at the same location, red arrow. The pink arrows indicate crevassing that indicates rapid glacier flow, there is no significant rifting or melange at that time. By 2013 the glacier has retreated from the red arrow at the 1993-2010 terminus position. More importantly each pink arrow indicates an substantial rift or ice melange. The glacier tongue is no longer in contact with the valley walls in its last two kilometers, three kilometers on the east side. There is also a large rift two kilometers from the ice front, indicating a location where the glacier will separate. This rift does penetrate to the water level. The retreat of this glacier is similar to that of Narssap Sermia and Qaleriq Glacier. The rifting leading to calving is what was observed on Petermann Glacier.
oorqup e sermia 1993
1993 Landsat image

oorqup e sermia 1997
1997 Landsat image

oorqup e sermia 2004
2004 Landsat image

oorqup e sermia 2010
2010 Landsat image

oorqup e sermia 2014
2014 Landsat image

oorqup e sermia 2005
2005 Google Earth image

oorqup e sermia 2013
2013 Google Earth image

Davidson Glacier Retreat, Alaska

Davidson Glacier is a large glacier that flows east from the Chilkat Range to the foreland along Chilkat Inlet and Lynn Canal in southeast Alaska. As a result it has a long history of observation of change. Molnia (2008) noted that from 1889 to 1946 the glacier retreated 400 m and a lake had developed at the terminus. By 1978 the glacier had retreated another 700 m with the proglacial lake at the terminus further expanding. Molnia (2008) futher observed a 700 m retreat by 2004. Here we examine Landsat imagery from 1993 to 2014 to identify recent changes of the glacier.

davidson map
USGS map

davidson ge
Google Earth Image

In 1984 the glacier terminated at the end of a peninsula extending from the south side of the proglacial lake, red arrow. The purple arrow is the snowline at 1100 m. The orange arrows indicate two tributaries feeding the main glacier. By 2001 the terminus has retreated 500 m into a narrower western section of the lake. In 2004 the snowline is at 1250 m, leaving little accumulation area. In 2009 the snowline is at 1200 m. The terminus has retreated from the proglacial lake. In 2013 the snowline is at 1100 m, there is a river connecting the terminus at the yellow arrow to the proglacial lake. The glacier no longer reaches the foreland having retreated into a mountain valley. In 2014 the snowline was at 1300 m at the start of August with a month left in the melt season. The two tributaries at the orange arrows only have a thin connection to the main glacier. The terminus has retreated 800 meters from 1984 to 2014. The retreat will continue due to the high snowlines in recent years and tributary separation. The retreat is less than most nearby glaciers such as Sinclair Glacier or Ferebee Glacier, just east across Lynn Canal.

Johnson et al (2013) compare changes in Davidson and Casement Glaciers that share a flow divide at 1200 m, Casement Glacier flows west and Davidson Glacier flows east. Both glaciers thinned at a rate of 1 m per year at the flow divide from 1995-2011. This is an indication of the high snowlines and negative glacier mass balance. Casement Glacier had a much greater thinning below 600m than Davidson Glacier, which leads to greater retreat. The difference is that Davidson Glacier has a steeper gradient from the terminus than most glaciers. davidson 1984
1984 Landsat image
davidson 2001
2001 Landsat image
davidson 2004
2004 Landsat image
daidson 2009
2009 Landsat image
davidson 2013
2013 Landsat image
davidson 2014
2014 Landsat image

Sinclair Glacier Retreat, Alaska

Sinclair Mountain is on the east side of the Lynn Canal in southeast Alaska. The mountains hosts too substantial glacier, the south flowing unnamed glacier is referred to here as Sinclair Glacier. This glacier terminated in a lake in the 1982 map of the Skagway region. I observed this glacier from the air in 1982 and it was ending in this lake. Here we examine Landsat imagery from 1984 to 2014 to identify changes. sinclair map
USGS Skagway map
Sinclair ge
Google Earth Image

In 1984 the glacier ended at a prominent peninsula in the lake, red arrow in each image, the lake was 1700 m long. The snowline was at 950 m, indicated by the purple arrow, this was at the end of the melt season. The glacier was joined by two tributaries from the west side, orange arrows. In 1986 there is a small amount of terminus retreat visible. By 2001 the glacier has retreated out of the lake, which is 2.9 km long. By 2004 the southern tributary at the orange arrow is no longer connected to the glacier. The glacier has retreated 1.3 km from 1984-2004. The snowline is at 950 m with a month left in the melt season. In 2009 the image is not great quality, but the northern tributary is still connected to the main glacier by a thin tongue of ice at an icefall at 850 m. By 2013 the northern tributary is no longer connected to the main glacier, there is bare rock extending across the full width of the former icefall area. In 2014 the image is from the end of July and the snowline is already above 950 m. It is evident that the glacier will lose nearly all of its snowcover by the end of the melt season on October 10th. The glacier has retreated 900 meters since 2004, and 2.2 km since 1984. The recent loss of tributaries indicates less contribution of ice to the glacier and that retreat will continue. This retreat is the same as that of nearby Field Glacier, Meade Glacier and Ferebee Glacier.
sinclair 1984

1984 Landsat image
sinclair 1986
1986 Landsat image
sinclair 2001
2001 Landsat image
sinclair 2004
2004 Landsat image
sinclair 2009
2009 Landsat image
sinclair 2013
2013 Landsat image
sinclair 2014
2014 Landsat image

Cloud Peak Glacier Retreat, Wyoming

Cloud Peak is the highest peak in the Bighorn range of north central Wyoming, a cirque on its east side hosts the only significant glacier in the range. This glacier was photographed in 1903 and has lost much of its volume since then. Rahn et al. (2006), page 44, estimated that if the melting continues at the rate that determined in 2005, Cloud Peak Glacier would disappear between the years 2020 and 2034. They used repeat photographs to estimate glacier volume as 506 million cubic feet in 1905, 205 million cubic feet in 1966 and 78 million cubic feet in 2005. The latter value is likely too low, as it implies a glacier thickness of just over 10 m on average, yet there is active crevassing, which typically requires 30 meters of thickness. A typical volume-area scaling law also yields a thickness of 30 m (Bahr, 2014).

Here we use Google Earth images from 1994, 2006 and 2010 to observe more recent changes. The red line is the outline of the glacier in 1994. In 1994 the glacier had a length of 580 m on average across the glacier front. The glacier had retreated 280 m from the Little Ice Age moraine crosscutting the lake. By 2006 the terminus has retreated 65 m. In 2010 the terminus has retreated an average of 105 m. Just as importantly the top of the glacier has receded 75 m, pink arrows indicate this area. The net results is that total glacier length has declined from 580 m to 380 m on average. The glacier has an area in 2010 of 0.20 square kilometers. Given retreat of the top and bottom of the glacier the glacier will not survive (Pelto, 2010). However, the glacier will not disappear in the next two decades unless the melt conditions increase substantially. This retreat is similar to the nearest glaciers to the north in the Beartooth Mountains of Montana and to the west in the Wind River Range of Wyoming.

cloud peak 1994
1994 Google Earth Image
cloud peak 2006
2006 Google Earth image
cloud peak 2010
2010 Google Earth image