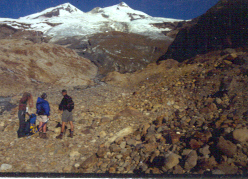
Camp above Coleman Glacier on Heliotrope Ridge, (Jill Pelto painting)
Mount Baker is the most glaciated peak and highest mountain in the North Cascade Range at 3286 m. The Nooksack Indian Tribe refers to this strato volcano as Komo Kulshan, the great white (smoking) watcher. Mount Baker has 12 significant glaciers that covered 42 km2 in 1984 and ranged in elevation from 1320 m to 3250 m. Kulshan watches over the Nooksack River Watershed, and its flanks are principal water sources for all three branches of this river and Baker River. In 1984 we began an annual monitoring program of glacier mass balance, terminus position and glacier area on these glaciers. Over the last 40 years we have visited these glaciers every summer observing their response to climate change.
In 1984/85 we visited 11 of the 12 glaciers mapping their terminus position. All but one had advanced between 1950 and 1975 emplacing an advance moraine. In the 1980’s as each glacier retreated from this moraine we used these prominent moraines as a benchmarks, as their ice cores have melted and erosion has occurred they have become less prominent. The distance from the typically well preserved, fresh moraines to the current glacier front has been measured in each case using a laser ranging device with an accuracy of +1m. In 2009 Mount Baker glacier had declined to 38.5 km² Pelto and Brown (2012). The Randolph Glacier Inventory reported a glacier area of 37 km² in 2015. In October 2022 an updated area was determined for Mount Baker glaciers at 33.5 km². This represents a decline of 20% in 38 years. Pelto and Brown (2012) identified a mean annual mass balance loss of -0.52 m/year from 1990-2010 on Mount Baker glaciers. From 2013-2021 the mass loss had more than doubled to -1.30 m/year. Below we review each glacier circling the mountain counter-clockwise
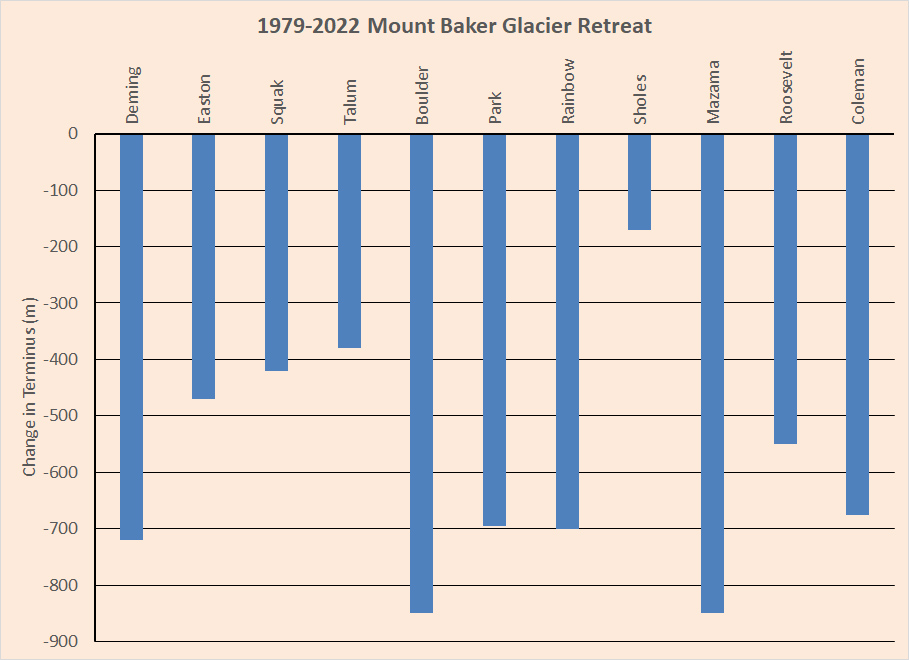
Measurement of glacier retreat from the advanced moraines ~1979 to 2022. We have measured terminus position of these glacier on 130 occassions from 1984-2022.
Easton Glacier from our survey camp in (2022) above and 2003 (below) illustrating 470 m retreat from 1990-2022.
Change at terminus from August 2022 to August 2023. Image from same location though different orientation area the size of a hockey rink lost all of its ice here.
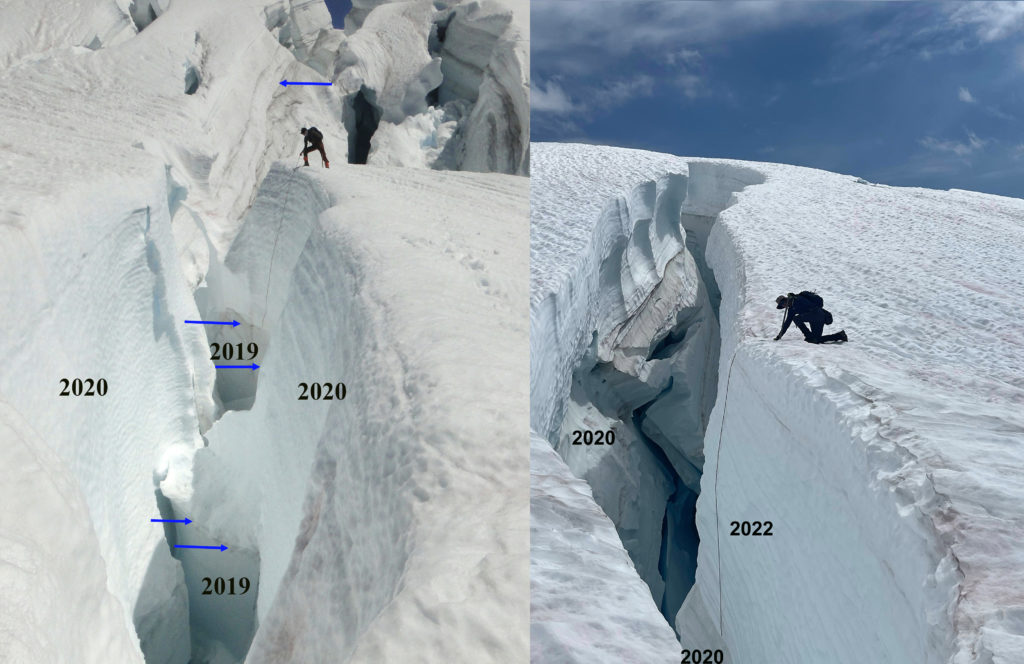
Crevasse measurement of annual snowpack at 2500 m on Easton Glacier comparison of 2019-2022.
Easton Glacier flows down the south side of the mountain and feeds the Baker Lake Hydropower project. We have monitored the mass balance and terminus change of this glacier every year from 1990-2022. This is a World Glacier Monitoring Service reference glacier. In recent years thinning has exposed a few bedrock knobs near 2200 m on the glacier. The glacier has lost 21 m w.e. since 1990 driving a 470 m retreat during this interval. The pace of loss and retreat has been faster since 2013. The typical snowpack retained at the end of the summer has declined from 2.6 to 1.2 m w.e. at 2300 m.
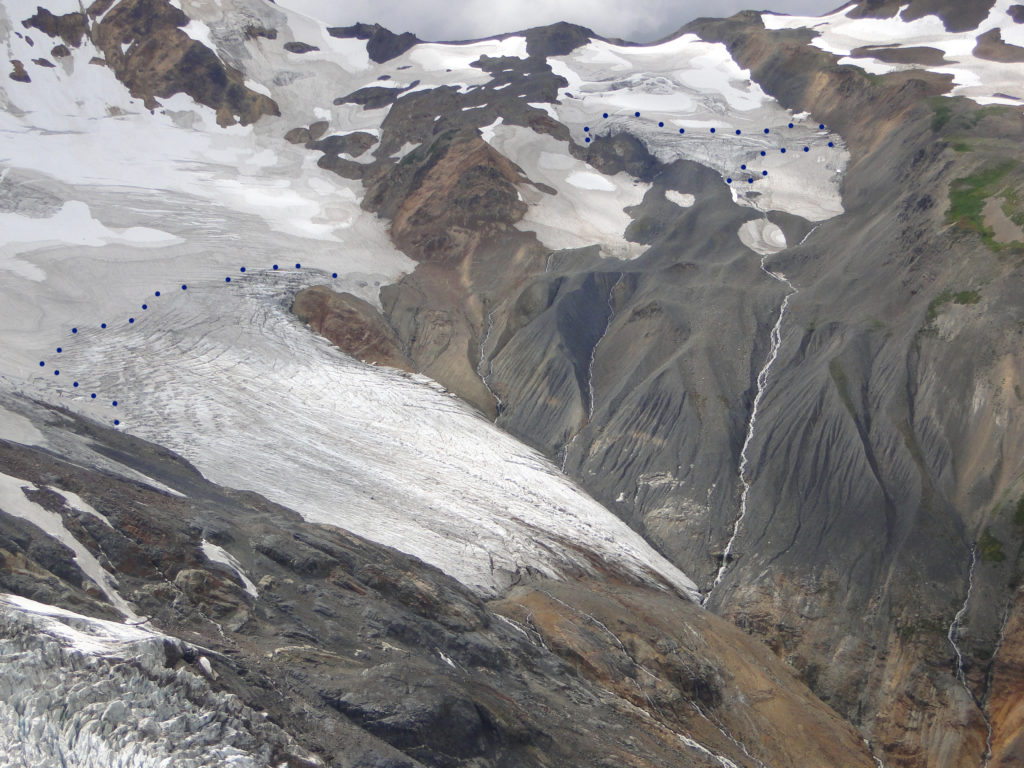
Deming Glacier icefall indicating velocity locations and change in terminus from 1979.
The Deming Glacier drains the southwest side of the summit of Mount Baker a stratovolcano in the North Cascades of Washington, with a massive icefall feeding the lower valley terminus reach of the glacier. The icefall begins at 2200 meters and descends to 1600 meters. The glacier feeds the Middle Fork Nooksack River which provides water supply to Bellingham, WA. Deming Glacier flows from the summit and is the headwaters of the Middle Fork Nooksack River. We observed the terminus of this glacier every year from a survey point and conduct snow depth measurements at 2200 m on the glacier. he NASA Measures ITS_LIVE application uses feature tracking to determine glacier velocity. An examination of velocity change from the top of the icefall to the bottom on Deming Glacier from 2015-2022 indicates deceleration at the three points within or below the icefall, but no change at the top of the icefall. At the top of the icefall red X velocity has declined ~20%. In the middle of the icefall, green X, velocity has also declined ~20% since 2017. Near the base of the icefall, orange X, velocity has a chaotic signal lacking a clear trend. Below the icefall at the blue X, velocity has declined by ~20-30%. The resulting reduction in flux to the terminus will continue the rapid retreat. Pelto and Brown (2012) measured a 360 m retreat of Deming Glacier from 1979-2009, ~20 m/year. From 1979-2021 the glacier has retreated 725 m, with the rate of retreat from 2009-2021 of ~30 m/year.
Coleman Glacier and Roosevelt Glacier terminus at their maximum size in 1979, photo from Austin Post. Each has receded above the first prominent icefall step indicated by extensive crevassing.
Coleman and Roosevelt Glacier in 2014
In 1984 Coleman Glacier had just completed its advance begun in 1948. The Roosevelt Glacier on left almost merged with it and Coleman stretched across the Glacier Creek in the valley bottom leaving a prominent moraine that we surveyed retreat from. The Coleman Glacier has retreated 200 m upslope from Glacier Creek by 1997. Retreat has accelerated with 675 m of retreat from the 1979 moraine to 2022. In 2019 we surveyed the same line across the glacier at 1800 m that we had examined in 1988 and found the glacier had thinned by 38 m in this area.
Coleman Glacier Terminus in 2022.
Roosevelt Glacier retreating to top of bedrock step in 2019.
Roosevelt Glacier is adjacent to Coleman Glaier on the northwest side of Mount Baker. It has followed the same pattern as the Coleman Glacier with less total retreat since 1979 of 550 m. The glacier in 2022 has retreated above a large bedrock step and has a thin profile that will encourage ongoing rapid retreat.
Mazama Glacier in 2015
Looking up Mazama Glacier from near the saddle with Rainbow Glacier at 2000 m.
Mazama Glacier flows from the summit down the north side of Mount Baker. The glacier terminates at the head of Wells Creek at 1470 meters. This is a glacier we visit briefly each summer since 1984, but is not a focus of detailed observations. The glacier had a low slope relatively stagnant tongue in 1988 that has led to a rapid retreat of 825 m by 2022. The glacier has a high snow algae region near the Dorr Steamfield.
Sholes Glacier terminus in 2015 with stream gaging location, we calibrated this stream discharge station for the Nooksack Indian Tribe.
Sholes Glacier terminus in 2022 with 1984 terminus location indicated.
Sholes Glacier is on a ridge extending northeast from Mount Baker. We have surveyed mass balance on this glacier each year since 1990. In 2012 in a joint project with the Nooksack Indian Tribe we began summer long monitoring of streamflow below this glacier that has identified the response of glacier melt to heat waves (Pelto et al 2022). The glacier has lost 24.6 m w.e. thickness since 1990 and retreated 170 m, most of that retreat since 2010. Our studies of streamflow indicate how during heat waves glaciers in this basin increase discharge by ~20% and limit water temperature increases (Pelto et al 2022).


Rainbow Glacier is a World Glacier Monitoring Service reference glacier that we have measured the mass balance of each year since 1984.The glacier begins at 2200 m at a saddle with Mazama and Park Glacier and drains the northeast flank of Mount Baker into the headwaters of Rainbow Ceeek and then Baker Lake. The glacier has lost 17.7 m w.e thickness which has driven a retreat of 700 m. The glacier was advancing during our first two years of observations. At the 2000 m saddle with Mazama Glacier the accumulation zone has persisted. The average retained snowpack has declined from 2.7 m to 1.5 m.
Park Glacier Cliffs in 2003
Park Glacier drains the northeast side of Mount Baker’s summit area, meltwater flowing into Baker Lake. Each year we work on the adjacent Rainbow Glacier and during the 1980’s and 1990’s the Park Glacier Cliffs provided a daily sequence of avalanches, the noise echoing across the valleys. By 2010 this occurrence was rare, as the cliffs receded and diminished in height. This accompanied the retreat of the main valley tongue that most of these avalanches had fallen onto. By 2022 the glacier has receded 690 m from the advance moraine of the 1970’s
Boulder Glacier in 1993 from just below its 1970s advance moraine.
Boulder Glacier from our camp in 2003 illustrating retreat
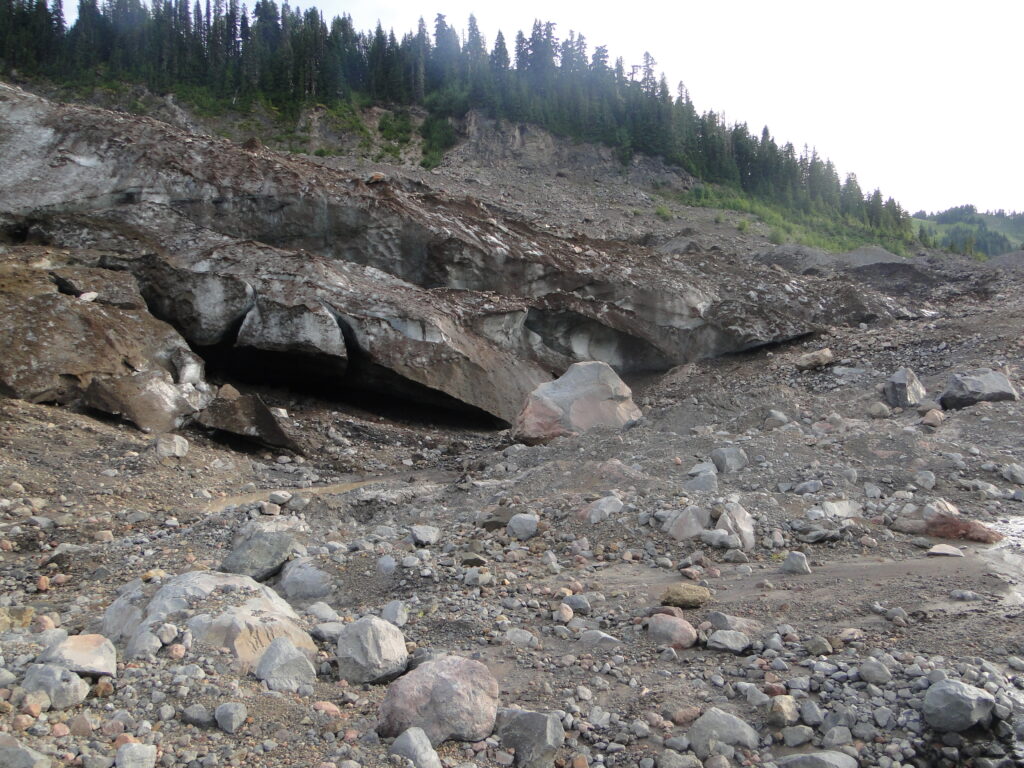
Debris covered terminus of Boulder Glacier, due to subglacial debris exiting onto glacier surface
Boulder Glacier drains the east side of Mount Baker into Boulder Creek and then Baker Lake. The glacier was advancing rapidly in the 1950s. Our second visit in 1988 revealed a significant retreat underway. The terminus area of the glacier is debris covered due to subglacial debris flows from the crater exiting onto the glacier surface. This glacier has retreated 850 m retreat from its advance moraine of the 1970’s.
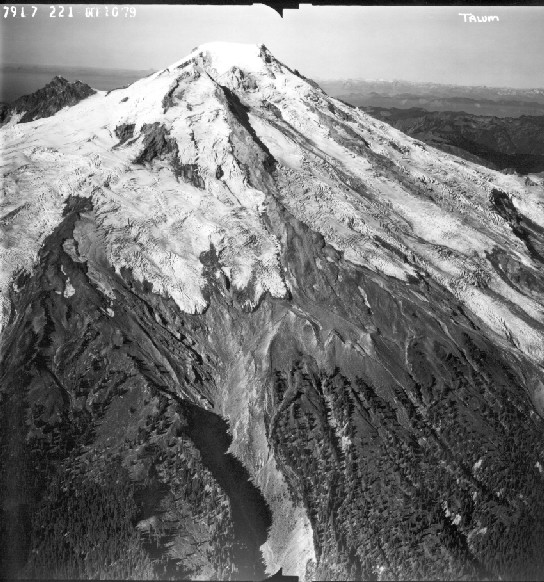
Talum Glacier in 1979 image from Austin Post
Talum Glacier has a wider bottom then top, as it is pinched between the Boulder and Squak Glacier on the east flank of Mount Baker. There are several terminus tongues, which tends to reduce the rate of retreat. Retreat from the advance moraines to 2022 has been 380 m.
Squak Glacier from survey camp in 1990
Squak Glacier from survey camp in 2009
Squak Glacier is adjacent to Easton Glacier on the southeast slope of Mount Baker. This glaciers retreat has been 420 m since 1984 when it was still in contact with its advance moraine. There are several bedrock areas emerging in what was the accumulation zone of the glacier, indicating a substantial expansion of the ablation zone. Thinning of the glacier from 1990-2009 is evident with expansion of ridge between Squak and Talum.
In 2023 we will again be on Mount Baker assessing the ongoing rapid response to climate warming generating glacier thinning and retreat.













Pingback: Mount Baker Glacier’s Perspective on Climate Change 1984-2022-Disastrous! – Top Globe News
I remember the snow on the Cascades when we lived in the Skagit Valley in 1968 through 1977. Visiting recently in July 2023, there was no snow on most of the Cascade Mountains – except for one – mountain that we could see from I-5 had a small smattering of snow – -like a chocolate cup cake with a little bit of white sugar on top. The rest were devoid of snow. Having worked with Geologists and many other scientists in Houston, I became concerned about our glaciers. The loss of ice that creates water for rivers and creeks, etc. concerned me. My concern grows daily because of the growth that is taking place in our state – especially the NW area from Tacoma and on northward. Too many people and wonder if we will not have enough water for all this – yet no preparedness effort to preserve water sources is taking place.
Pingback: Washington's Volcanoes Are Experiencing Seismic Tremors from an Unlikely Source: Glaciers - GlacierHub
Pingback: Washington's Volcanoes Are Experiencing Seismic Tremors from an Unlikely Supply: Glaciers - The Owl Report