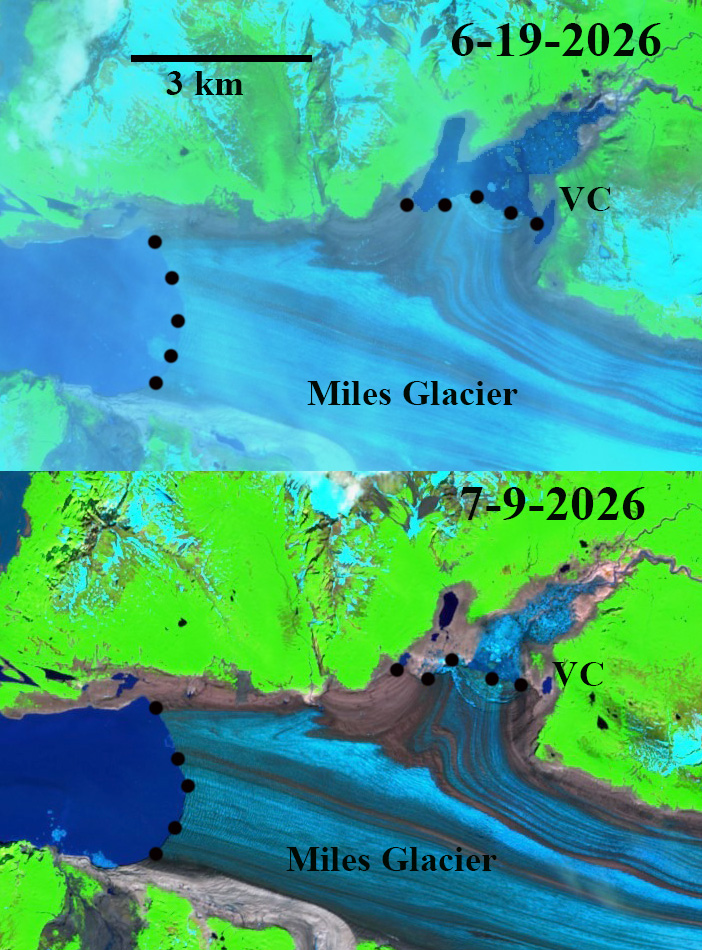
Miles Glacier and Van Cleve glacier lake (VC) near its maximum size on June 19th and after drainage on July 9th in Sentinel images. Glacier margin black dots.
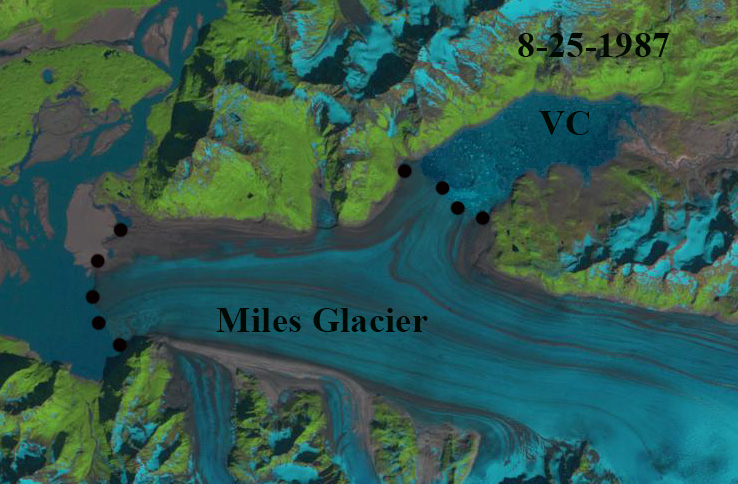
Miles Glacier terminates in an embayment on the east side of the Copper River, Alaska. A secondary terminus on the north side of the main glacier has long impounded a glacial lake that periodically drains. As miles has retreated over the last 40 years the maximum size of the glacial dammed lake has diminished, prior to its drainage. In 1987 the glacier extended onto an outwash plain directly adjacent to the Copper River, the lake reached a maximum size of 12 km2 . From 2016 to 2019 the lake drained each summer reaching a maximum average size of 5.5 km2 (Rick et al 2023). This was noted as a shrinking ice dammed lake by Field et al (2021).
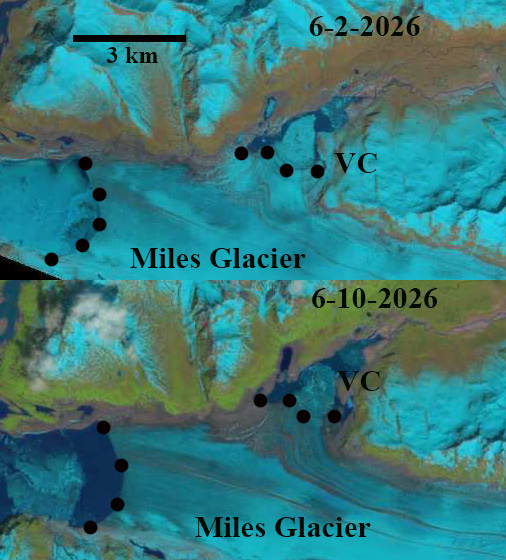
Miles Glacier and Van Cleve glacial lake filling in June 2026 in Landsat images.Glacier margin black dots.
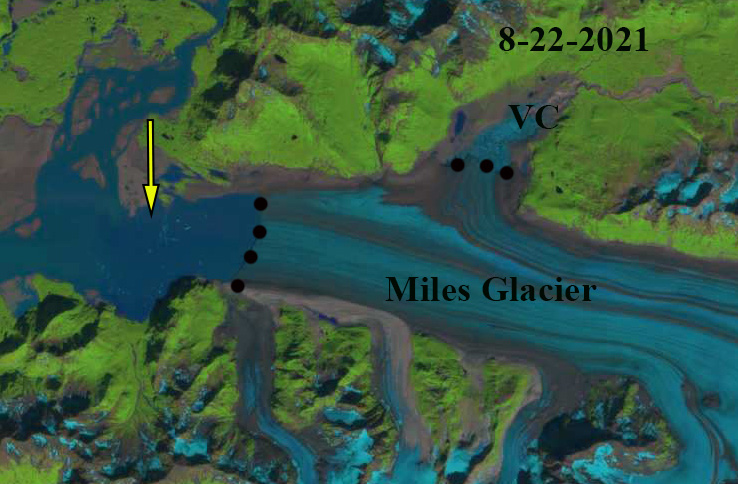
By 2021 the glacier had retreated 3.5 km since 1987. From 2021-2026 the lake reaches a maximum size of 3.5 to 4.0 km2 before draining. On June 2, 2026 the lake still has some winter lake ice and is filling. By June 10th the lake had reached 3 km2 and by June 19th it had reached 4 km2. The lake had began draining before June 25th. By July 9th it was fully drained. The Miles Glacier terminus has retreated 4.5 km since 1987. This ongoing retreat will continue to diminish the size of the lake. Ths lake does not have the complex drainage system or changing drainage location that Berg Lake has with retreat of Stellar Glacier..
Miles Glacier and Van Cleve glacial lake in 1987 Landsat image. Black dots indicate glacier margin. Miles Glacier and Van Cleve glacial lake in 2021 Landsat image. Black dots indicate glacier margin and yellow arrow indicates 1987 margin.
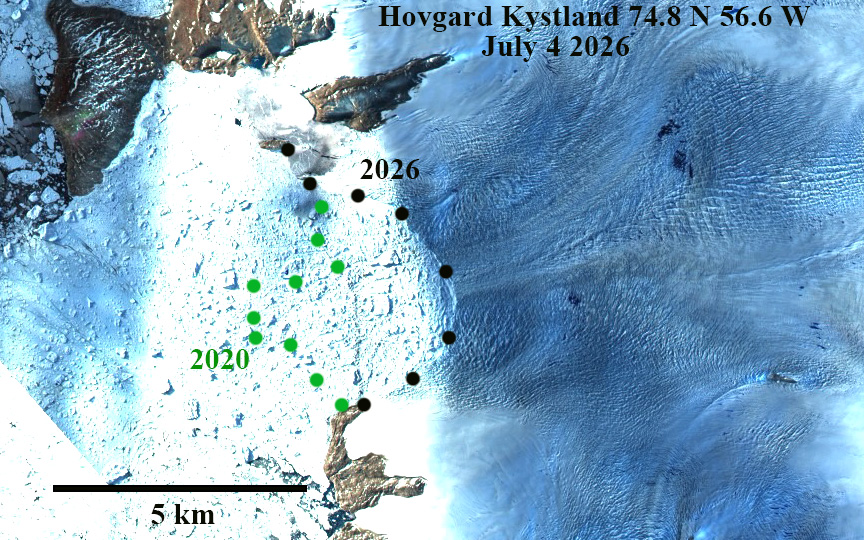
Hovgard Kystland Glacier in Sentinel image from July 4, 2026 with margin indicated by black dots. The 2020 margin seen below is indicated by green dots.
Hovgard Kystland Glacier is an outlet glacier in West Greenland between Alison and Hayes Glacier. Alison Glacier had the highest retreat rate from 1976-2021 losing 14.3 km in length and 59.4 km2 in terminus area (Black and Joughin, 2026). Hayes Glacier lost 2.7 km in length and 10.8 km2 in area (Black and Joughin, 2026).. They indicate that Hovgard Kystland Glacier retreated 5.4 km and lost 21.3 km2 during this interval.
Here we examine the acceleration of retreat from 2020 to 2026. In 2020 the central tongue of the glacier extended west beyond the main front. This central tongue collapsed by July 2024 leaving a generally north/south calving front, the glacier had lost 5.7 km2 of terminus area. From July 2024 to July 2026 an embayment formed generating a concave calving front. The glacier terminus lost another 4.8 km of area. Retreat of the calving front was 2.5 km during the 2021-2026 period. The glacier has lost an area that is 50% of the area lost from 1976-2021, in the last five years. The embayment is poised to further expand, though this summer an extensive packed melange is currently in place which typically limits calving (Meng et al. 2025).
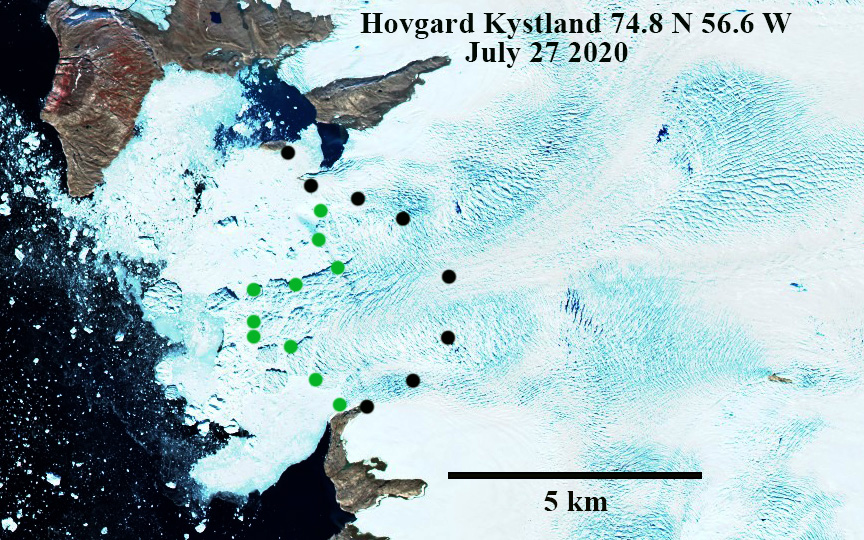
Hovgard Kystland Glacier in Sentinel image from July 27, 2020. The 2020 margin seen below is indicated by green dots and the 2026 margin with black dots.Hovgard Kystland Glacier in July 4, 2024 Sentinel image. The calving front indicated by red dots for 2024 and black dots for 2026.
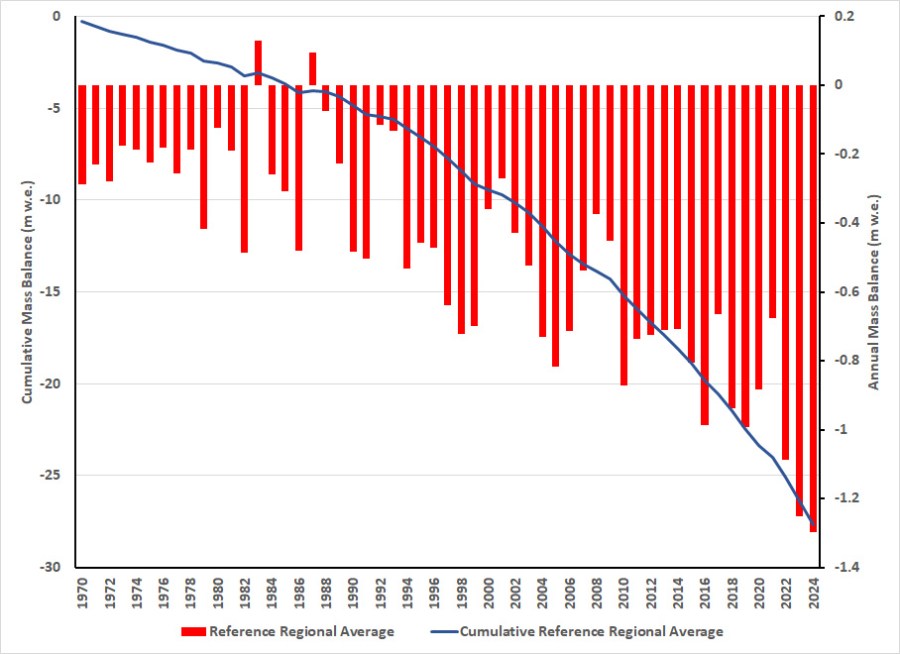
Global alpine mass balance in 2024 as reported to the World Glacier Monitoring Service. Solid line is the cumulative balance, bars are the annual balance.
Each of the last 15 years I have summarized the annual mass balance of alpine glaciers globally for the Bulletin American Meterological Society-State of the Climate report,. Below is the 2024 section on alpine glaciers with a few added figures.
ALPINE GLACIERS
M. Pelto
In 2024, all 58 global reference glaciers reported a negative annual mass balance. This is only the second year in the 1970–2024 period with all negative annual balances, following 2023. The global average annual mass balance based on equal weighting of 19 regions is −1.30 m water equivalent (w.e.), the most negative value in the record
The 2024 dataset of submitted glaciological observations includes 142 glaciers from six continents and 27 nations, with 140 reporting a negative balance and 2 a positive balance. In 2024, the mean annual mass balance of the 58 global reference glaciers was −1.44 m w.e. and −1.36 m w.e. for all 142 reporting glaciers. This is a similar result to 2023, which saw a mean reference glacier balance of −1.62 m w.e. and −1.35 m w.e. for all 116 reporting glaciers.
The 2024 regionalized global average of −1.30 m w.e. exceeds the previous most negative year in 2023, which saw a regional-ized global average of −1.25 m w.e. This makes 2024 the 37th consecutive year with a global alpine mass balance loss and the 15th con-secutive year with a regionalized global mass balance below −0.5 m w.e. The acceleration of mass balance loss indicates that alpine glaciers are not approaching equilibrium. The acceleration of mass balance loss is apparent regardless of datasets used to determine it, including glaciological, geodetic, altimetry, and gravimetric observations (The GlaMBIE Team 2025). The intercomparison assessment identified that global glaciers annually lost 273+26 gigatons (Gt) in mass from 2000 to 2023, with loss having been 36% greater in the second half than in the first half of this period (The GlaMBIE Team 2025).
In the European Alps, all 49 glaciers reported negative mass balances, with 45 losing over 1 m w.e. All 10 Icelandic glaciers had negative balances. In Svalbard, all seven had negative balances exceeding an exceptional loss of 1.25 m w.e. This was the result of near complete snow cover loss across most glaciers (Fig. 2.20) following record temperatures in August (see section 7f5 for details). Twelve of the 13 glaciers from Norway and Sweden had mass losses of more than 1.0 m w.e.
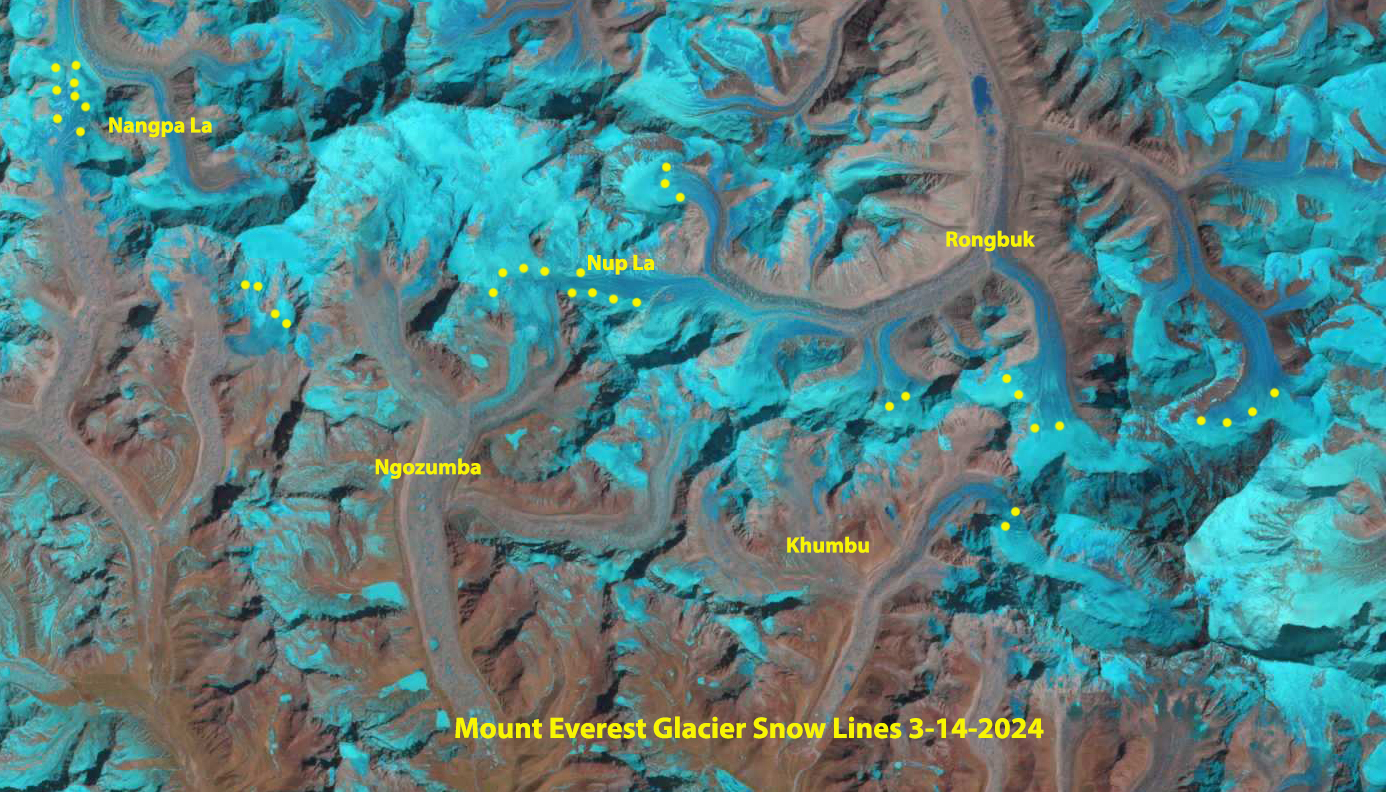
High snow line persisted through the winter on Mount Everest glaciers.
Across High Mountain Asia, 20 of 21 glaciers, reporting from seven nations, had negative balances. The highest average losses were in the Himalayas of Nepal and the lowest in the Pamir Range of Tajikistan.
In the Andes Mountains of South America, all 14 glaciers, reporting from five nations, had negative balances. Conejeras Glacier (Colombia), following a 5.04 m w.e. loss in 2023, was declared extinct in 2024. The daily hydrograph below this glacier changed from a predominanceof days with a purely melt-driven hydrograph from 2006 to 2016 to an increase in the frequency of days with flows less influenced by melt after 2016 (Morán-Tejeda et al. 2018).
All 16 glaciers in North America had negative balances. All four glaciers in Arctic Canada had mass balance losses under 1 m w.e. In western Canada and Washington and Montana (United States), all 16 glaciers reporting had losses exceeding 1 m w.e. The Ice Worm Glacier (Washington) was listed as extinct in 2023 after 40 years of continuous observations (Pelto 2024). In 2024, loss from the relict ice (ice that is no longer moving or part of a glacier) was 2.4 m and melt runoff below the glacier had decreased similar to Conejeras Glacier (Pelto and Pelto 2025). In Alaska, all three glaciers had mass balance losses. Davies et al. (2024) examined the Juneau Icefield, the most observed icefield in Alaska in terms of mass balance, and found an acceleration of mass loss with a doubling after 2010 compared to 1979–2010.
Easton Glacier, Washington extensive retreat since 1990, with last five years being the most rapid. Terminus and mass balance surveyed annually and reported to WGMS.
Alpine annual mass balance glaciological observations are reported to the World Glacier Monitoring Service (WGMS) by national representatives with a 1 December annual submission deadline. WGMS reference glaciers have at least 30 continuous years of mass balance observa-tion. Benchmark glaciers have at least a 10-year mass balance record and are in regions that lack sufficient reference glaciers. The combination of benchmark and reference glaciers is used to generate regional averages (WGMS 2023). Global values are calculated using a single averaged value for each of 19 mountain regions, limiting bias from observed regions (WGMS 2023). As this dataset expands, the annual values are reanalyzed and updated.
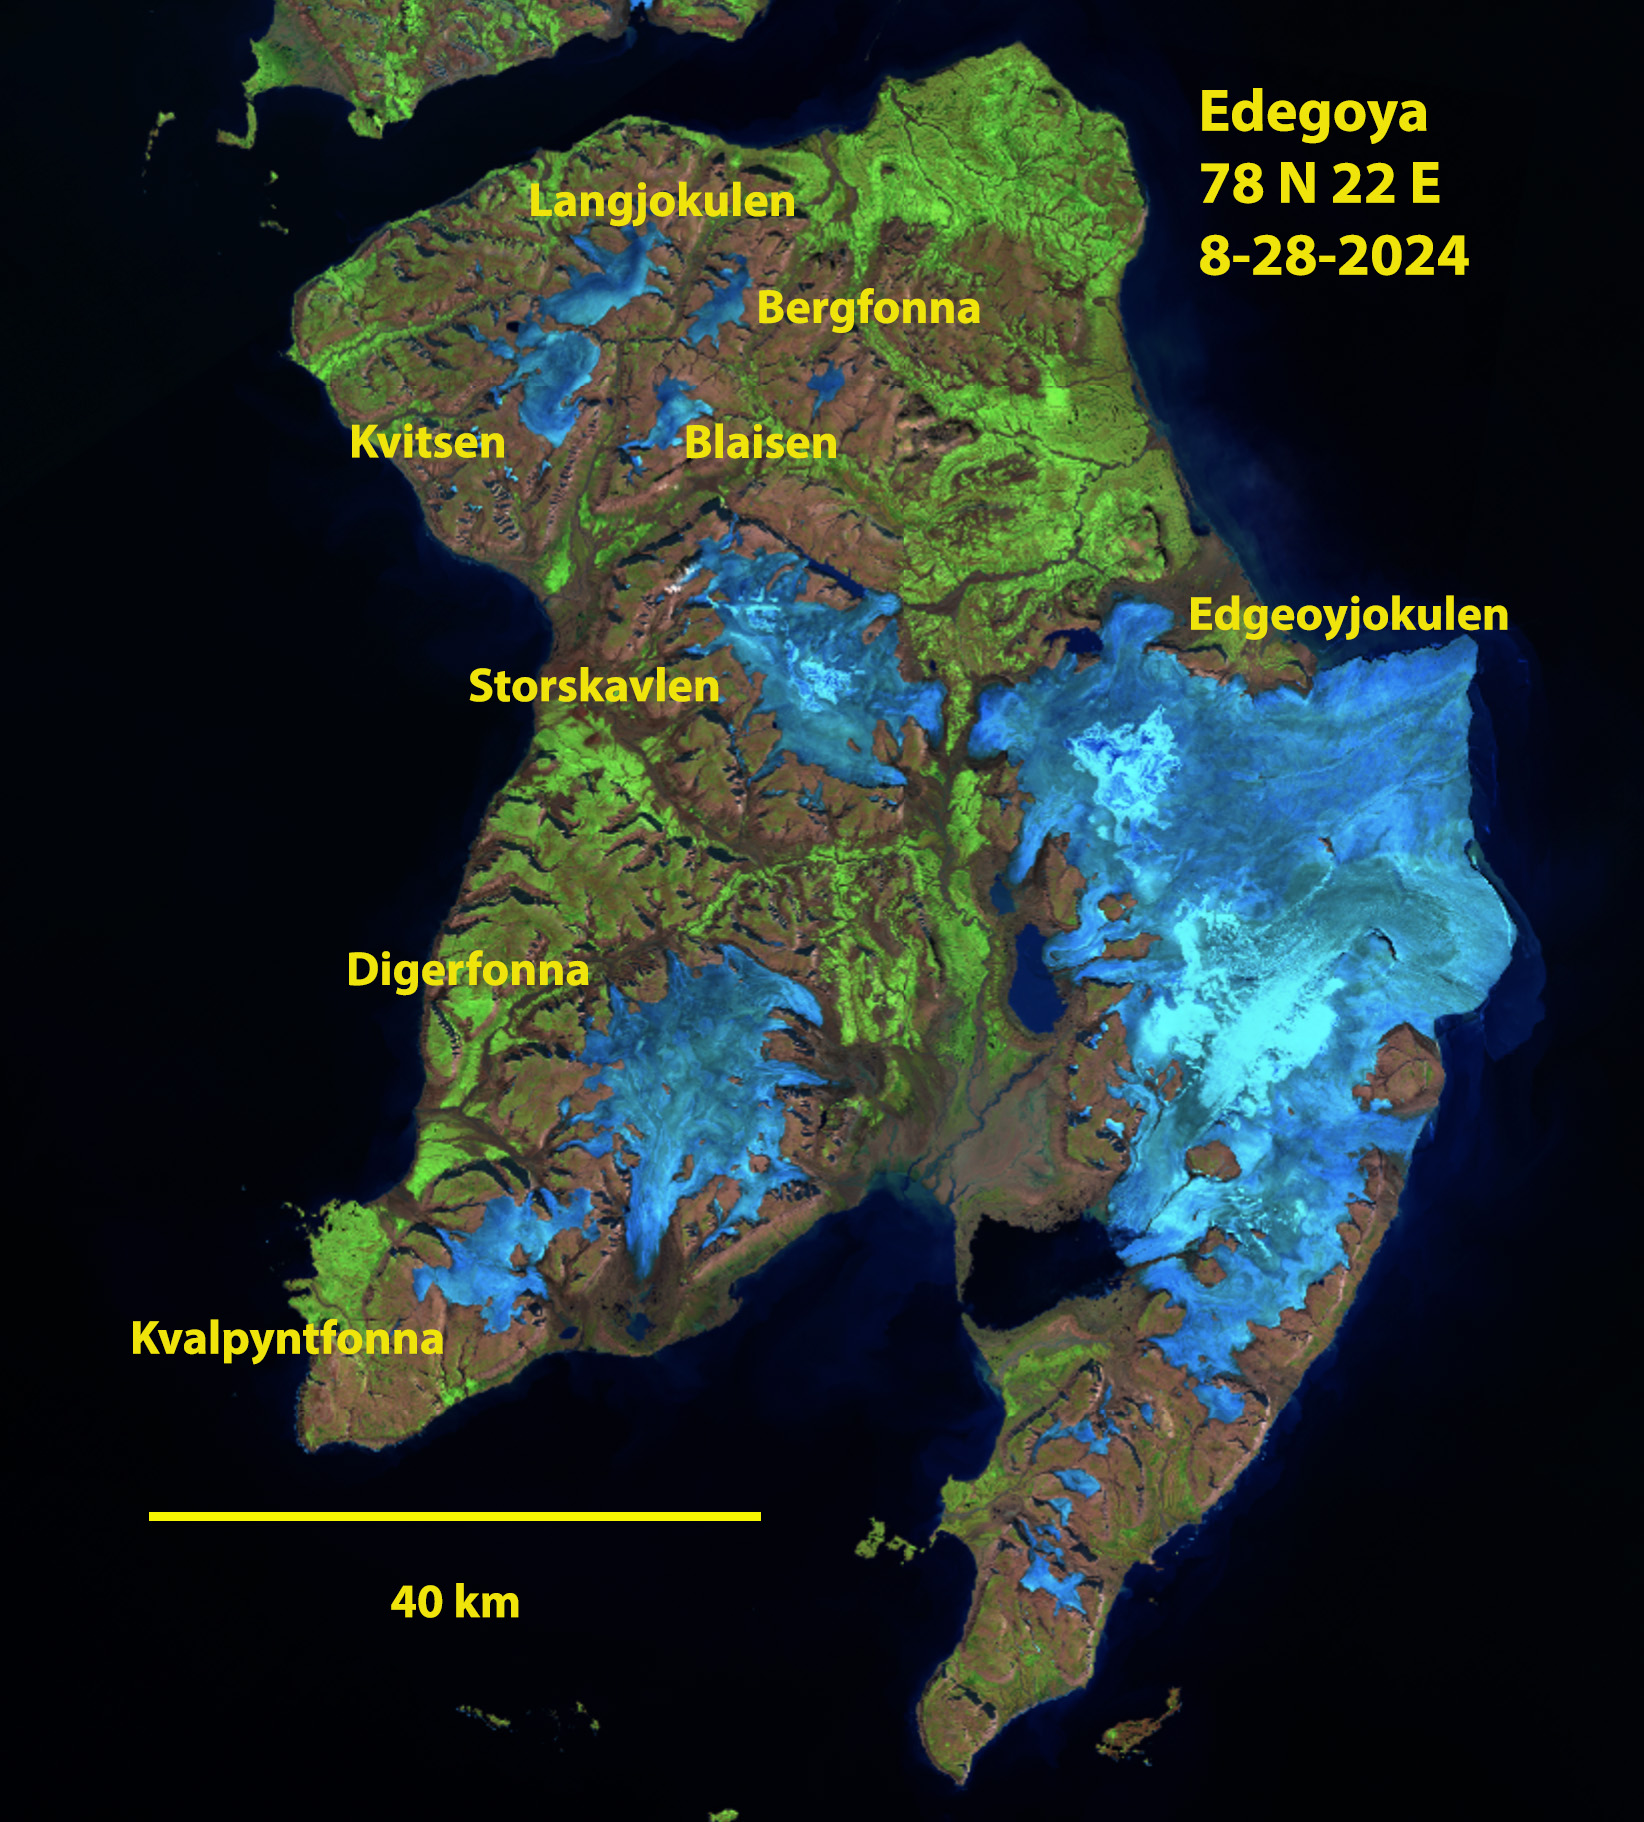
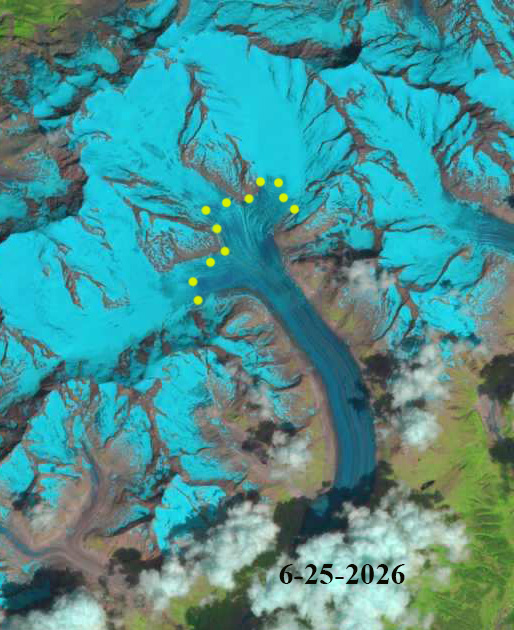
The lack of snow pack at the end of summer is evident across Edgeoya in Svalbard, blow a closeup of Digerfonna further illustrates with lettered points indicating new bedrock areas that are expanding amidst the ice cap.
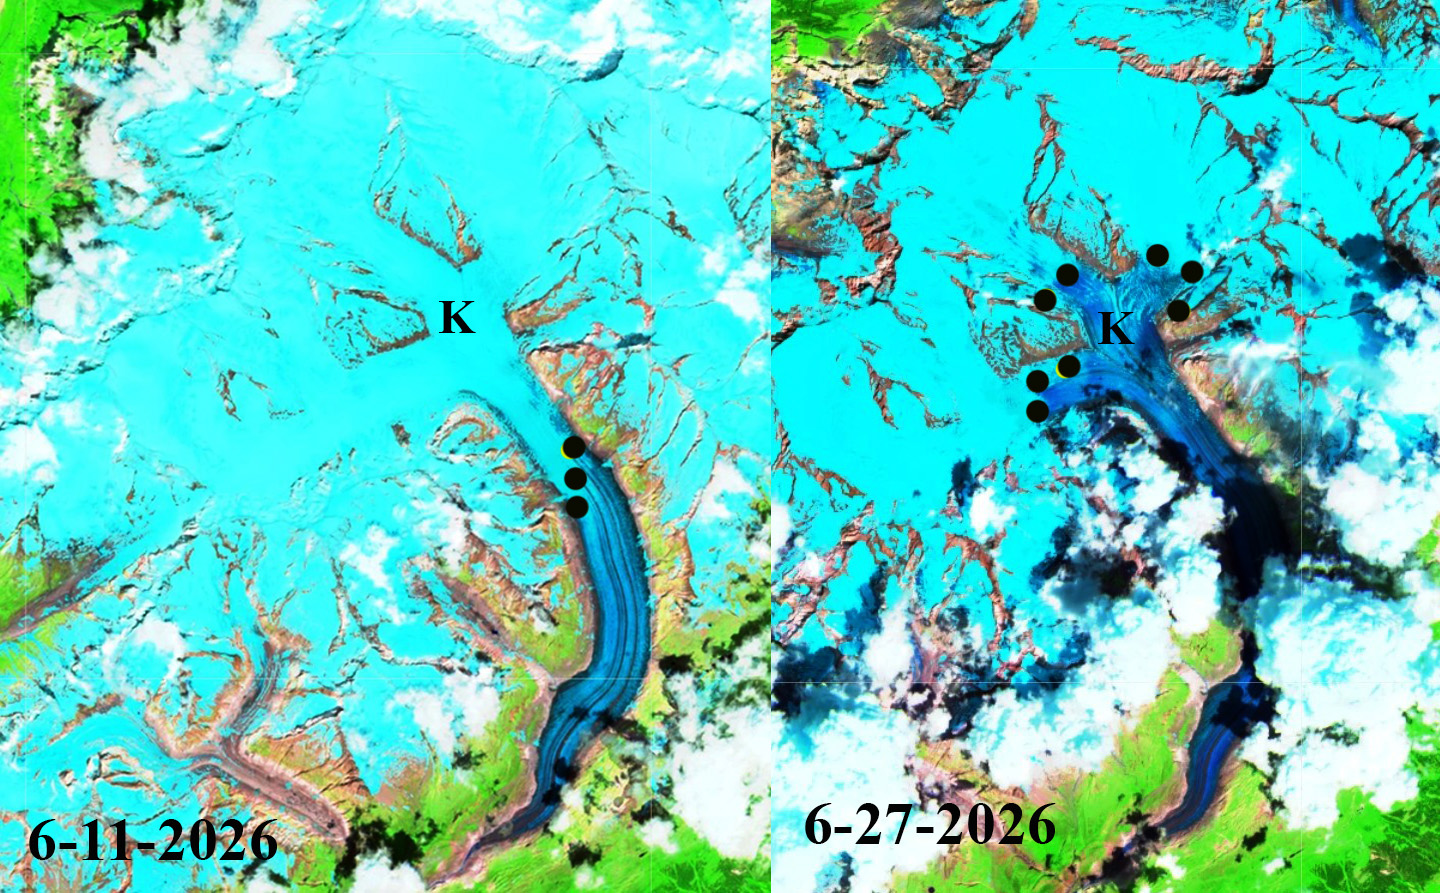
Snow line in Sentinel images from June 2026 at 2450 m on June 11 and at 2850 m on June 27th.
In June of 2025 heat waves combined with limited winter snowpack set the stage for significant glacier loss, 3% of the volume of Swiss Glacier. This followed on the exceptional losses in 2022 and 2023.
This same story in playing out through June of 2026, which will lead to this being the fourth year in the last five with exceptional glacier mass balance loss. On Grosser Aletsch Glacier on June 11th the snow line on the glacier was at 2450 m. By June 24th it had risen to 2800 m and by June 25th/27th 2850-2900 m. This is similar to the rapid rise of 400 m observed on Argentiere Glacier, France.
Grosser Aletsch Glacier snow line on June 25, 2026 averages 2850 m in this Landsat image.
The snow line rose to a record high 3200 m in 2022, and reached in 3100 m in 2025. Will 2026 set a new record? The snow line is not as high as the same date in 2022, though within ~25 m, but higher than late June 2025.
Above the late June snow line on Grosser Aletsch Glacier in 2022 and 2025 in Sentinel images. These two years had extensive June heat waves after winters with low snowpack. At the end of summer the snow line had risen to 3200 m in 2022 and 3100 m in 2025.
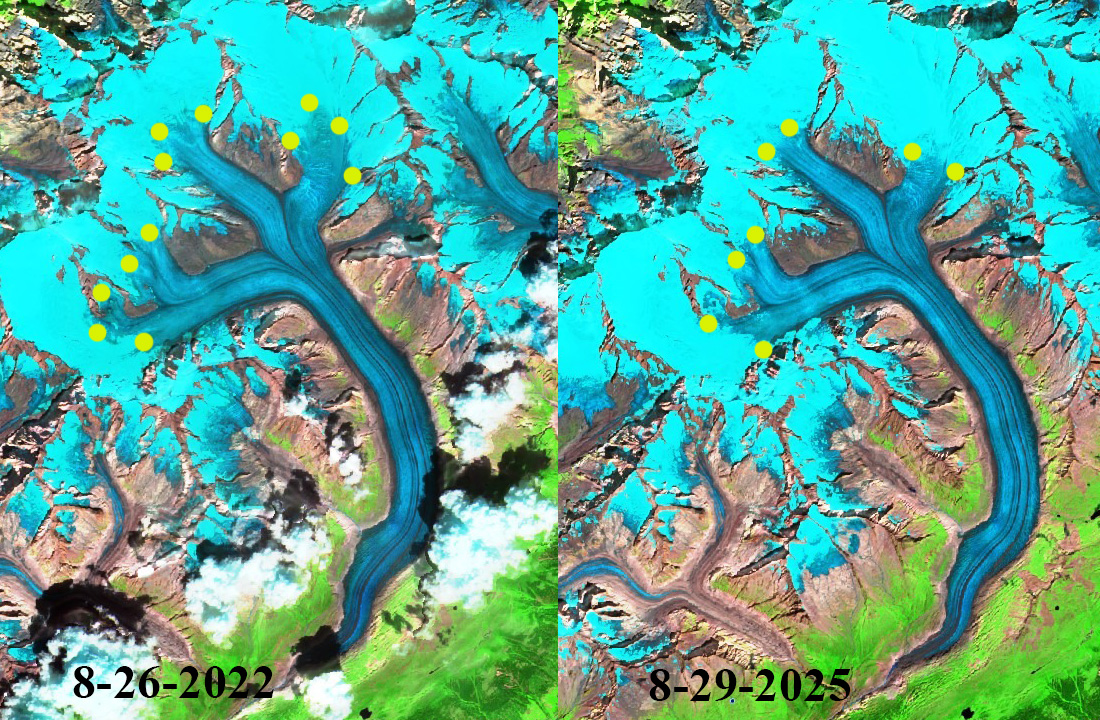
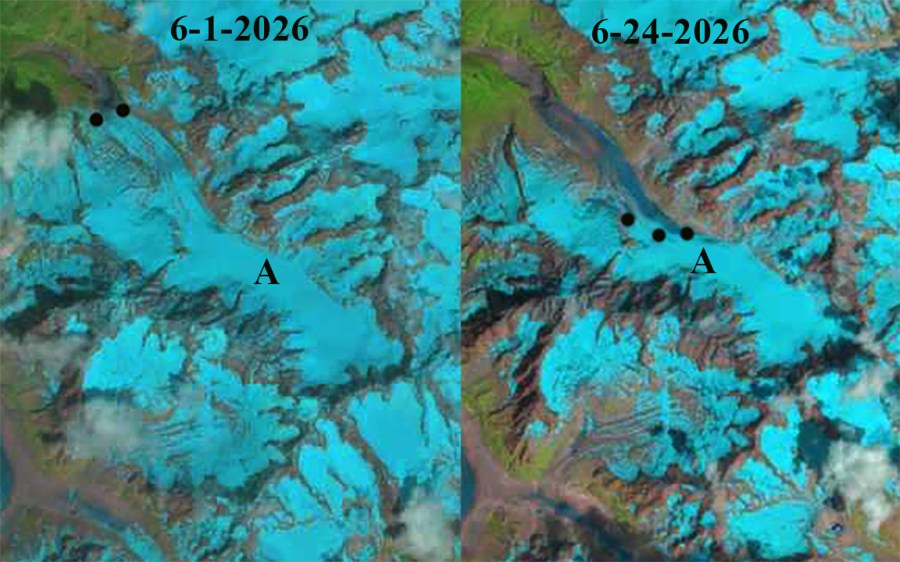
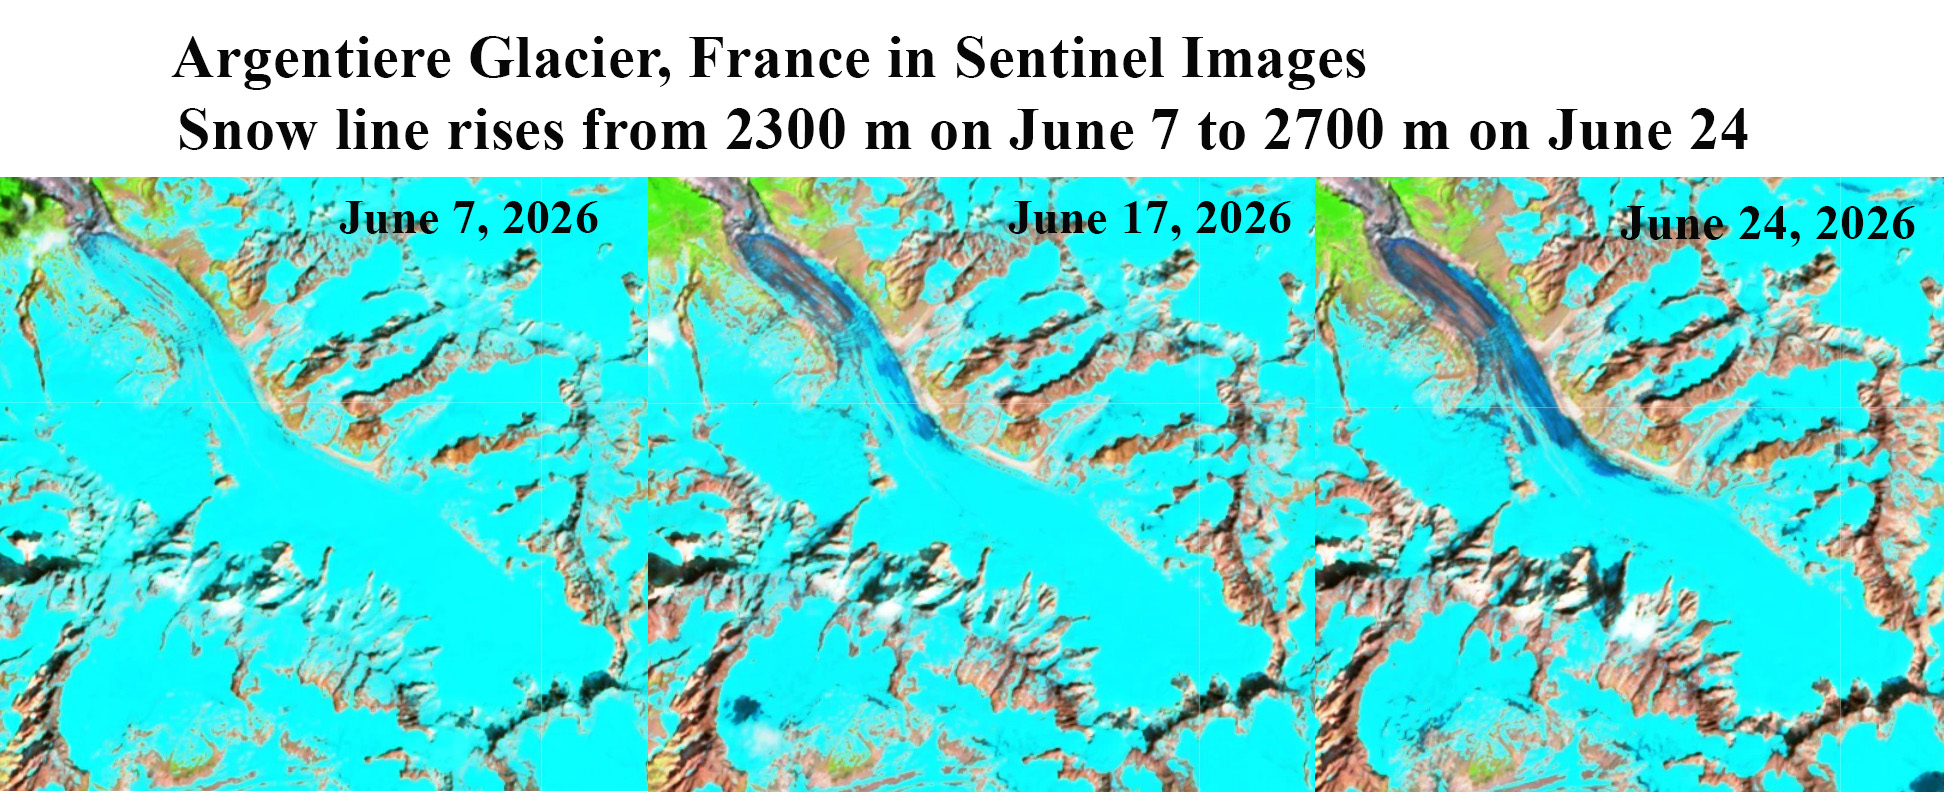
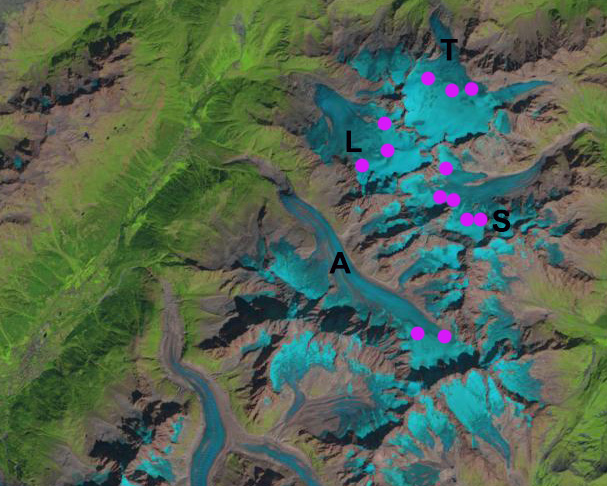
On June 1, 2026 the snowline is near the terminus of Argentiere Glacier at 2300 m, by June 24, 2026 the snowline has rise upglacier 3.3 km to 2700 m.
The French Alps have expereienced a significant June heat wave that has driven a rapid rise in glacier snow lines. Rabatel et al (2013) examined the equilibrium line altitude (ELA) of glaciers in the region from 1984-2010. The ELA is the snowline at the end of the summer melt season. Rabatel et al (2013) found the average snow line of 3000 m on Trient Glacier, 2900 m on Tour Glacier, and 2800 m on Argentiere Glacier.
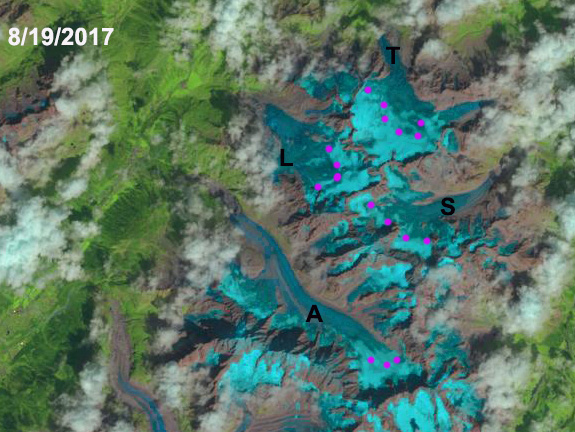
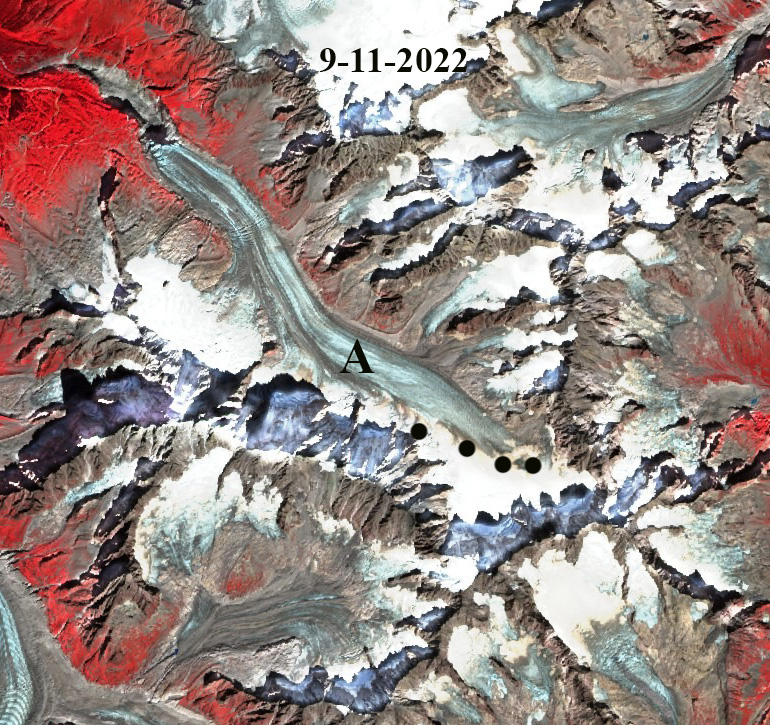
On June 1st and 7th 2026 the snow line on Argentiere Glacier was near the terminus at 2300 m, by June 24th the snow line risen to 2700 m. This is 100 m shy of the average end of summer snow line, with 25% of the glacier losing its snowcover in this period. In 2015 and 2017 the snowline reached a record height of 2950 m in late August. This snow line rose to 3000 m again in August of 2022 and to 2900 m in August 2023. The snow lines from these years are in images below
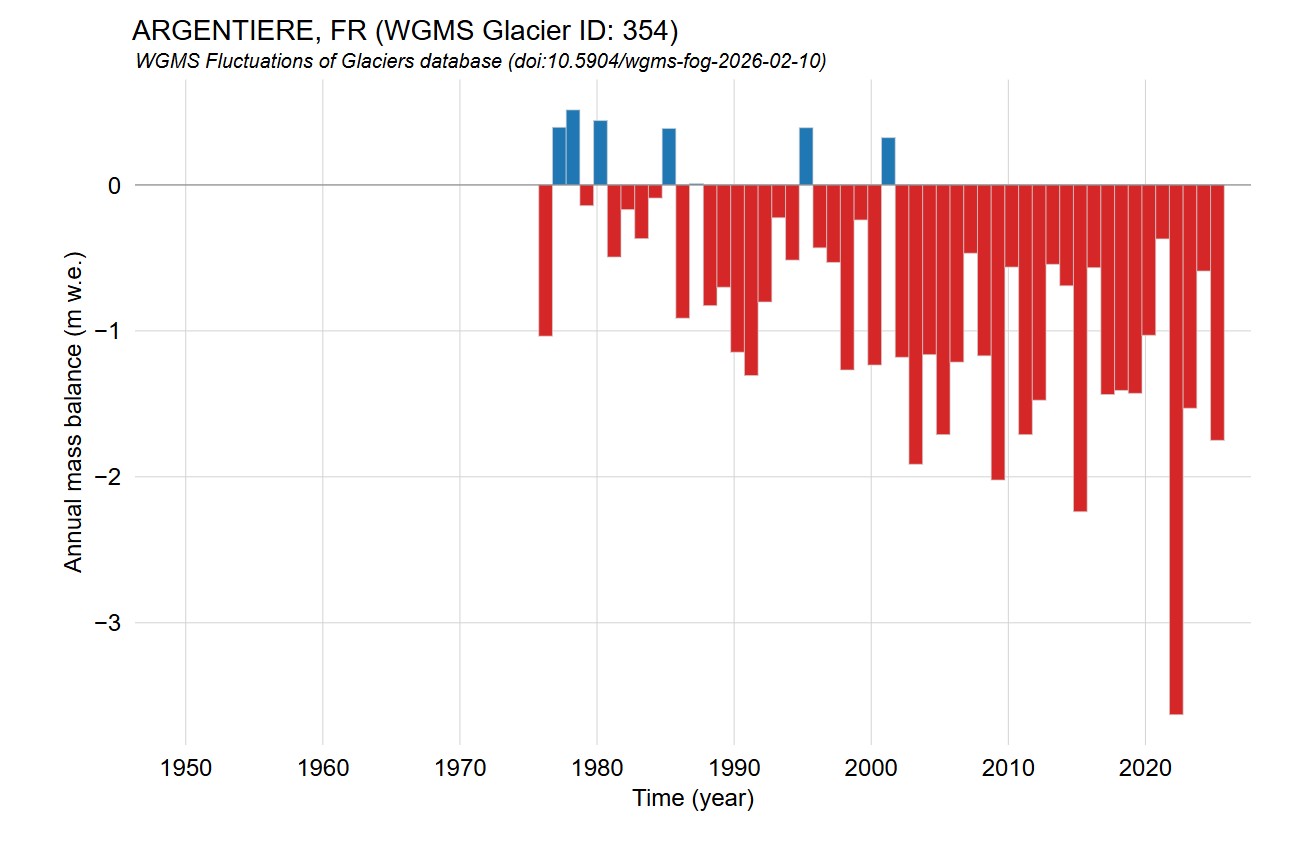
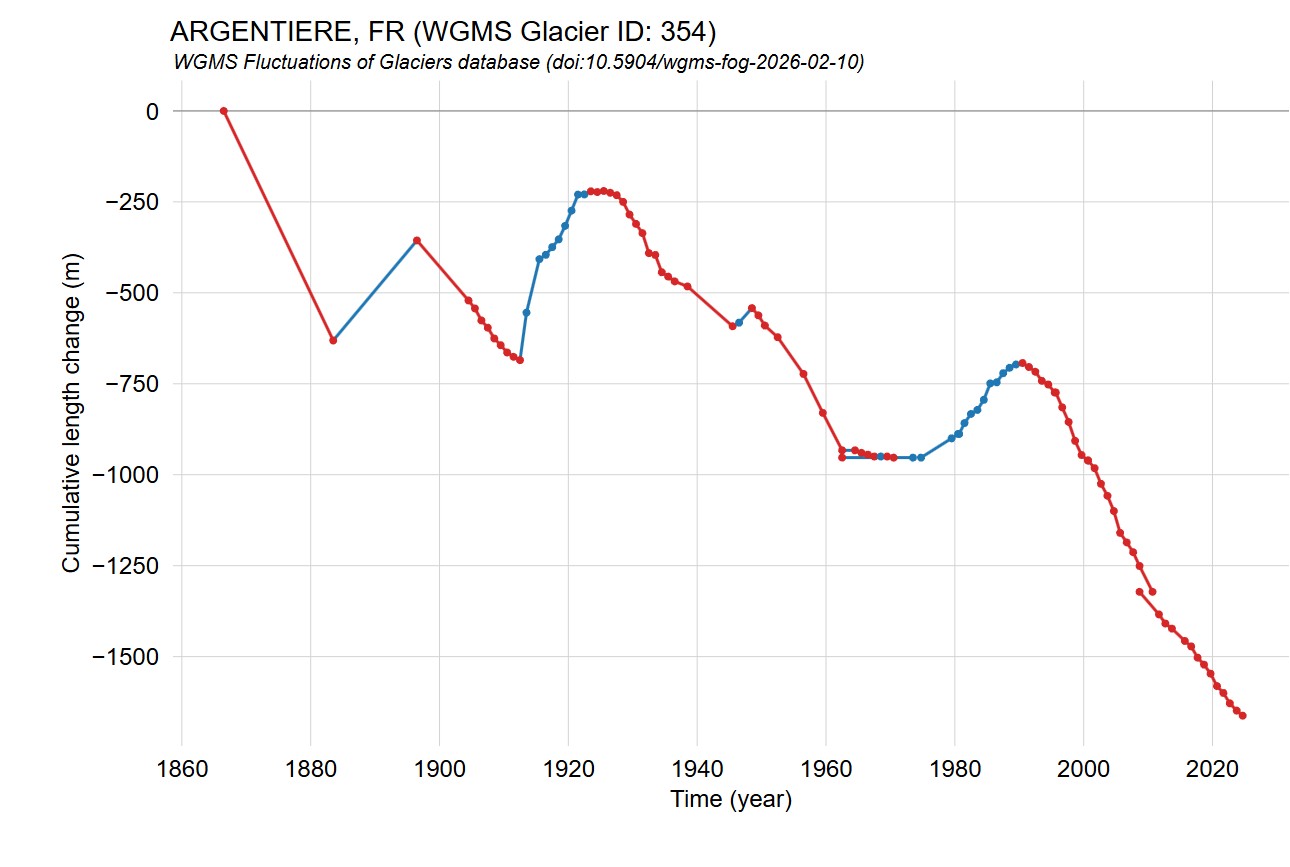
The high snow lines result in a limited accumulation zone and an expanded ablation area leading to mass balance losses and terminus retreat. Argentiere Glacier is a World Glacier Monitoring Service reference glacier, with the data indicated in the images below. The glacier advanced from the early 1960s to early 1990s and since driven by negative mass balances in all but one year this century has retreated ~ 1 km. The mass balance loss has exceeded 1 m in most years this century and will again this year.
Annual mass balance reported to WGMS for Argentiere Glacier.Terminus change reported to WGMS for Argentiere Glacier.Argentiere Glacier snow line at end of 2015 melt season at 2950 m in Landsat image.Argentiere Glacier snow line at end of 2017 melt season at 2950 m in Landsat image.Argentiere Glacier snow line at end of 2022 melt season at 3000 m in Sentinel image.Argentiere Glacier snow line at end of 2023 melt season at 2900 m in Sentinel image.
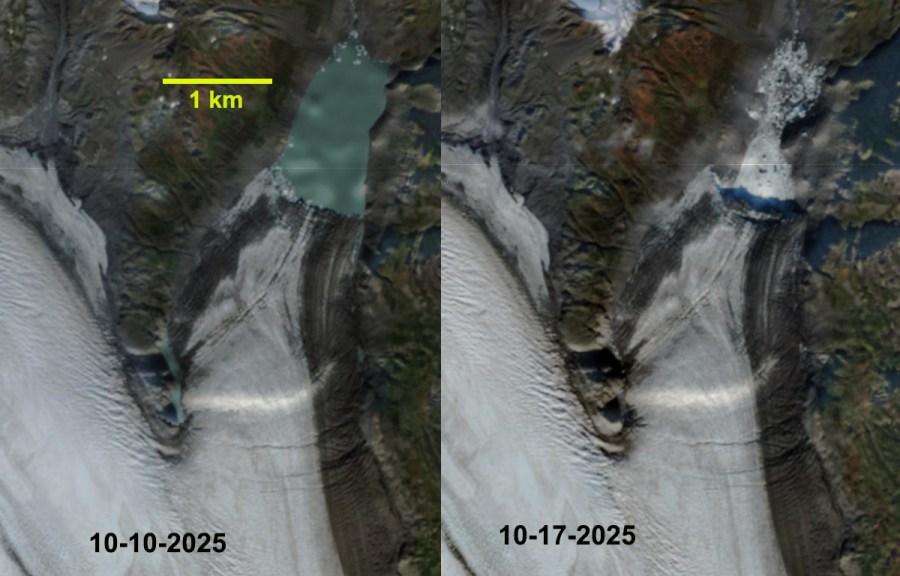
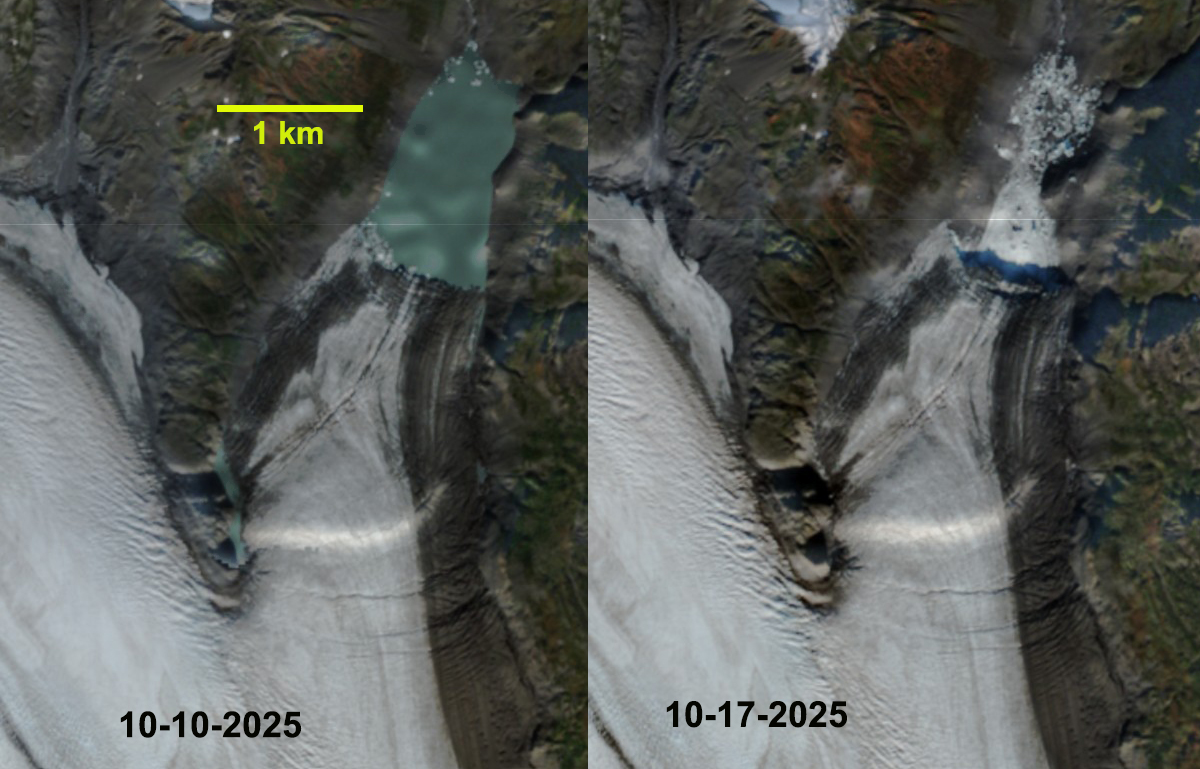
Bear Glacier ice dammed lake filled on Oct. 10th and drained on Oct. 17th, 2025. The Sentinel images also illustrated rifts.
Bear Glacier, Alaska on the Kenai Peninsual due to retreat developed an ice dammed proglacial that periodically drains. An August drainage in 2014 and 2018 were noted by Kurtz and Wolken (2019). Recent increases in kayaking and standup paddle boarding has led to this lakes drainage posing a recreational hazard. In 2024 the lake drained between 8/14 and 9/7. It then had filled by July and remained filled into October. On October 10th the lake had an area of 0.85 km2. On October 17th, the lake had drained to an area less than 0.18 km2. Their are a series of rifts extending across the glacier that represents flexure of the ice due to water level/flotation changes of this ice tongue. The ice is lifted when the lake is full and then is let down during drainage.
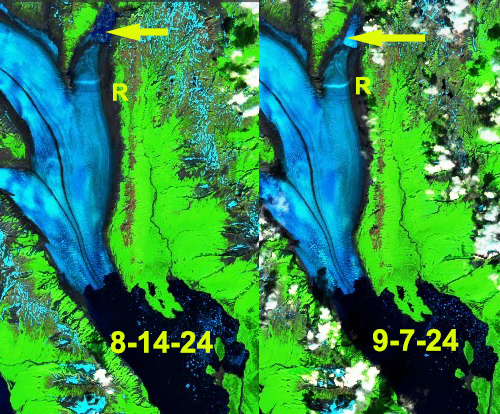
Bear Glacier ice dammed lake filled on Aug. 14th and drained on Sept. 7th, 2024 The Sentinel images indiate glacier rifts.
On June 4, 2026 the lake has begun to refill with an area of 0.55 km2 It is evident that this lake that had emptied periodically now empties annually. The date of drainage has been later in the melt season in 2024 and 2025. The continued retreat of the glacier that averaged 160 m/year from 2005-2019 (NPS, 2019), will lead to continued changes in drainage of this lake. The thinner ice is more easily lifted via flotation allowing for drainage with a more limited lake volume. The rapid lake development is a frequent pattern in the region we have observed at Excelsior Glacier Pederson Glacier and Ellsworth Glacier.
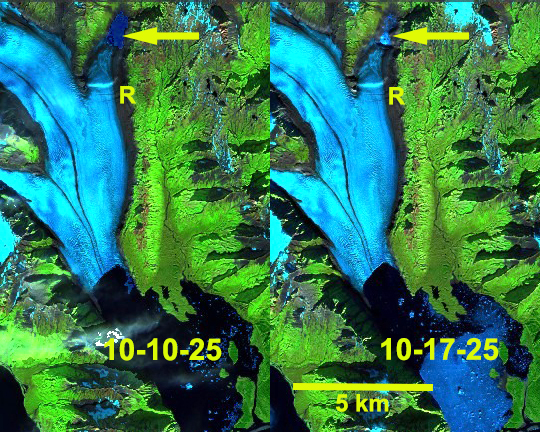
Bear Glacier ice dammed lake filled on Oct. 10th and drained on Oct. 17th, 2025. The Sentinel images indiate glacier rifts. Note increased icebergs after drainage.
Bear Glacier dammed lake filling in June of 2025 and 2026 with an area of 0.5-0.6 km2.
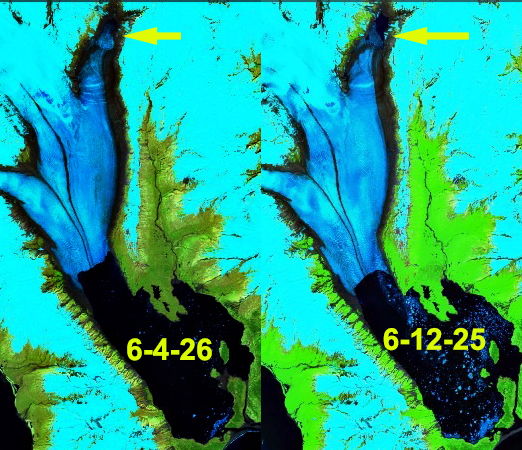
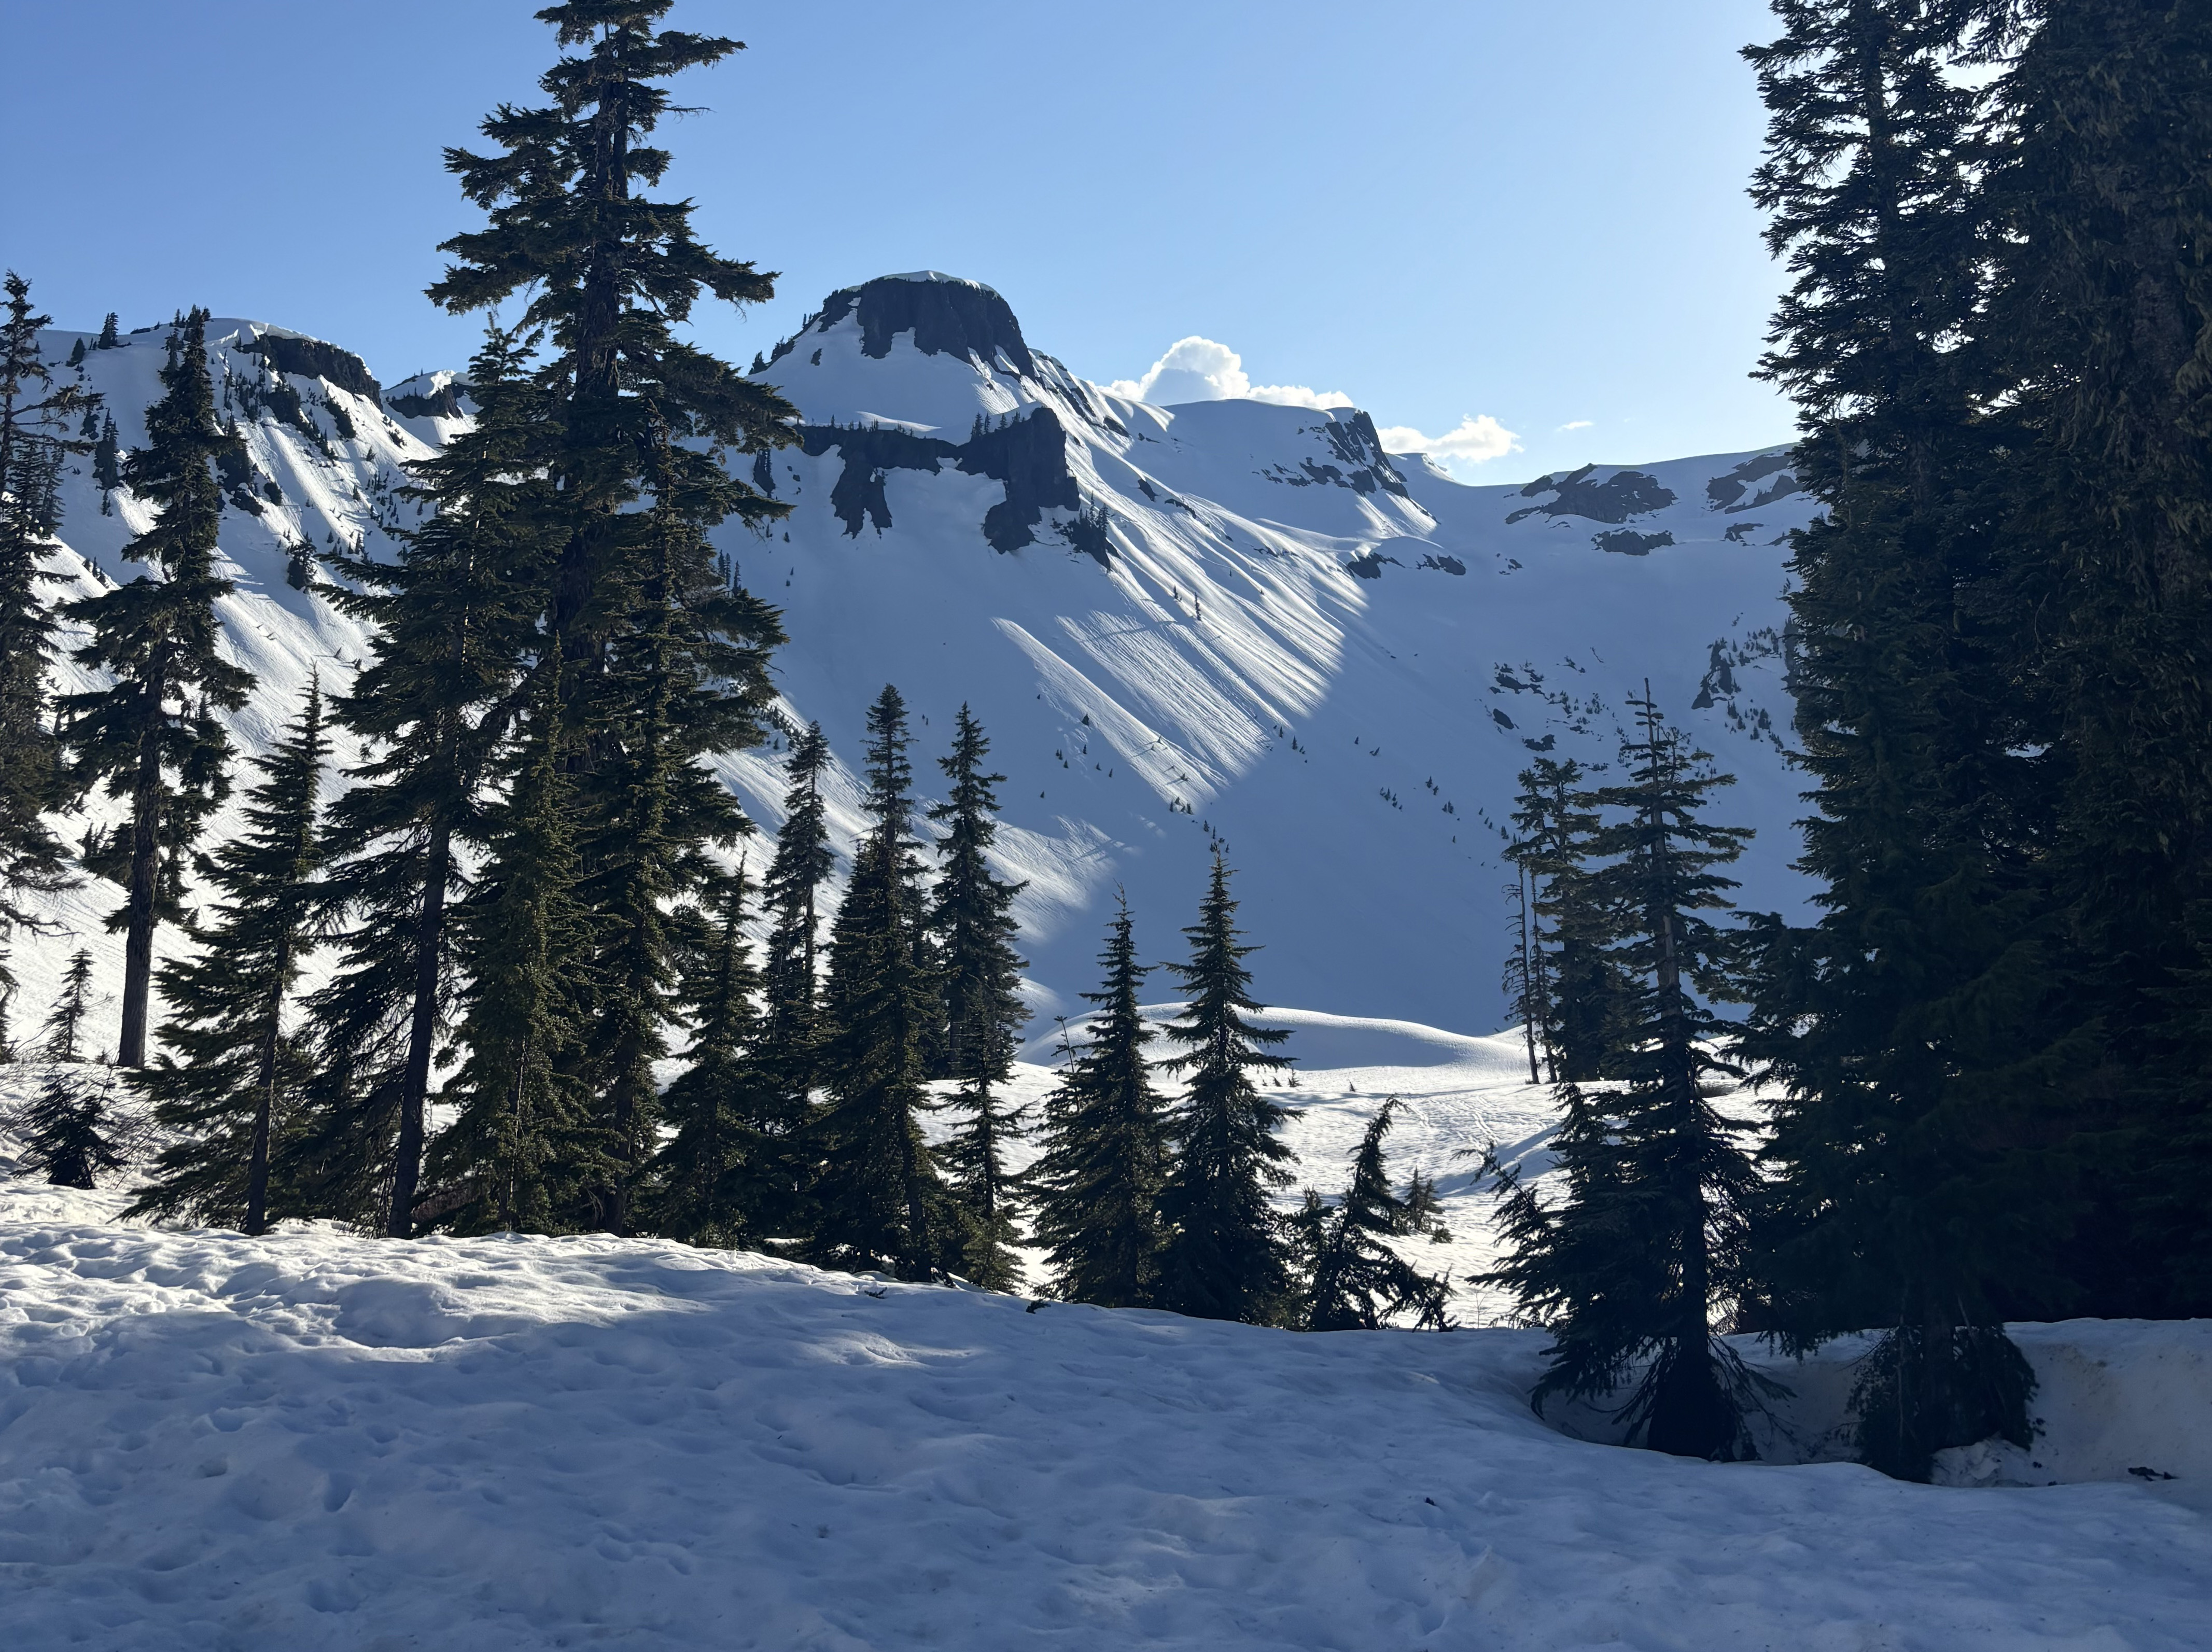
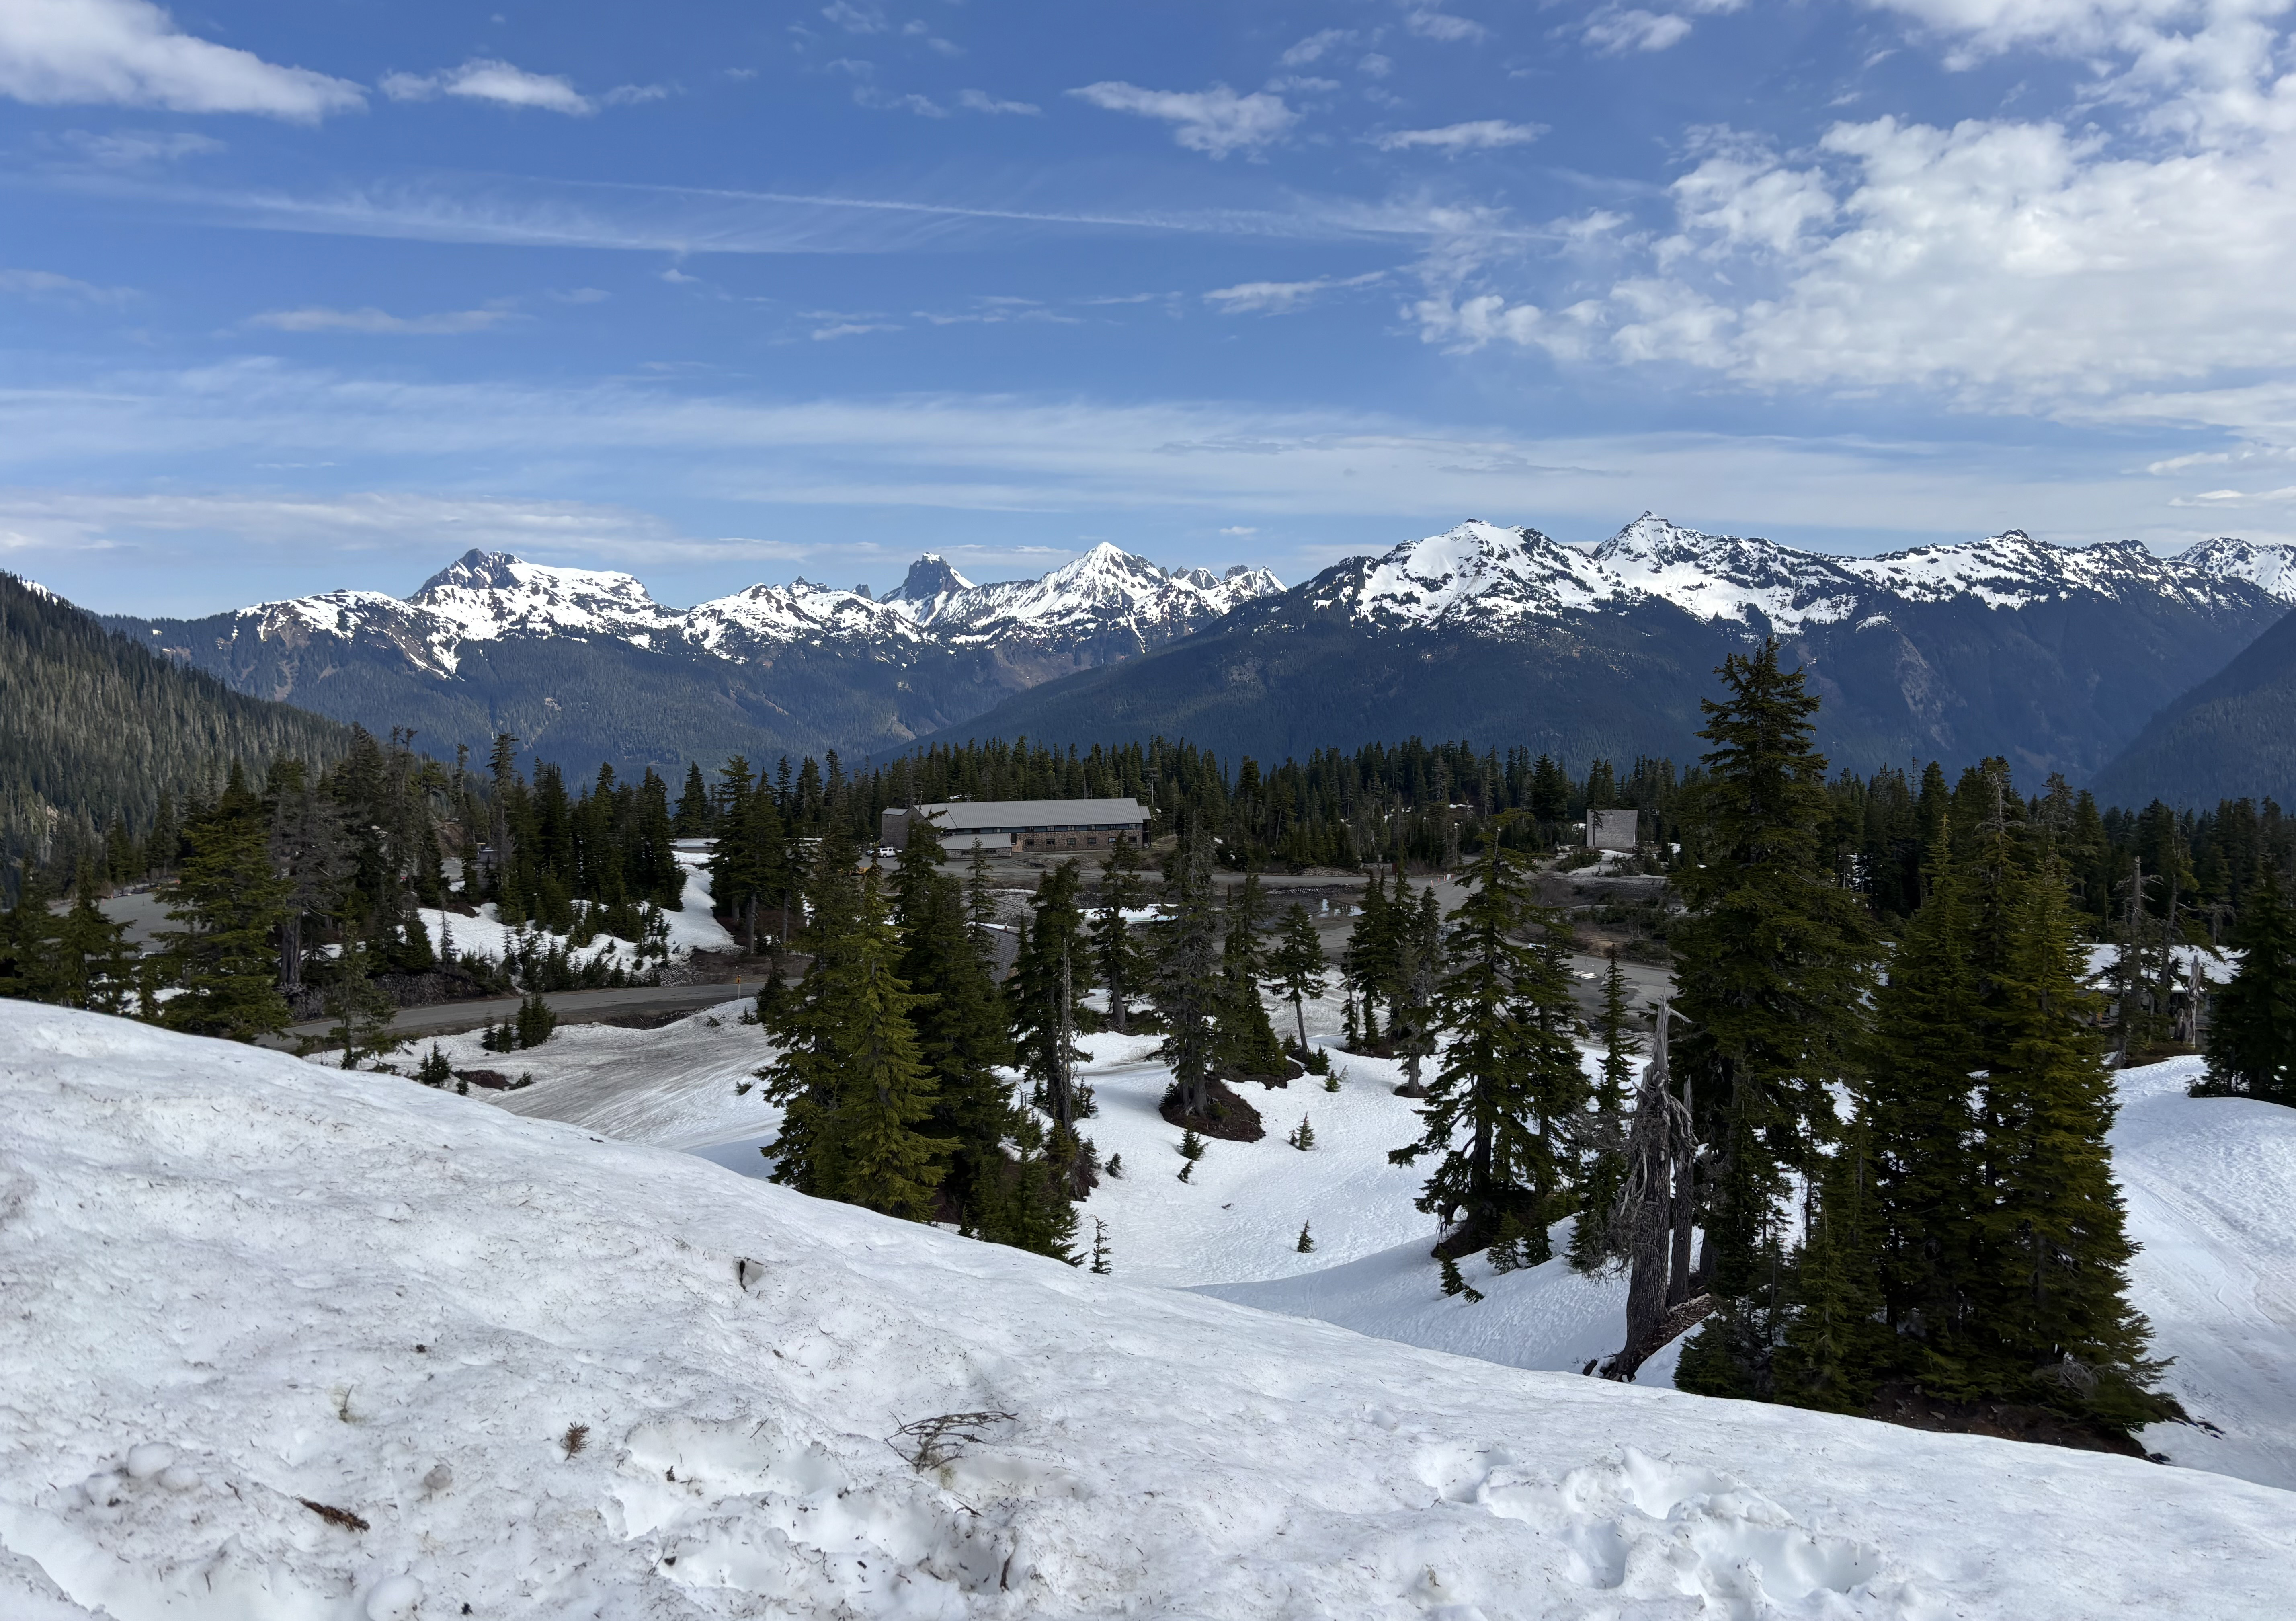
View from Heather Meadows to Table Mt on May 2, 2026 (Jill Pelto photo)
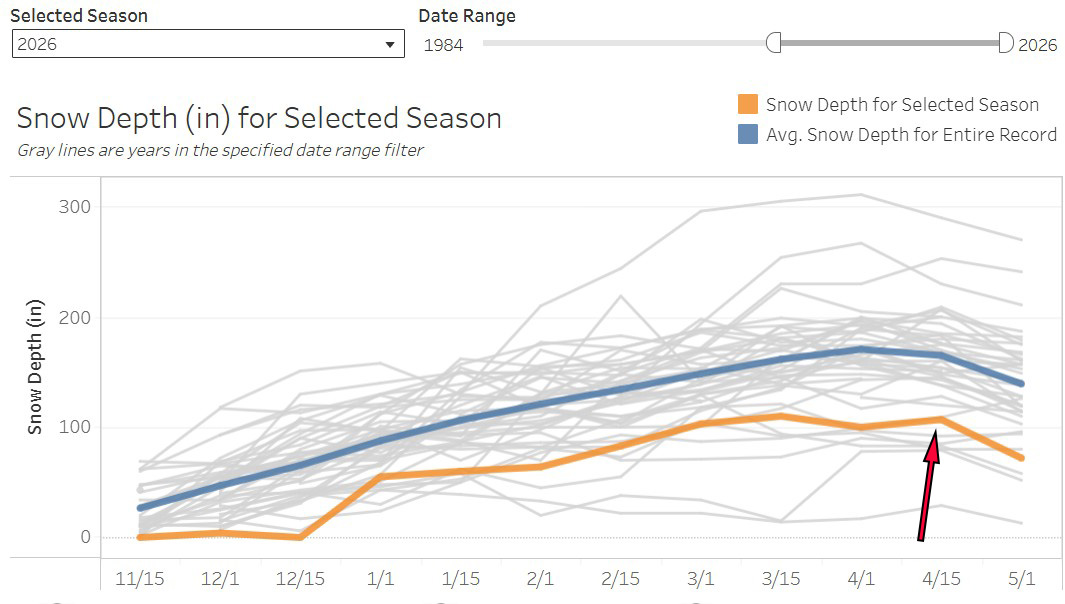
Since 1984 we have measured glacier mass balance on North Cascade glaciers every year. Mass balance is the difference between accumulation (income) and melt (expenses). The accumulation season typicallys ends around May 1. In 2026 it ended on April 19.
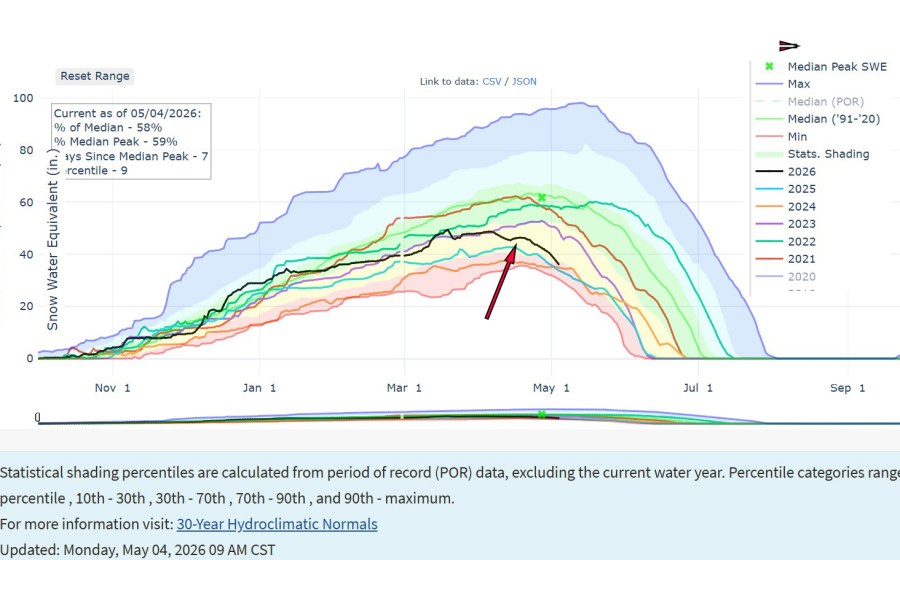
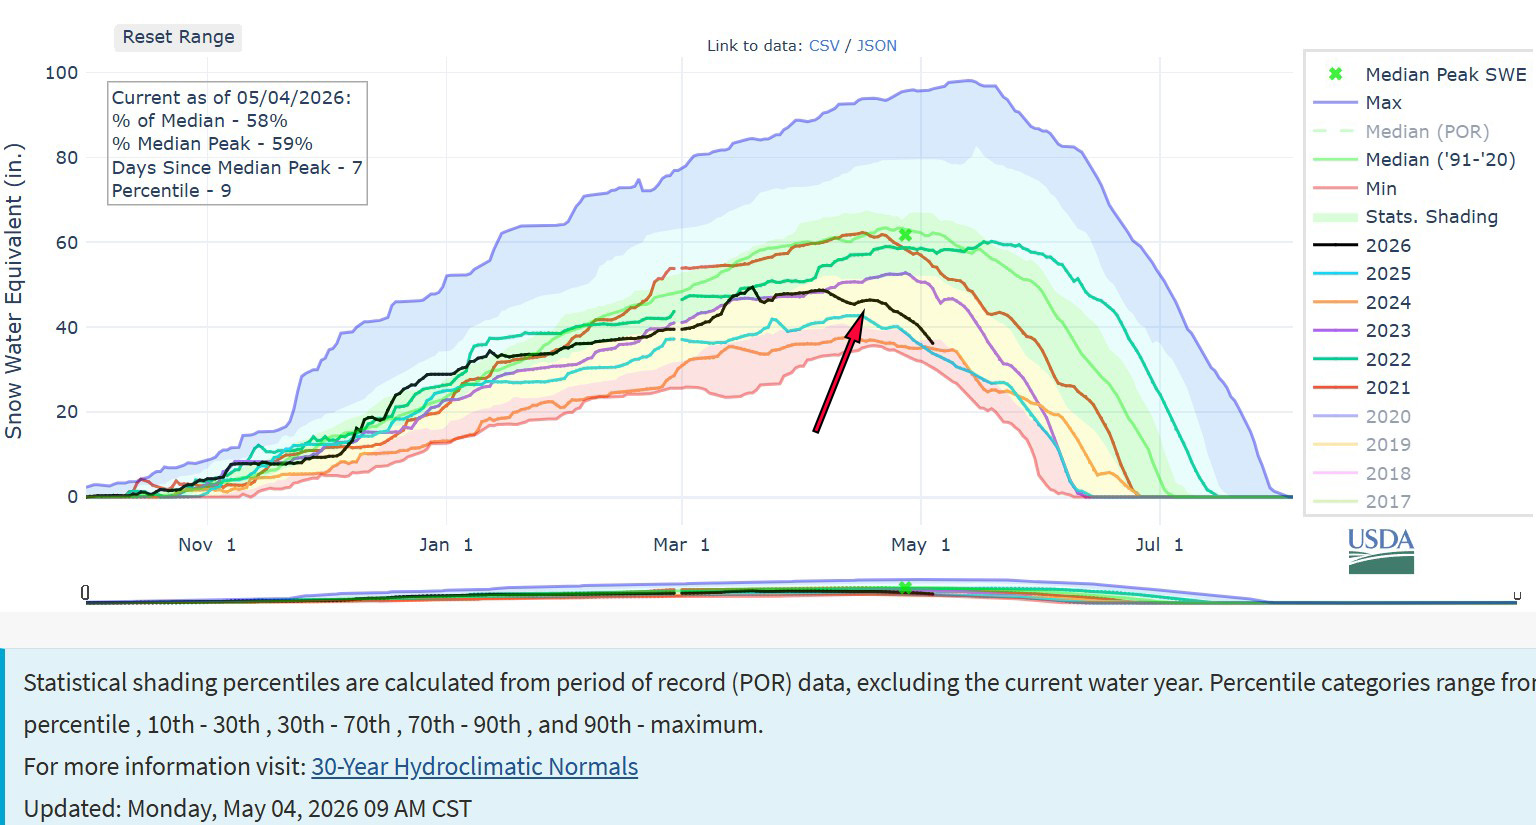
In early December snowpack was average above 1500 m (5000 feet) and limited below. The region was then impacted by a historic atmospheric river from Dec. 8-12. that led to flooding and landslides closing I-90 and Highway 2. Snowpack was completely lost at most locations below 1500 m including the Mount Baker station in Heather Meadows (1285 m). Above 1500 m at Lyman Lake (1825 m) SWE increased by 15 cm, which was 50% of the 30 cm of precipitation that fell in this period. The last half of December snow depth increased from 0 to 1.5 m at Heather Meadows. Snowpack built to 1.2 m w.e. at Lyman Lake by March 15, and then hovered around this peak until mid-April. At Heather Meadows snowpack depth peaked at 2.8 m on March 15th and was at 2.7 m on April 15th. This April 15th represented the maximum snowpack for elevations at 1500 m and above. The snowpack was less than 50% of normal below 1800 m. Above 2000 m warm wet winter events did deliver snowfall that was rain below and the situation is likely better. Working with Snowgoat Skimo as they prepare for the Kulshan Randoneee has noted snowpack of over 6 m at the 2000 m level.
The transition to melt season was rapid with a particularly warm period from April 26-May 4 has led to rapid melt off of snowpack. At Lyman Lake a third of the snowpack was lost by May 8th. At Heather Meadow 50% of snowpack depth was lost by May 8th.
Mount Baker snow depth station indicating loss of snow in December atmospheric river, then rapid development and finally the unusually rapid drop in late April. WSCO graph.
View toward lower Heather Meadows and Baker ski area-snowline above 1200 m on 5-2-26.-where the snowpack is already thin. (Jill Pelto photo)
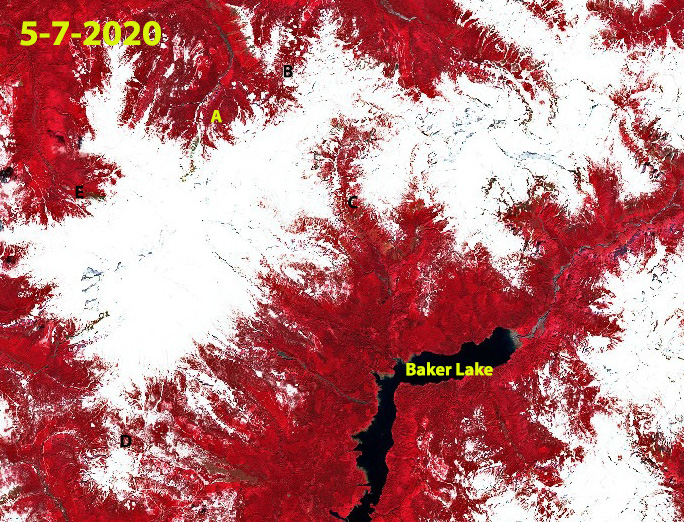
Sentinel Image from 5-7-2020 a normal snow year-snow line 850 m.
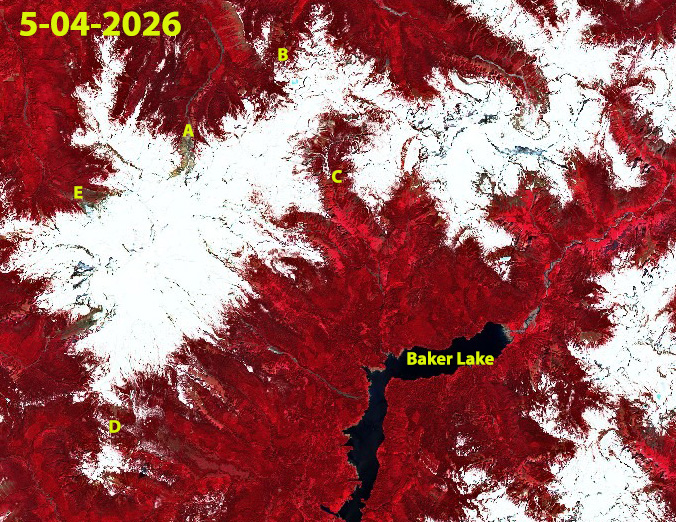
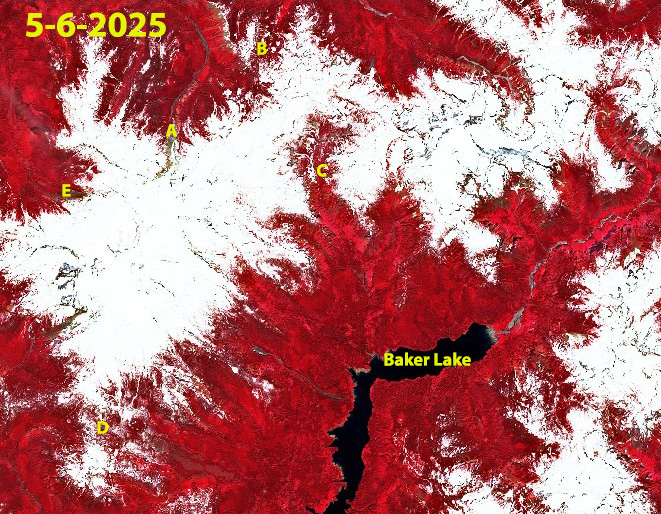
Sentinel image from 5-4-2026 illustrating regional snow line at 1200 m. The limited winter snowpack indicates that in 2026 we have a low accumulation/income for glaciers and melt/expenses already underway. Coleman Glacier terminus (E) is already exposed ice the first week in May. We will be in the field this summer to measure the details. We are expecting more bare ice and rockfall during our work.
Sentinel image from 5-6-2025 snow cover- snow line 975 m.
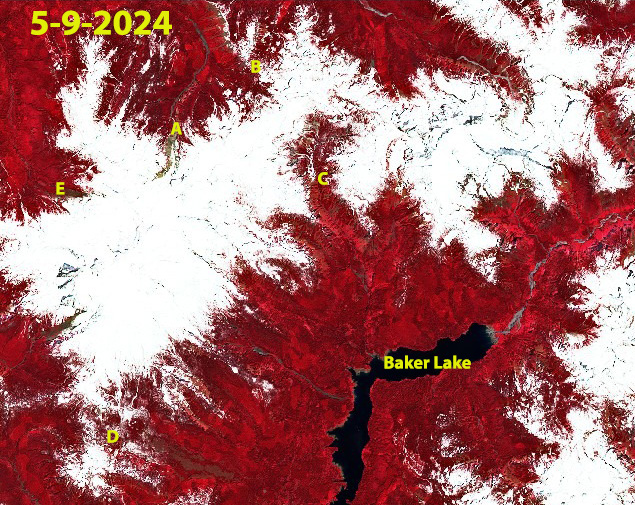
Sentinel image from 5-9-2024 with snow line at 975 m.
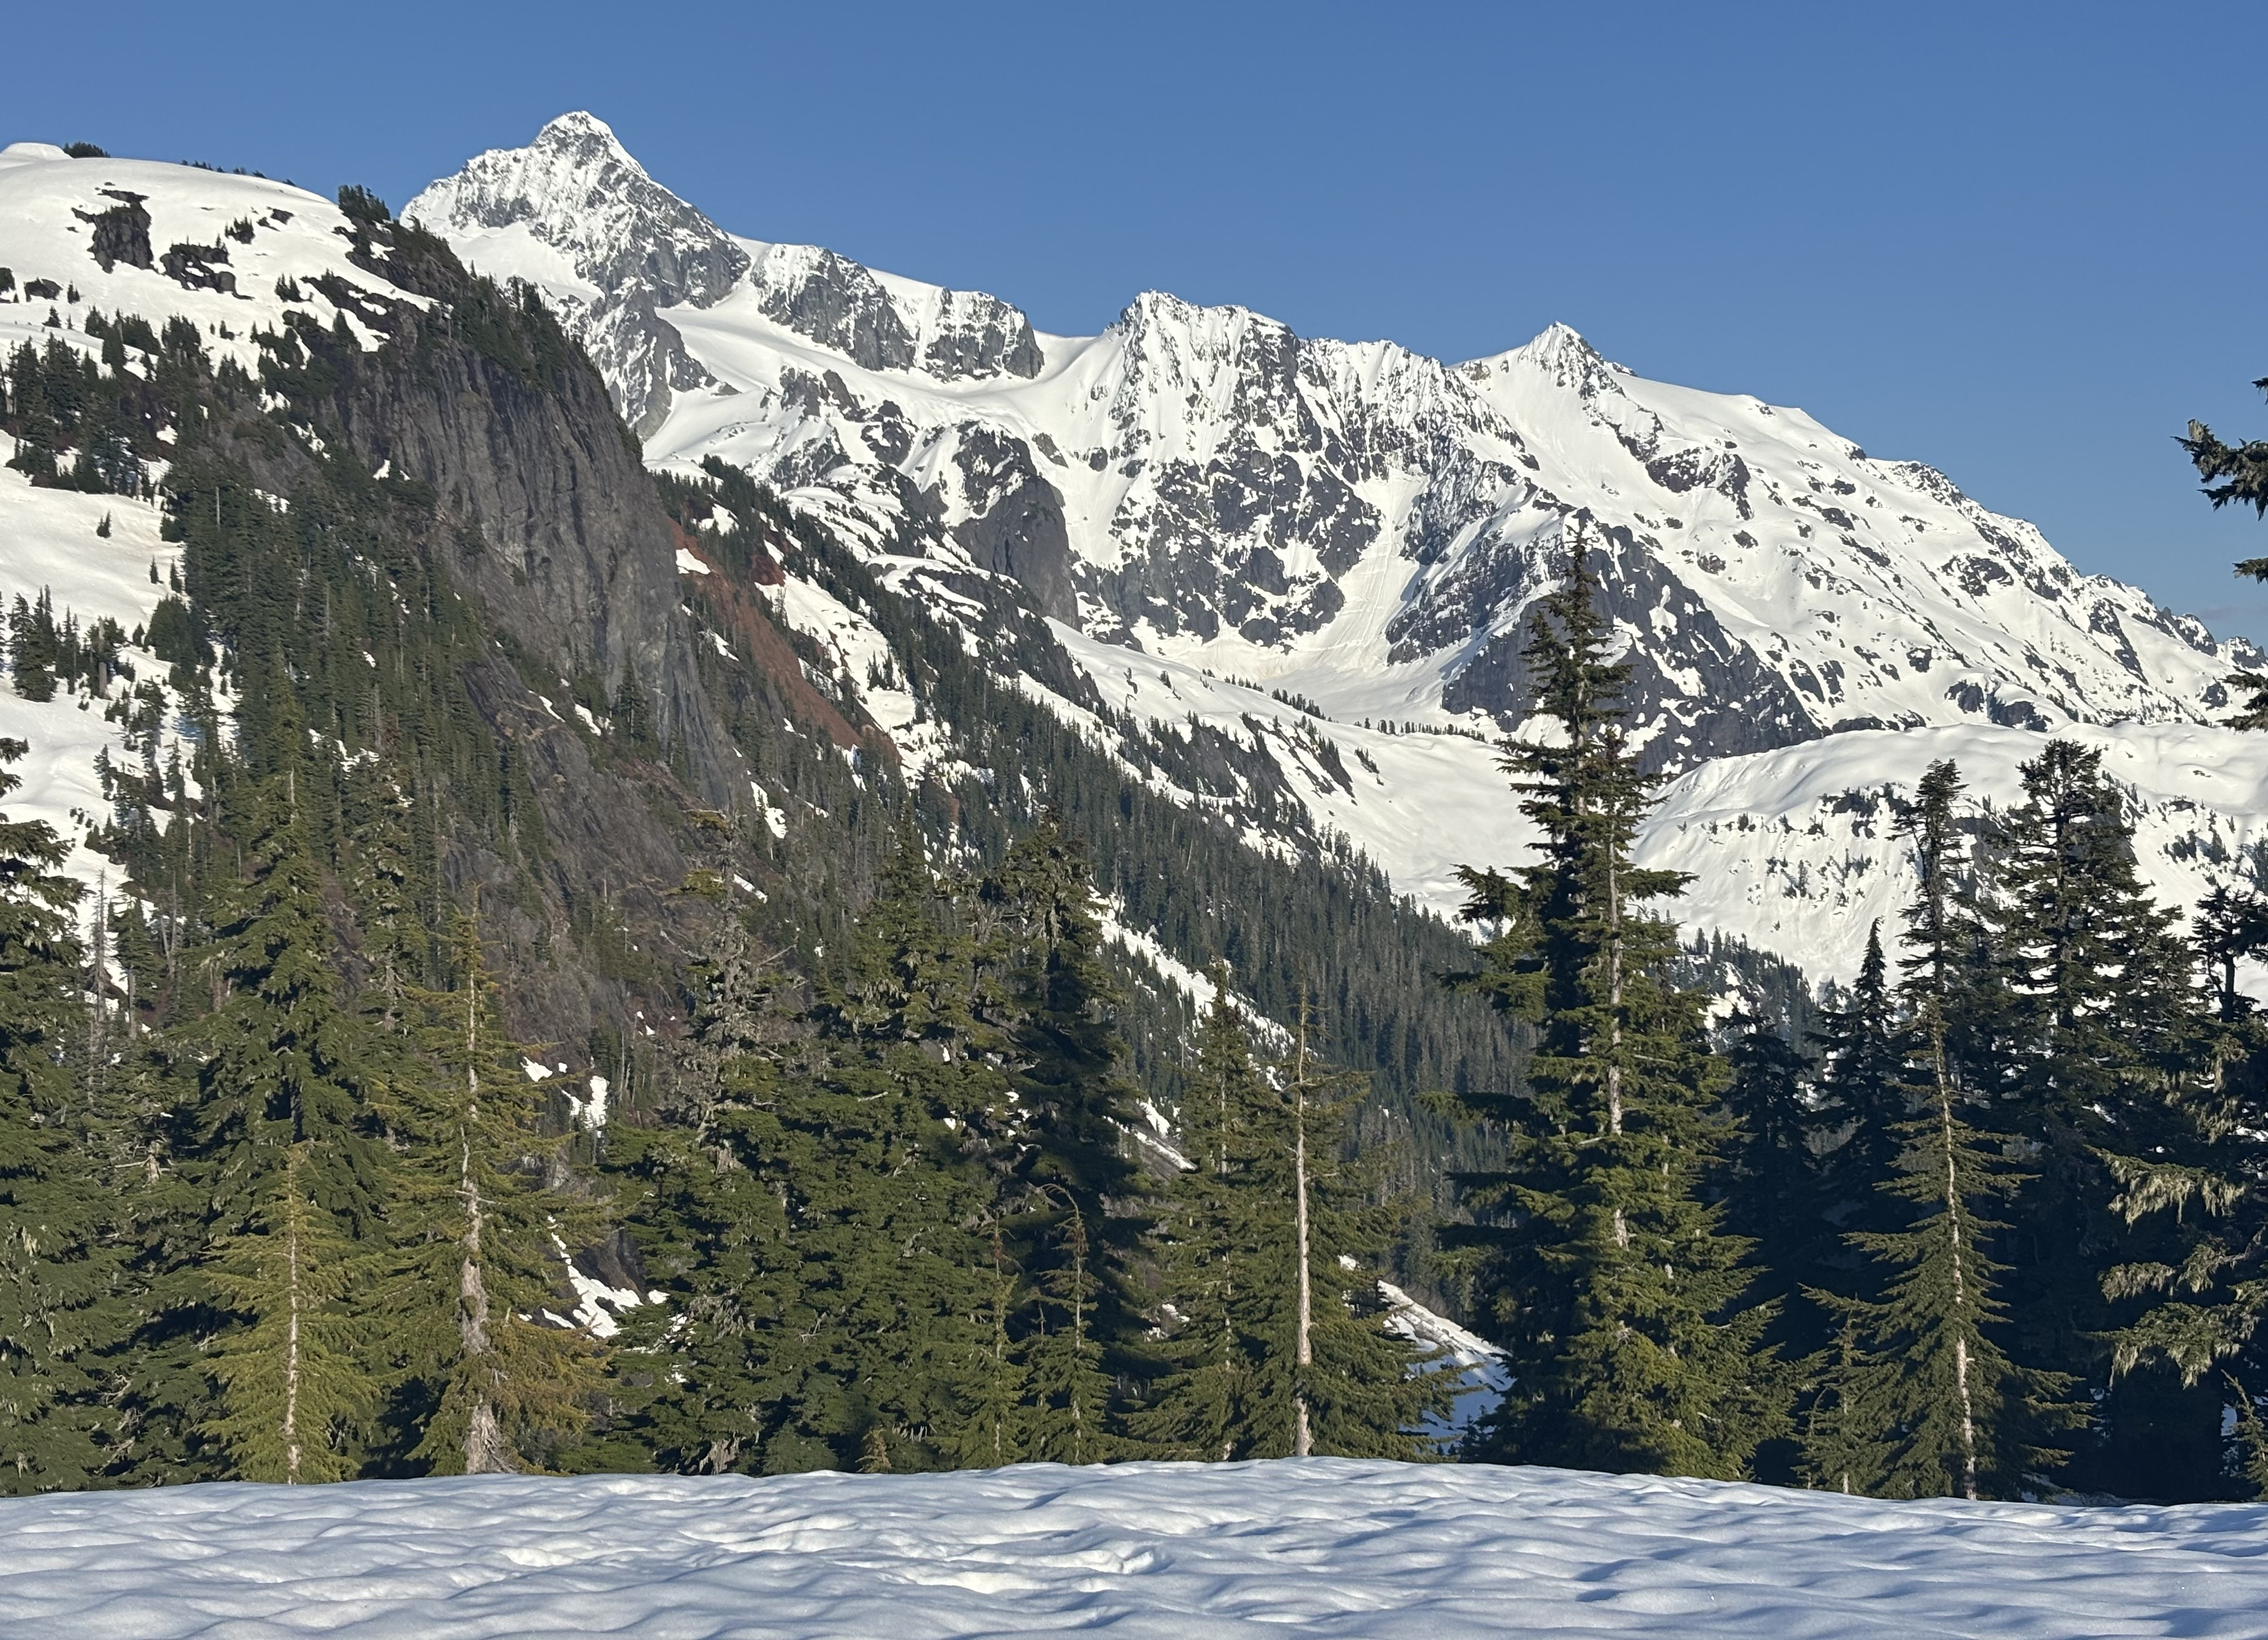
Looking from Austin Pass across to Shuskan on 5-3-26 (Jill Pelto photo)
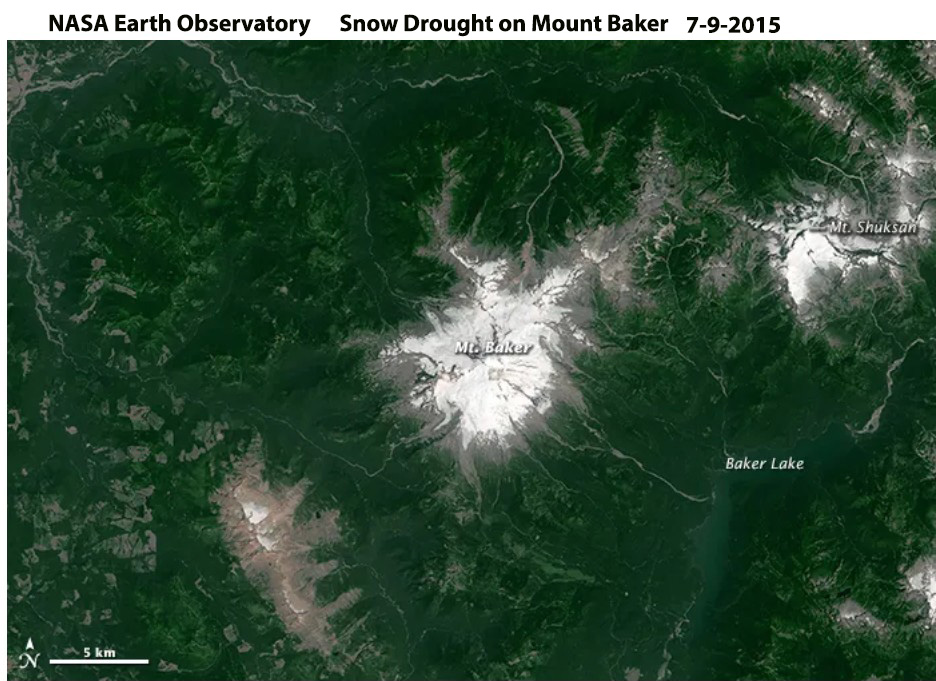
The outlook is poor for glaciers and snowpack in the Pacific Northwest in 2026. How this measures up with the snow drought of 2015 that we reported on in a project with NASA will be important to observe.
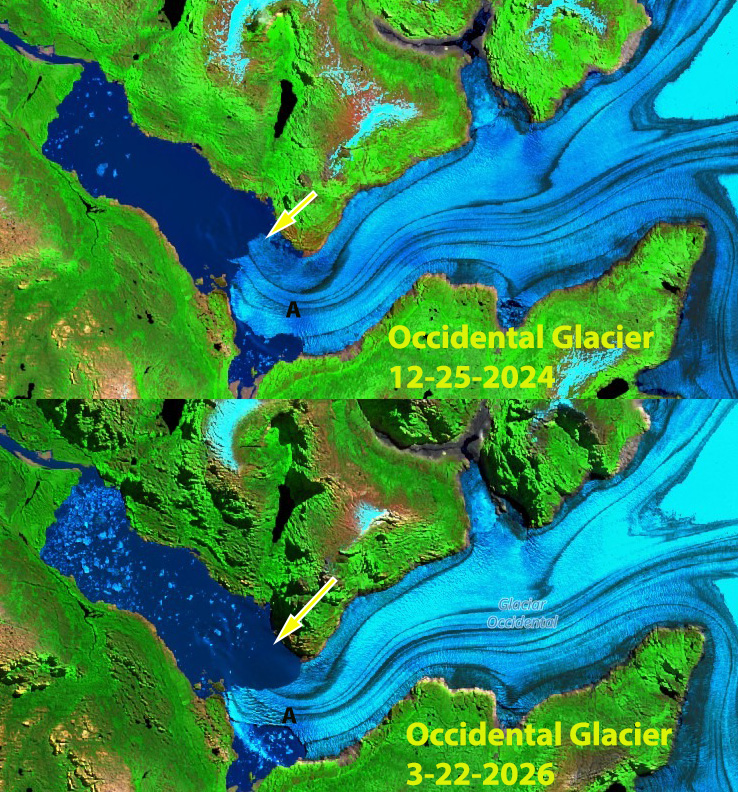
Occidental Glacier in Sentinel images from Dec. 2024 and March 2026 indicating the rapid narrowing of the terminus tongue A, that from the numerous icebergs is actively underway.
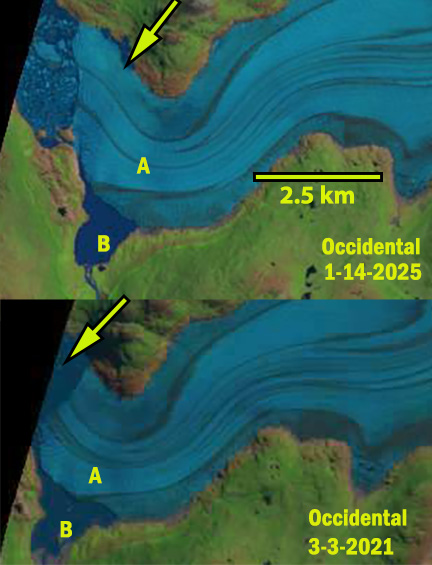
Occidental Glacier is an outlet glacier draining west from the Southern Patagonia Icefield. In 2015 the glacier terminus rested on the western shore of a proglacial lake where it bends to the northwest. At Point B a glacier lake was dammed by the ice front. From 2015 to 2021 the northwestern margin of the terminus retreated along the northern shore of the lake. By 2021 the lake at Point B was no longer ice dammed and its water level had declined. The terminus tongue (A) continued to extend to the western shore providing a stable pinning point through 2025.
In 2026 the connection to the western shore has narrowed with the embayment at Point B extending north and east. The terminus tongue (A) on March 22, 2026 is just 850 m wide and actively narrowing, note fresh icebergs. This connection is not stable and will not endure, which will generate significant terminus retreat. This glacier follows neighbors to the north Tempanos and Bernardo Glacier in this process each retreat leading to lake expansion, but also drainage of ice dammed lakes.
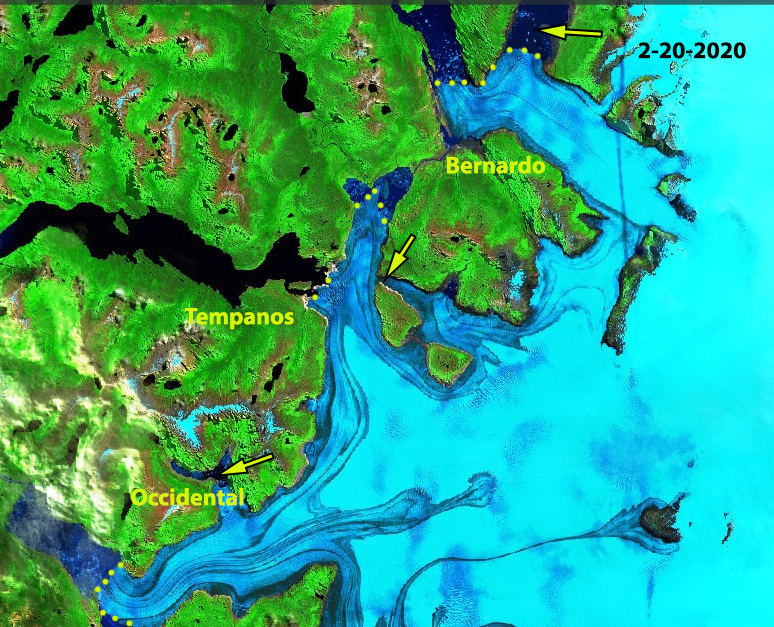
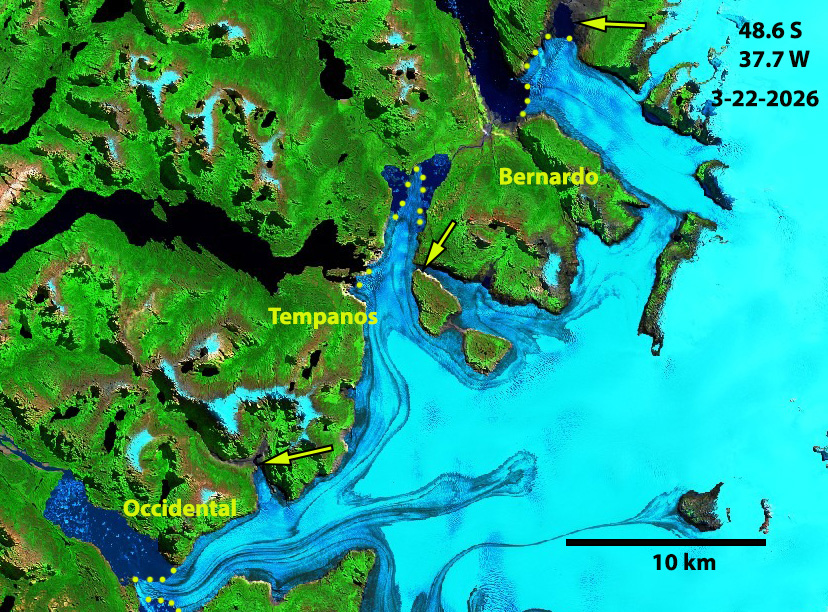
Occidental Glacier in Landsat images indicating the retreat of the terminus along the northern shore, the drainage of the embayment at B indicating diminished connection to the western shore of the lake.In 2020 Bernardo, Tempanos and Occidental Glacier had wide terminus tongues terminating in proglacial lakes.By 2026 Bernardo, Tempanos and Occidental Glacier terminus tongues had retreated and narrowed leading to both expansion of proglacial lakes and drainage of a couple ice dammed lakes that the terminus had impounded.
March 21, 2026 was World Day for Glaciers, telling this story is an ongoing four decades long project for us. The North Cascade Glacier Climate Project began in 1984 to identify the response of Washington’s North Cascade glaciers to climate change. The 2026 field season will mark our 43rd year of observations.
I co-direct the project as the science director, with Jill Pelto as the art director. We strive to create a diverse and collaborative portfolio of impactful observations connecting people to science through art and data publication. Our theory of change is that art has the power to inspire people by including the emotional context behind the science research. We seek collaborators who are passionate about contributing to and sharing this work. Here we reflect on some of the stories we have shared in the last 12 months that chronicle the rapidly melting reality of glaciers.
In April, 2025 the “Shaped by Ice” exhibit coordinated by Jill Pelto opened at the Slip Gallery in Seattle. This featured work from nine artists, eight of whom had been in the field with us and was the focus of a Seattle Magazine article.
In May we worked with Protect Our Winters to explore what the loss of glaciers, “Beyond the Ice” means for specific regions.
In June, High Country News focused on the use of art to preserve the legacy of glaciers, given the glaciers themselves are not being preserved.
In March through July we worked with the Global Glacier Casualty List to the tell the story of specific glaciers in the United States that are disappearing, including Ice Worm Glacier in the North Cascades, Darwin Glacier in the Sierra Nevada, Twins Glacier in Wyoming and Burroughs Glacier in Alaska.
In August our field season coincided with a Seattle Time report, on Melting Mountains in the Pacific Northwest means, that we collaborated on.
Joining us in the field on the Lower Curtis Glacier, Mount Shuksan was KING5 NBC-Seattle affiliate, led by Meteorologist Leah Pezzetti who backpacked with us into her first glacier. The logistical preparation for this by KING5 was thorough, and we provided guidance and support to them. The resulting feature was released while we were still in the field.
Upon returning to the trailhead from Lower Curtis Glacier a CBS Sunday Morning News team met us and travelled into the field with us to Sholes Glacier, Mount Baker. The overnight trip into the backcountry was a first for this news team and required extensive collaborative support. The results were shared just two weeks after the filming, and right after our field season.
We worked for a second year with Dan MacComb on a short film for the UN International Year of Glaciers’ Preservation called “Shaped by Ice”. This film published by Protect our Winters has been featured in tfour film festivals during 2025.
In January through February a second “Shaped by Ice” gallery event was held in at the Confluence Gallery in Twisp WA. This was spearheaded by Jill Pelto, Margaret Kingston, and Claire Waichler.
A poor winter snowpack will certainly lead to another year of extensive glacier loss across the Pacific Northwest and we will be there to observe it.
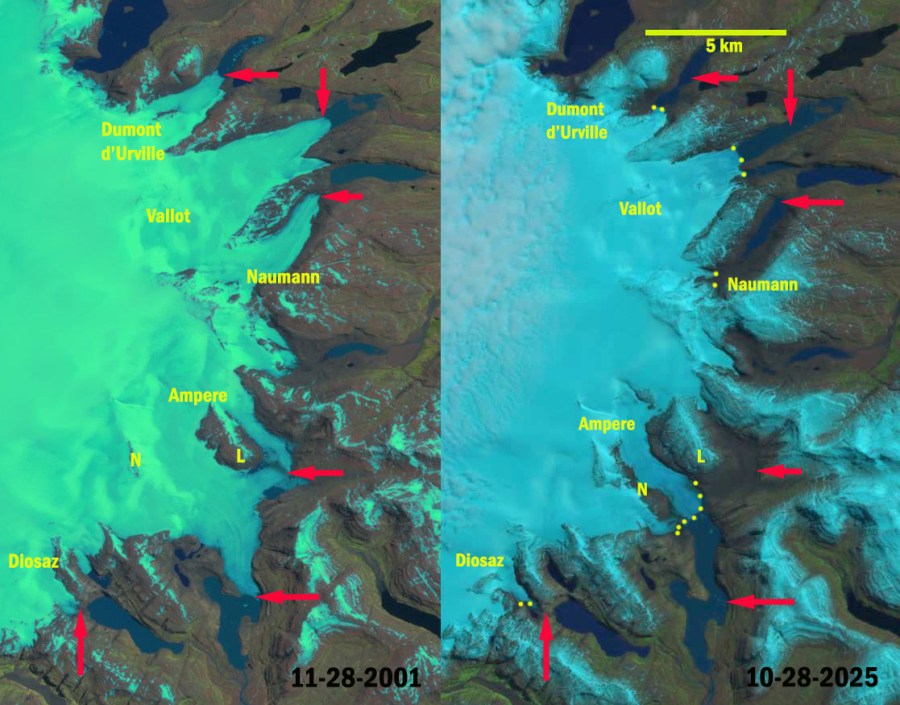
The retreat of the main outlet glaciers of Cook Ice Cap is evident in the Landsat images from 2001 (red arrows) to 2025 (yellow dots). Dumont D’Urville Glacier=-1.5 km, Vallot Glacier=-2.4 km, Naumann Glacier=4.0 km, Ampere Glacier=-3.3 km and Diosaz Glacier=-0.8 km.
Kerguelen Island is at the edge of the furious fifties in the southern Indian Ocean. The island is host to many glaciers, the largest being the Cook Ice Cap at 400 km2. A comparison of aerial images from 1963 and 2001 by Berthier et al (2009) indicated the ice cap lost 21 % of its area in that period. The east side of the Cook Ice Cap outlet glaciers tetreat has led to formation and expansion of a new group of lakes (Pelto, 2016). Here we examine the changes from 2001-2025 along using Landsat and Sentinel imagery.
Ampere Glacier main terminus retreated 800 meters from 2001-2011. Here the terminus has pulled back from the tip of the peninsula on the west side of the terminus and is currently at a narrow point. The eastern terminus has retreated to its junction with the main Ampere Glacier a distance of 1400 m. From 2011 to 2025 the retreat accelerated totalling 3.3 km by 2025. The glacier had two nunataks L and N in 2001, by 2025 L has emerged as a marginal mountain and N is barely surrounded by ice.
Diosaz Glacier retreated 0.8 km from 2001-2025 leading to a small new lake basin developing.
Naumann Glacier retreat has been 4.0 km from 2001-2025 creating an new alpine lake. With the glacier no longer terminating in the lake retreat should slow.
Vallot Glacier has retreated 2.4 km creating a new alpine lake at its southern terminus. The glacier will have just one terminus in the near future and the two lake basins could merge.
Dumon d”Urville Glacier has retreated 1.5 km with the lake it terminates in developing an expanding southern embayment.
The east side of the Cook Ice Cap on Kerguelen Island outlet glaciers retreatn and expanding group of lakes illustrates widespread ice cap thinning (Pelto, 2016). Verfaillie et al (2016) identified that the accelerating glacier wastage on Kerguelen Island was due to reduced net accumulation and resulting rise in the transient snowline since the 1970s, when a significant warming began.
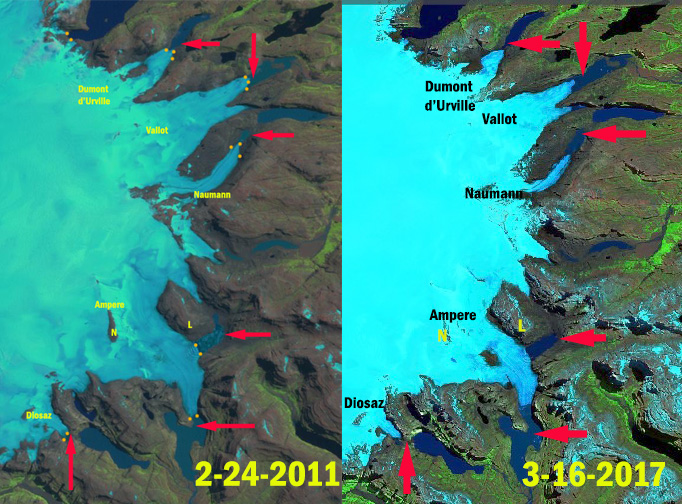
Cook Ice Cap in 2011 Landsat and 2017 Sentinel image. Red arrows indicate 2001 terminus positions and orange dots the 2011 terminus position.
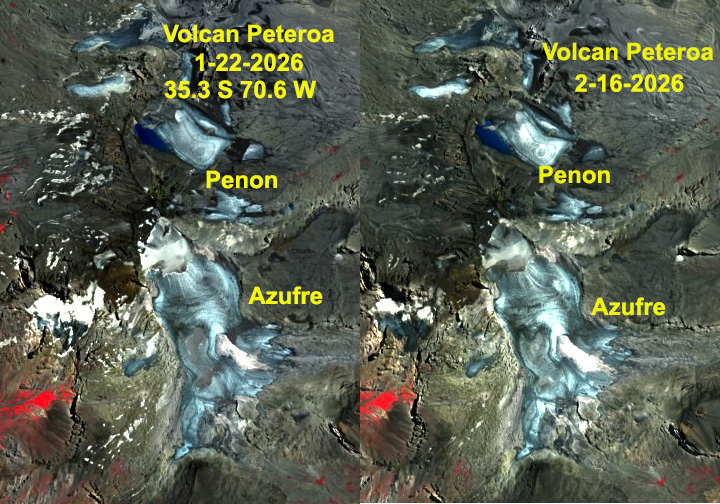
Volcan Peteroa at 35 S straddles the Argentina-Chile Border. Its glaciers-Azufre and Penon have been nearly snow free since mid-January 2026with 5% snowcover on Feb. 16, 2026. These glaciers drain into Rio Colorado and then the Rio Lontue River of Chile.
The summer of 2026 has led to high snow lines and many snow free glaciers in the Central Andes of Argentina and Chile. This follows the pattern observed in 2022, 2023 and 2025 of limited retained snowcover (Pelto, 2025). To be in equilibrium a glacier needs to have 50+% snow cover at the end of the summer. When an alpine glacier such as this loses essentially all snow cover, glacier wide mass balance loss is at least 2 m,. This equates to more than 2 m of thinning on average across the entire glacier.
The Glambie Team (2025) found the southern Andes lost 12.8% of their total mass from 2000-2023. Ayala et al (2025) identified that from 2000-2019 Central Andean glaciers were able to buffer drought conditions in this region. Annual precipitation was 36% below average in this period yet streamflow was essentially maintained. Continued area loss since 2019 is and will lead to ongoing summer runoff declines. This impacts down stream hydropower, aquatic life and agriculture.
From 33 S at Olivares Alfa, to 35 S at Volcan Peteroa False Color Sentinel images illustrate the lack of snow cover in Janurary leading to less than 5% retained snow cover for each of these four glaciated areas.
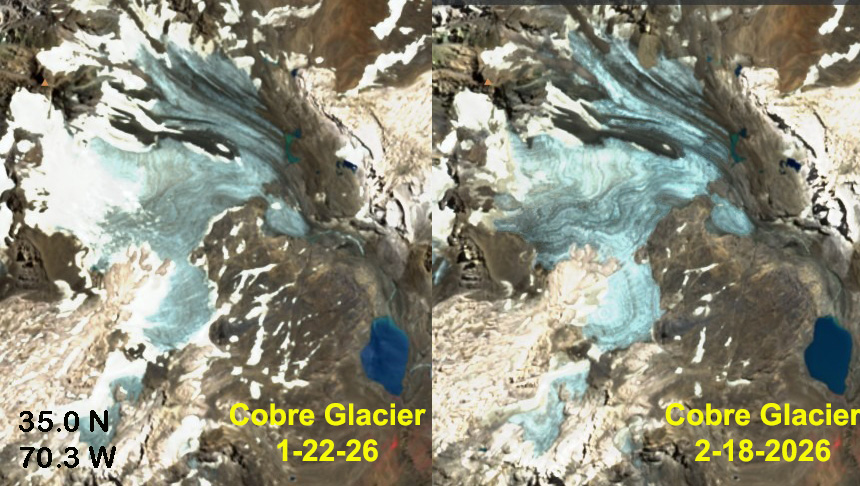
Cobre Glacier, Argentina flows east from the border. It’s snow cover declined from 20% on Jan. 22, 2026 to 5% on Feb. 18, 2026.The glacier continues to retreat rapidly, the glacier reached the lake at lower right in 2016.The glacier drains into the Rio Grande River.
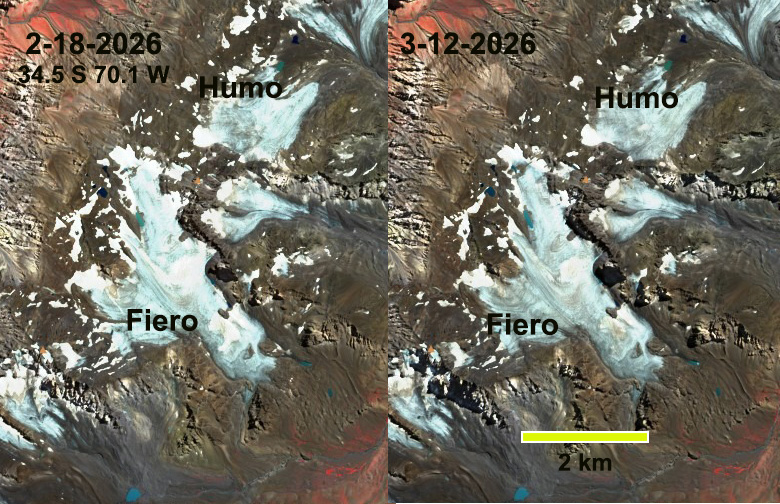
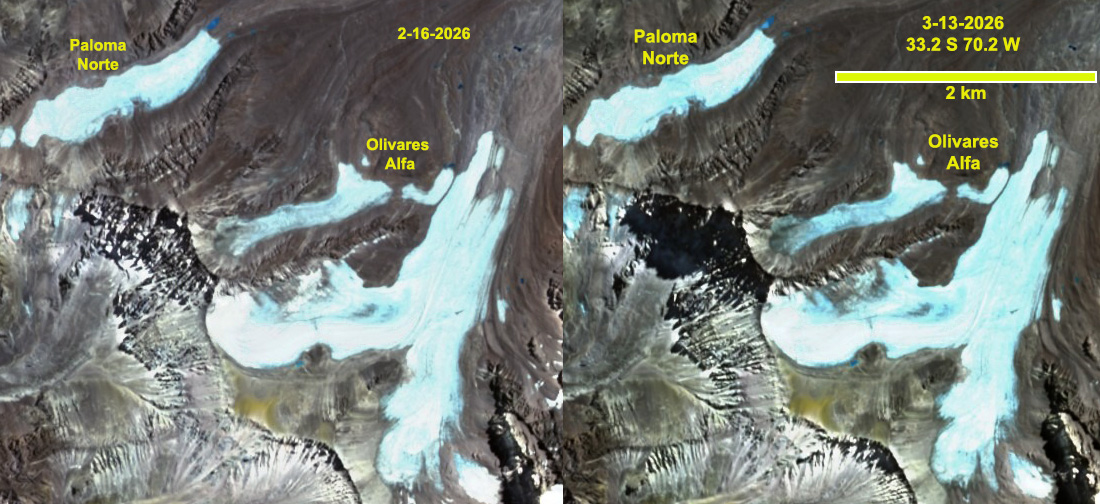
Humo Glacier and Fiero Glacier, Argentina had 20% snow cover on feb. 18, 2026 declining to 5% snow cover on March 12, 2026. It drains into Lago Atuel and is one of the headwaters of Rio Atuel. Rio Atuel has hydropower development above and within the Rio Atuel Canon including Nihuil dam above the canyon and four more dams within the canyon, including Valle Grande Reservoir.Olivares Alfa Glacier and Paloma Norte Glacier, Chile had less than 10% snow cover on Feb. 16, 2026 declining to less than 5% on March 13, 2026.The glaciers are at the headwaters of the Olivares River, which drains into the Coloardo River. The Alfalfal Hydropower Plant is on the Colorado River.
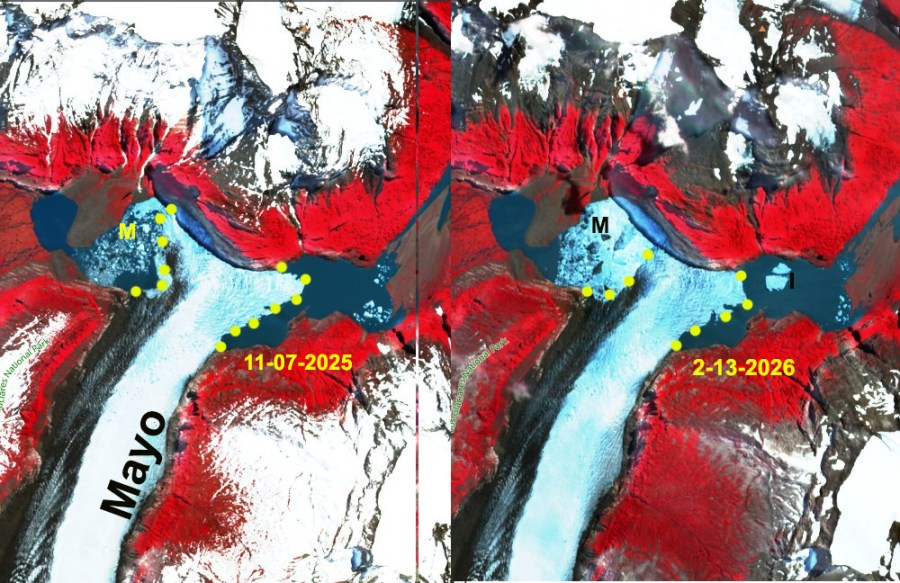
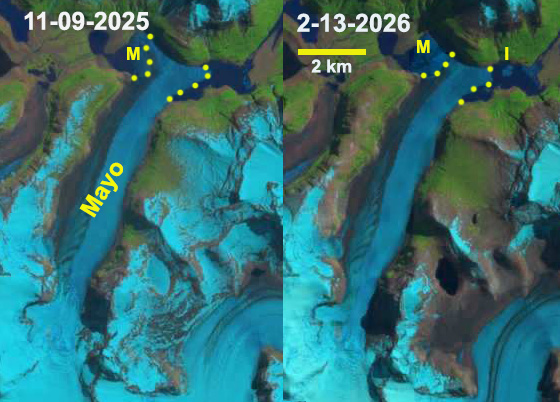
Glaciar Mayo terminus change from November 2025 to February 2026 illustrated in Sentinel images. The yellow dots indicate the margin, which has retreated on both sides forming a melange (M) and new icebergs (I).
Glaciar Mayo, Argentna in Los Glaciares National Park is an eastern outlet of the Southern Patagonia Ice Cap. The glacier has terminated on the northern shore of a glacial lake for the last 35 years. The mass balance from 1975-2011 was identified as slightly positive by Schaefer et al (2015). This enabled the glacier to terminate on the northern shore of a glacial lake, an arm of Lago Argentino from 1984-2020. From 2000-2019 Minowa et al (2021) noted that Glaciar Mayo had transitioned to a negative balance and overall thinning. This thinning is what has led to the terminus beginning to collapse into the lake.
The terminus tongue projecting into the lake had been 2.5 km2, had now declined to 1.4 km2. The terminus along the northern shore had been 2000 m wide and is now 1150 m wide. There is further crevassing/rifting that suggests the glacier tongue is not done thinning in 2026. This continues to be an active year for calving retreat in Patagonia as seen at Upsala and Jorge Montt Glacier, see below.
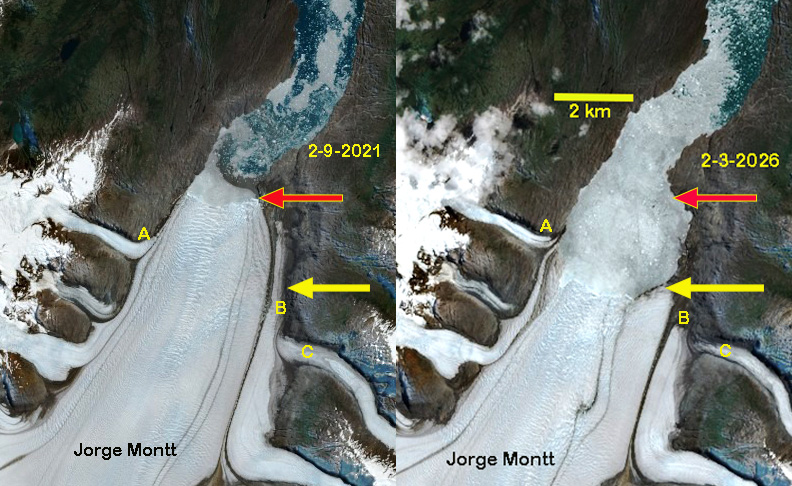
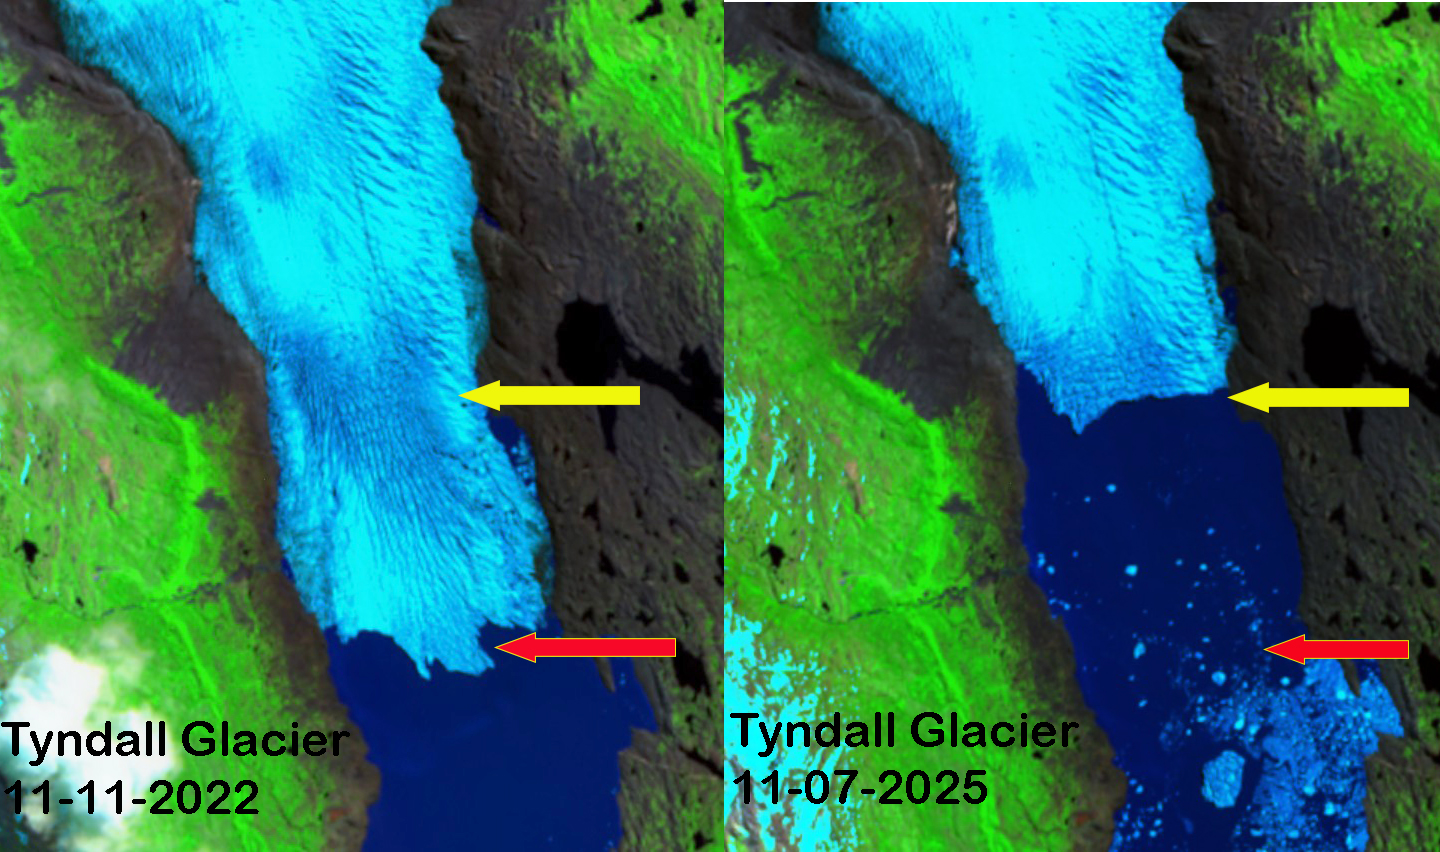
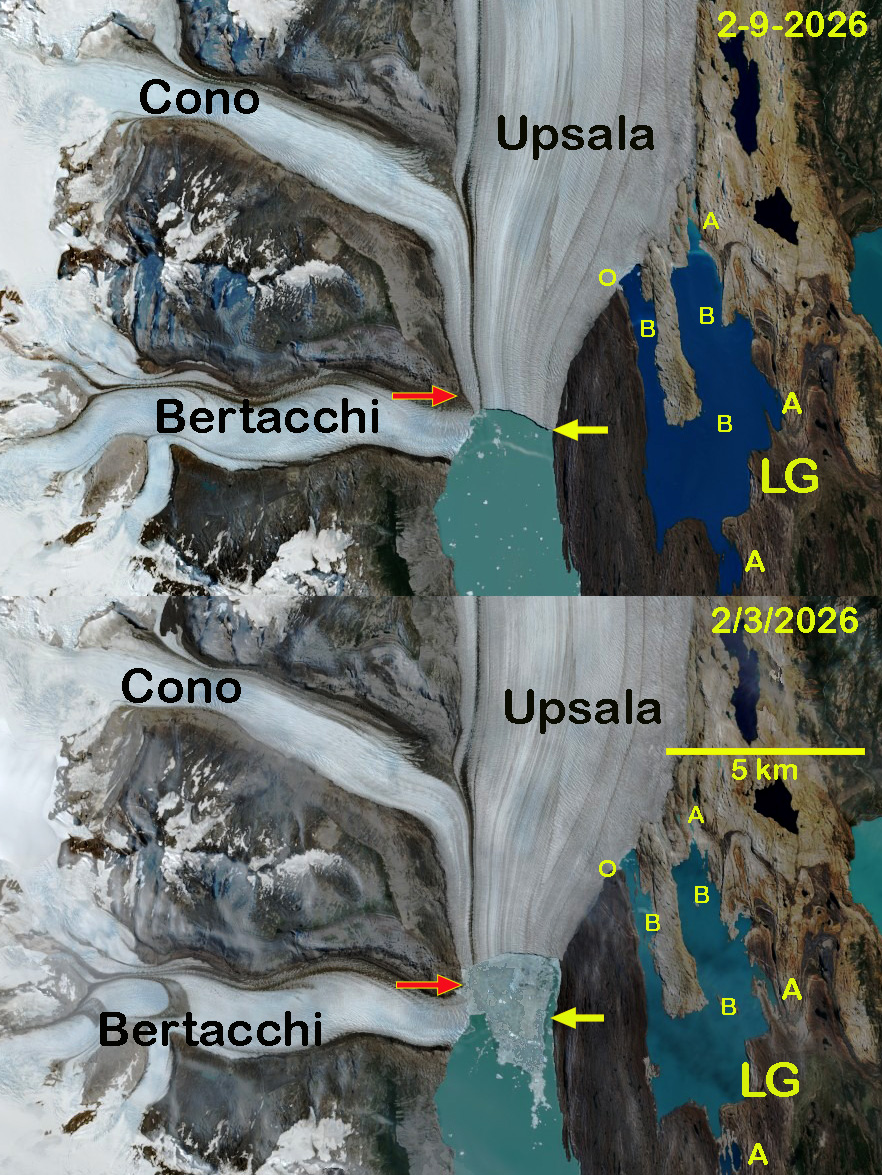
Glaciar Mayo terminus change from November 2025 to February 2026 illustrated in Landsat images. The yellow dots indicate the margin, which has retreated on both sides forming a melange (M) and new icebergs (I).Jorge Montt Glacier retreat from 2021-2026 with a particularly extensive and packed melanage in 2026, observed in Sentinel images.Tyndall Glacier 2 km retreat from 2022-2025 continues with heavily crevassed terminus front indicating an active calving retreat will continue in these Sentinel images. The terminus front is noticably higher above the water indicating thicker ice and likely deeper water.Upsala Glacier had a burst of calving in Feb. 2026. The comparison to 2021 highlights both the retreat, separation from Bertachhi Glacier and substantial drainage of Lago Guillermo.