Moving to AGU Blogosphere

As of today this blog is shifting to the AGU Blogosphere.  The blog has the same name and will have the same approach with two blogs a week on a the response of glaciers to climate change, one glacier at a time.  If you have been a follower of this blog, please follow there.  Note all the posts have been migrated there too.

Thanks for the continued support and interest.

http://blogs.agu.org/fromaglaciersperspective/

DSC02908

Mauri Pelto

Field Observations on Lower Curtis Glacier

This is a visual introduction to our 31 years of work on Lower Curtis Glacier complimented with Google Earth imagery to illustrate the changes.  Each year since 1984 this glacier has received an annual checkup from us, North Cascade Glacier Climate Project.  The mass balance and retreat of this glacier is reported to the World Glacier Monitoring Service.  Many nights have been spent camped below this glacier. Unfortunately in the last seven years we have had mostly wet weather at this site, that hopefully will not be repeated this coming summer. 

Zongo Glacier Retreat, Bolivia 1994-2014.

Zongo Glacier, Bolivia extends 2.9 km down the south side of Huayna Potosi from 6000 m to 4900 m. Zongo Glacier is a small valley glacier located 30 km north-east of La Paz, and its runoff is directed to an important hydraulic power station which supplies La Paz. Note Laguna Milluni in foreground of the first image. The dam is visible as is the power station to the right and below the lake. The glacier has considerable snowcover on its upper section and crevassing. This indicates a persistent accumulation zone. In 1991 a glaciological research program was established on Zongo Glacier to monitor mass balance, understand its hydrology and energy balance. The long term director of this research Bernard Francou has been called the glacier guardian. The cumlative mass balance of the glacier from 1991-2013 has been -6.5 m water equivalent. The typical Alpine glaciers undergoes a long accumulation period in winter and a short ablation season in summer. The glaciers of the tropical Andes experience snow accumulation during the wet season, austral summer on their upper regions and maximum ablation during the same season low on the glacier. In the dry season winter there is a period of low ablation over the whole glacier. Mean annual air temperature at the long term snowline at 5250 m is -1.5 °C. Mean precipitation is about 0.9 m/year. zongo laguna
Google Earth image-Huayna Potosi and Zongo Glacier

Since 1991 the glacier has lost more than 7 m of thickness and has retreated significantly. The mass balance loss has been most pronounced during El Nino periods. La Nina’s are associated with positive or only slightly negative mass balance. Here we examine Landsat imagery and Google Earth imagery form 1994 to 2014.

In 1994 there is no lake at the terminus of the glacier, red arrow. By 2004 the Google Earth image indicates the glacier terminating along the northeast shore of the lake, a 90 m retreat in a decade. By 2008 the glacier no longer reaches the edge of the lake, but the front is still crevassed. In 2014 the glacier terminates 100 meters from the lake. Total retreat during the 20 year period is 220 m. The current terminus in 2014 is dirtier and less crevassed than in 2004, and less crevassed than in 2008. The lower 200 m of the glacier is thin, narrow and lacks active crevassing. This relatively stagnant area will melt away in the next decade.

Zongo Glacier continues to have an accumulation zone, a necessary essential for glacier survival, and unlike the nearby Chacaltaya Glacier which disappeared in 2009, it will exist for sometime. The Chacaltaya Glacier is a small glacier, like 80% of the glaciers in this region of the Cordillera Real, and its disappearance puts more pressure on the water resources provided by the larger remaining glaciers such as Zongo Glacier. Rabatel et al (2013) note the striking rise in the freezing levels in the region due both to higher temperatures and more convective activity that is a particular threat to glacier survival.

zongo ls 1994
1994 Landsat image

zongo 2004
2004 Google Earth image

zongo 2008
2008 Google earth image

zongo 2014
2014 Google Earth image

zongo ls 2014
2014 Landsat image

Mahsa Icefield Retreat and Separation, Baranof Island, Alaska

The Mahsa Icefield is at the headwaters of Takatz Creek.  This is a small glacier, not an actual icefield.  Five kilometers to the west is another small unnamed glacier at the headwaters of Sawmill Creek.  Here we focus on changes in the two glacier using Landsat images from 1986 to 2014.mahsa icefield ge

Google Earth image

In 1986 the Mahsa Icefield is a contiguous glacier that extended 5 km from east to west, red arrow indicates  the mid-section of the icefield.  A separate glacier in Sawmill Creek, yellow arrows, was 2.1 km long and has no lake at its terminus.  In 1997 the Mahsa Icefield has separated into an east and west half, at the red arrow, and has lost all of its snowcover.  The glacier in Sawmill Creek is still a single ice mass, but has lost all of its snowcover, which happened in 1998, 2003 and 2004. In 2014 the Mahsa Icefield’s east and west half are separated by 300 m, red arrow.  There is very little snowcover remaining despite there is a month left in the melt season.  At the headwaters of Sawmill Creek a lake has formed as the glacier has retreated, the lake is 600 m long in 2014.  The glacier has also separated into a small upper and lower section.  This glacier has lost half of its area since 1986.  The retreat of these glaciers on Baranof Island is similar to the retreat of nearby Carbon Lake Glacier,Lemon Creek Glacier, and Sinclair Glacier. Lemon Creek Glacier has lost more than 25 m of glacier thickness during the 1953-2014 period when its mass balance has been observed by the Juneau Icefield Research Program, and has retreated more than 1 km (Pelto et al, 2014).

mahsa icefield 1986

Landsat image 1986

mahsa icefield 1997

Landsat Image 1997

mahsa icefield 2014

Landsat image 2014


Carbon Lake Glacier Retreat, Alaska

On Baranof Island in southeast Alaska there are a pair of unnamed glaciers at the headwaters of the Carbon Lake watershed, that then drains into Chatham Strait.  Here we examine changes in these glacier from 1986 to 2014 using Landsat imagery.  The blue arrow indicates the northern glacier terminus and the yellow arrow the southern glacier terminus region.

carbon lake ge

In 1986 the southern glacier terminus, yellow arrow consisted of three main tributaries combining to form a low sloped terminus region.  The northern glacier had a single terminus.  By 1997 a lake has formed at the southern glacier, which now has two separate termini, the red arrow indicates a new terminus area and the pink arrow the eastern portion of this glacier.  The northern glacier, blue arrow, is retreating but still joined.  By 2014 the southern glacier has separated into three parts.  There is a terminus at the red arrow, this represents a 900 m retreat since 1986.  This portion of the glacier has further separated since 1997 into two parts.  The eastern glacier, pink arrow has retreated 700 m since 1986.  The new alpine lake is 600 m long.  The northern glacier, blue arrow, has separated into two main termini and the glacier has retreated 200 m.   The retreat of these glaciers paralells the observed losses of other smaller glacier in the region most notably Lemon Creek Glacier, which is a World Glacier Monitoring Service reference glacier, 30 km west on the edge of the Juneau Icefield.  Another nearby example is Sinclair Glacier.  Lemon Creek Glacier has lost more than 25 m of glacier thickness during the 1953-2014 period when its mass balance has been observed by the Juneau Icefield Research Program, and has retreated more than 1 km.

carbon lake 1986
1986 Landsat image Carbon Lake Glaciers
carbon lake 1997
1997 Landsat image Carbon Lake Glaciers
carbon lake 2014
2014 Landsat image of Carbon Glacier


Chickamin Glacier Retreat, North Cascade Range, Washington

Chickamin Glacier covers the north slope of Sinister Peak in the North Cascade Range of Washington.  The glacier has a valley tongue that descends to an outwash plain.  Here we examine retreat of the glacier from 1979 to 2012. The glacier had advanced from 1955-1975, before commencing retreat.

CHICKAMIN_GLACIER05
Chickamin Glacier (Tom Hammond)

chickamin map

USGS Map of Chickamin Glacier

In 1979 the glacier terminus was at the pink arrow, several hundred meters beyond a prominent buttress, red arrow, where the glacier turns west.  The lowest icefall is indicated by a green arrow. In 1991 the glacier has retreated from the pink arrow, but still is turning the corner beyond the buttress.  The lower icefall is still extensively crevassed.  By 1998 in a Google Earth image the terminus is outlined with yellow dots and has retreated 230 m from the 1979 position.  The lower icefall is still crevassed.  By 2005 in a photograph from Tom Hammond (North Cascades Conservation Council), the glacier has retreated to the buttress. in a 2006 Google Earth image the terminus position is indicated by yellow dots, with a retreat of 50 m since 1998.  The lower portion of the glacier has limited crevassing.  In the 2012 image the glacier terminus no longer reaches the buttress and has retreated 360 m since 1979. We observed exceptional ablation conditions in the North Cascades in 2013 and 2014, which combined with exceptionally low snowpack in 2015 will lead to a continued significant retreat of this glacier.  The crevassing in the lowest icefall has declined and is now superficial. All 47 glaciers observed by the North Cascade Glacier Climate Project have been retreating and four have disappeared (Pelto, 2011). This glacier is similar in size and retreat to Boston Glacier and Honeycomb Glacier.

chickamin79

Chickamin Glacier 1979 (Austin Post)chickamin glacier1991

1991 Chickamin Glacierchickamin 1998 geterminus

1998 Google Earth image

CHICKAMIN_GLACIER05

2005 Chickamin Glacier (Tom Hammond)chickamin 2006 geterminus

2006 Google Earth imagechickamin 2012 geterminus

2012 Google Earth Image

Eiriksjökull Retreat, Iceland

Eiriksjökull  is an ice cap just west of Langjökull In central Iceland.  Here we examine its main western outlet the Braekur using Landsat imagery from 1989 to 2014.  The Icelandic Glaciological Society website on terminus variations is the source of the map for the glacier. The IGS program monitors 50 glaciers, all of them are currently retreating.  Eiriksjökull ,  is not one that is in this monitoring program. eiriksjokull map

In 1989 the Braekur outlet flowed over the edge of a lava cliff at the red arrow.  The glacier terminated on the bench between the upper and lower cliff.  In 1994 the glacier still extended  to the edge of the cliff.  By 2010 the Google Earth images indicates a retreat from the edge of the cliff.  In 2014 the glacier has receded 200 m from the edge of the cliff and 300 m from is 1989 position and terminates at the yellow arrow. The high snowlines in recent years will lead to continued retreat. The retreat and area loss of Eiriksjökull is less than on nearby Norðurjökull a primary outlet of Langjökull or on Porisjokull a small ice cap just south of Langjökull.

eiriksjokull 1989

1989 Landsat image

eiriksjokull 1994

1994 Landsat image

eiriksjokull 2010

2010 Google Earth image

eiriksjokull 2014

2014 Landsat image

Eiriksjökull Reeat, Iceland

Eiriksjökull  is an ice cap just west of Langjökull In central Iceland.  Here we examine its main western outlet the Braekur using Landsat imagery from 1989 to 2014.  The Icelandic Glaciological Society website on terminus variations is the source of the map for the glacier. The IGS program monitors 50 glaciers, all of them are currently retreating.  Eiriksjökull ,  is not one that is in this monitoring program. eiriksjokull map

In 1989 the Braekur outlet flowed over the edge of a lava cliff at the red arrow.  The glacier terminated on the bench between the upper and lower cliff.  In 1994 the glacier still extended  to the edge of the cliff.  By 2010 the Google Earth images indicates a retreat from the edge of the cliff.  In 2014 the glacier has receded 200 m from the edge of the cliff and 300 m from is 1989 position and terminates at the yellow arrow. The high snowlines in recent years will lead to continued retreat. The retreat and area loss of Eiriksjökull is less than on nearby Norðurjökull a primary outlet of Langjökull or on Porisjokull a small ice cap just south of Langjökull.

eiriksjokull 1989

1989 Landsat image

eiriksjokull 1994

1994 Landsat image

eiriksjokull 2010

2010 Google Earth image

eiriksjokull 2014

2014 Landsat image

Weddel Glacier Thinning-Retreat, South Georgia Island

Weddel Glacier is on the southeast coast of South Georgia Island.  It terminates in Beaufoy Cove just north of Gold Harbor.The change in glacier terminus position has been documented by Alison Cook at British Antarctic Survey in a BAS retreat map.  In 1958 it reached within 400 m of the coast at the outlet of Beaufoy Cove. Gordon et al., (2008) observed that larger tidewater and sea-calving valley and outlet glaciers generally remained in relatively advanced positions until the 1980s. For Weddel Glacier the retreat was rapid from 1960 to 1974 and was slow from 1992-2003.  Here we examine Landsat imagery from 1989 to 2015 to visualize and update this change.
bertrab ge
Google Earth Image

weddell-bertrab map
BAS map of glacier terminus position

In 1989 the glacier terminates near the tip of a peninsula, red arrow in each image. The calving front extends southeast, orange dots. At the yellow arrow the glacier fills a small side valley adjacent to the main glacier. At the purple arrow is a small extension of the main icefall flowing down the bedrock step.
In 2002 there is only minor retreat at the red and yellow arrow, but thinning has led to the small extension of the main icefall being almost cutoff by bedrock. By 2015 the glacier has retreated 200-300 meters from the 1989 position and the main terminus is narrower. At the yellow arrow the side valley no longer has ice. At the purple arrow this is just bedrock now, there is no glacier extension flowing down the bedrock step. A close up the icefall in a 2009 Google Earth image indicates both the extensive crevassing but also the lack of glacier ice at the purple arrow, where an extension of the icefall formerly flowed. A Google Earth closeup of the terminus indicates that only a small section is still in contact with Beaufoy Cove in 2009, with land exposed at the orange arrows. This glacier is almost not tidewater and has terminated in shallow water since 1989, which helps explain a slower rate of retreat. The glacier has thinned more rapidly than it has retreated in the last 25 years. The retreat rate is less than nearby Bertrab Glacier, Konig Glacier and Neumayer Glacier on the same coast of South Georgia.

weddel glacier 1989

Landsat Image 1989

weddell glacier 2002

Landsat image 2002

weddel glacier 2015
Landsat image 2015

weddel icefall
Google Earth icefall image
weddel terminus
Google Earth 2009 image

Bertrab Glacier Retreat, South Georgia Island

Bertrab Glacier is on the east coast of South Georgia Island.  The change in glacier terminus position has been documented by Alison Cook at British Antarctic Survey in a BAS retreat map.  In 1958 it reached the coast in Gold Harbor. Gordon et al., (2008) observed that larger tidewater and sea-calving valley and outlet glaciers generally remained in relatively advanced positions until the 1980s. For Bertrab Glacier the retreat was minimal from 1958 to 1989. Since 1989 a whole new embayment has opened.  Here we examine Landsat imagery from 1989 to 2015 to visualize and update this change.

weddell-bertrab map

BAS Glacier Front map 1958-2007.

bertrab ge

Google Earth image

In 1989 the southern arm of the glacier extends to the shoreline of the barrier beach system in Gold harbor, Red arrow. The northern arm extends around to the edge of a very green region, suggesting well developed vegetation, hence no real retreat for sometime.  By 2002 a lake has formed at the northern arm terminus and it has retreated 400 m.  The southern arm has retreated across a new embayment ending near the yellow arrow, though the exact position is obscured by cloud.  In 2011 the southern terminus has retreated up a slope from the edge of the embayment, yellow arrow.  In 2015 there are no longer two arms to the glacier.  The glacier terminates near the edge of the new embayment. The retreat is 700 m on the northern arm and 1000 m for the southern end since 1989.  The glacier no longer reaches the water limiting calving.  The glacier also ends on moderate slope.  This should lead to a reduced retreat in the near future.  The 2015 picture is from Jan.15, so there is still two months left in the melt season. The retreat is similar to that of Ross Hindle Glacier , Konig Glacier and Neumayer Glacier on the same coast of South Georgia, and faster than for neighboring Weddel Glacier.  Like on Stephenson Glacier, Heard Island the new embayment does offer new potential habitat for penguins and seals.

bertrab glacier 1989

1989 Landsat image
bertrab glacier 2002

2002 Landsat image

bertrab glacier 2011

2011 Landsat image

bertrab glacier 2015

2015 landsat image

Southwest Brazeau Icefield Retreat, Alberta

The Brazeau Icefield straddles high peaks southeast of Jasper, Alberta.  The northern outlet glaciers drain into Maligne Lake and the southern outlet glaciers drain in to Brazeau Lake and the Brazeau River.  The Brazeau River flows into Brazeau Reservoir a 355 MW hydropower facility, before joining the Saskatchewan River. An inventory of glaciers in the Canadian Rockies indicate area loss of 15% from 1985 to 2005 (Bolch et al, 2010).  The more famous Columbia Icefield to the west has lost 23 % of its area from 1919-2009 with ice loss at a minimum during the 1970’s (Tennant and Menounos, 2013). Here we examine an unnamed outlet glacier at the southwest corner of the Brazeau Icefield from 1995 to 2014 using Landsat imagery.

brazeau Icefield map

In 1995 the glacier terminated at the red arrow and was 1900 m long, orange dots mark the upper boundary.  The glacier had limited retained snowpack in 1995.  The poor clarity is do to forest fire smoke in the region.  In 1998 the proglacial lake where the glacier terminates is much clearer, snowpack is again limited, but more extensive than in 1995.  In 2002 retreat is evident as the lake is expanding as the glacier retreats.  The glacier still ends in the lake and still has limited snowcover.  In 2013 the glacier has retreated completely from the lake and snowcover is again limited.  The lack of snowcover is persistent in the satellite images which are typically not from the end of the melt season, hence even more snowcover will be lost.  Lack of a significant persistent snowcover area indicates a glacier that will not survive (Pelto, 2010). In 2014 the area experienced considerable forest fires, which leads to poor image clarity.  The glacier terminus is now significantly separated from the lake and terminates at the yellow arrow.  The distance from the yellow to the red arrow represents a 350-400 m retreat in 20 years.  The glacier has lost 20% of its length in this period.  This retreat is similar to that of Fraser Glacier and more significant given the small size of the glacier than for Saskcatchewan Glacier

brazeau icefield 1995

1995 Landsat image

brazeau icefield 1998

1998 Landsat image

brazeau sw 2002

2002 Landsat image

braeau sw 2013

2013 Landsat image

brazeau sw 2014

2014 Landsat image

Crevasse Reduction and Retreat of Salisbury Snowfield-Almer Glacier, New Zealand

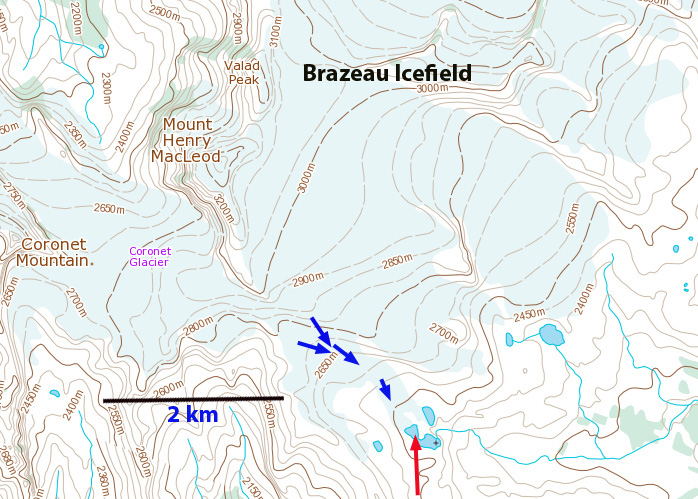
Almer Glacier is fed by the Salisbury Snowfield which also has its own terminus, and both are former tributaries to the Franz Josef Glacier.  In 2007 the Almer Glacier almost reconnected with Franz Josef Glacier.  The glaciers of the southern Alps have some of the highest recorded accumulation rates in their upper sections and highest ablation in the lower reaches. Anderson et al (2006), note accumulation rates exceeding 6 m on Franz Josef Glacier.  This combined with the steep slopes lead to higher velocity and extensive crevassing on even smaller alpine glaciers.  Purdie et al (2014)  examined modern and historic length change for Franz Josef and noted a ~ 3 km loss in length since the 1800s, with the greatest retreat from 1934 and 1983, despite two periods of advance in that 50 year period.  The retreat particularly since 1983 has been punctuated by advances 1983–1999 (1420 m) and 2004–2008 (280 m), with the current retreat up to 2014 being the fastest rate of retreat during the period of record. (Purdie et al , 2014). The annual end of summer snowline surveys by NIWA monitors the Salisbury Snowfield, the snowline was 140 m or more above the equilibrium altitude in 4 of the last six years and 20-30 m below the equilibrium line altitude in the other two.  The net result is significant mass loss in the last six years driven by exceptional melt, driving the retreat.

Salisbury snowfield

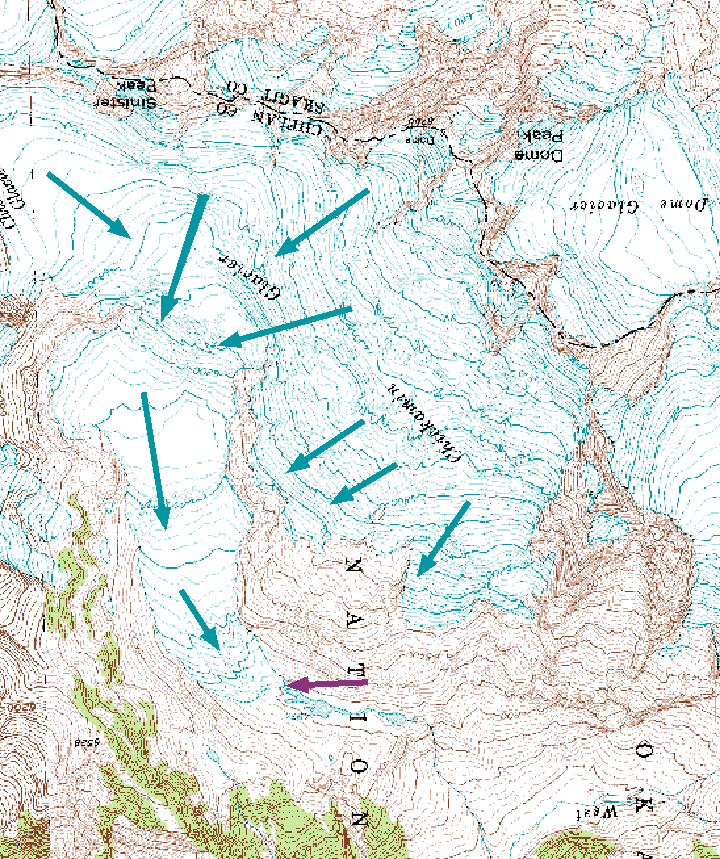
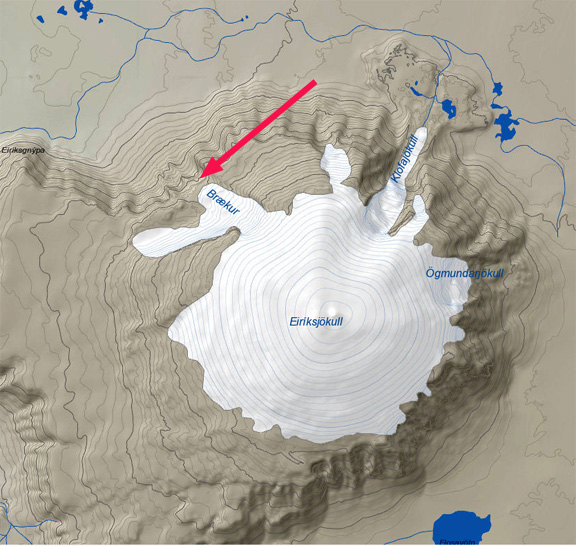
Topographic Map of Salisbury Snowfield-Almer Glacier area

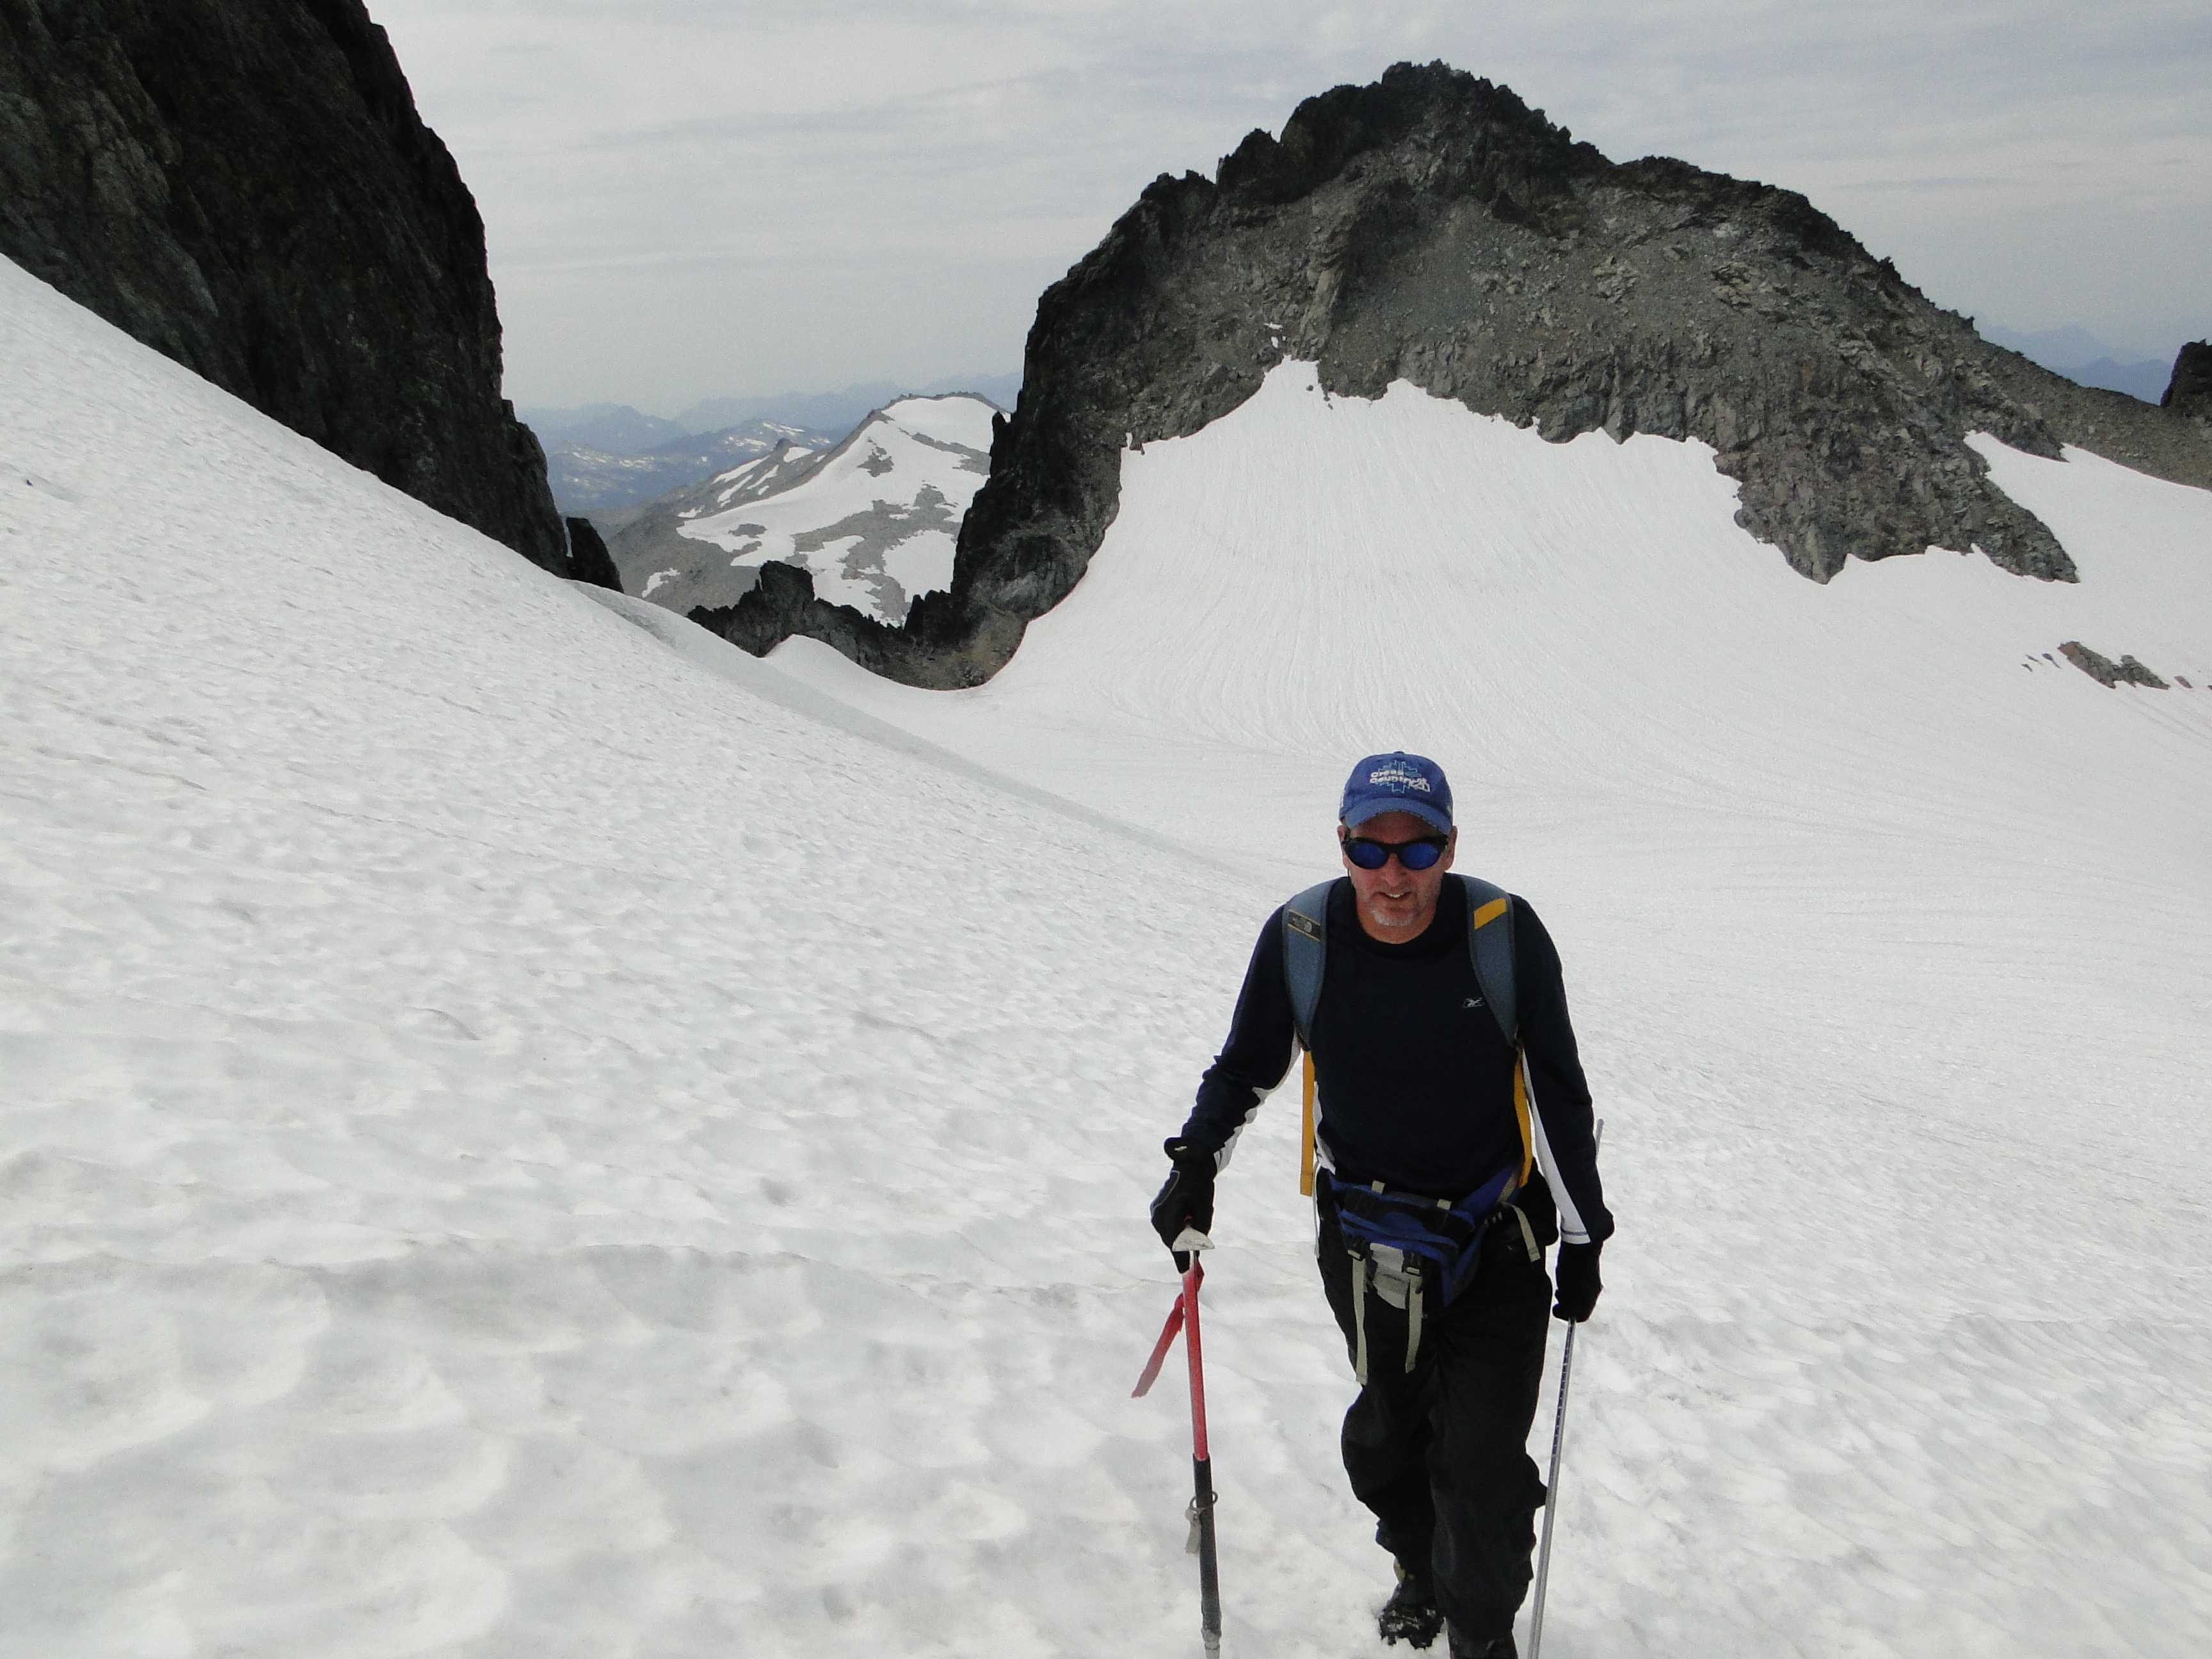
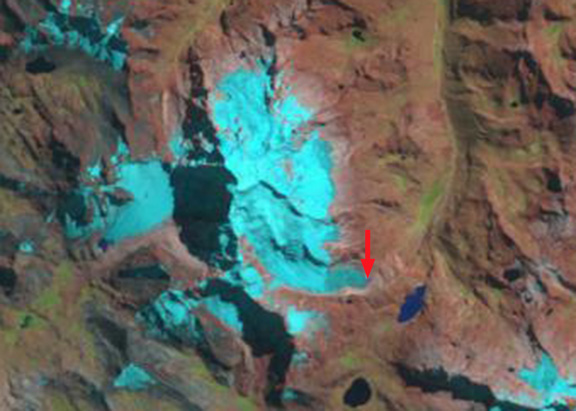
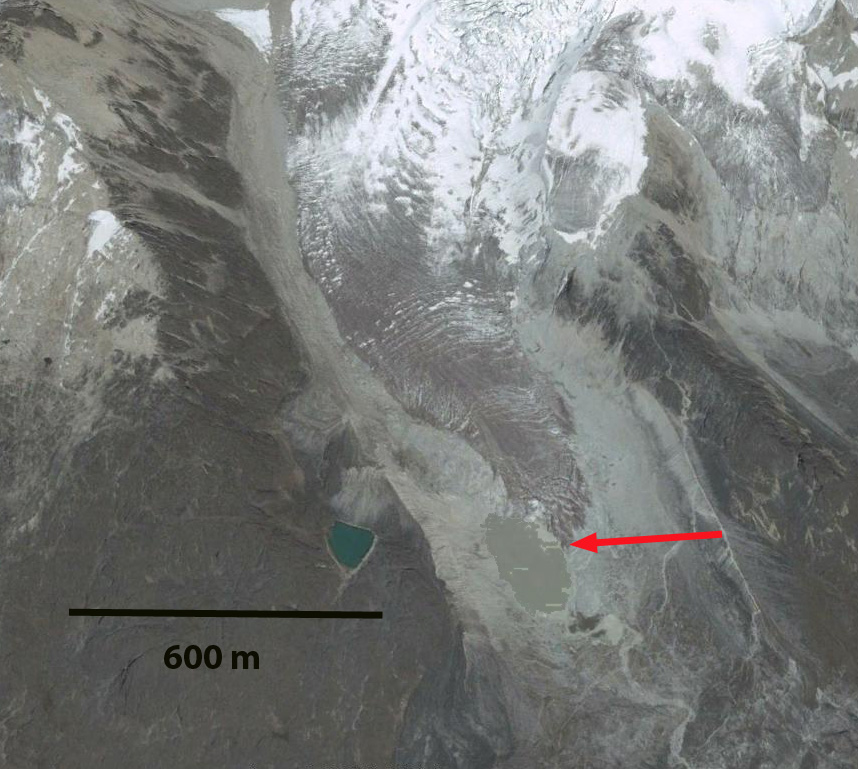
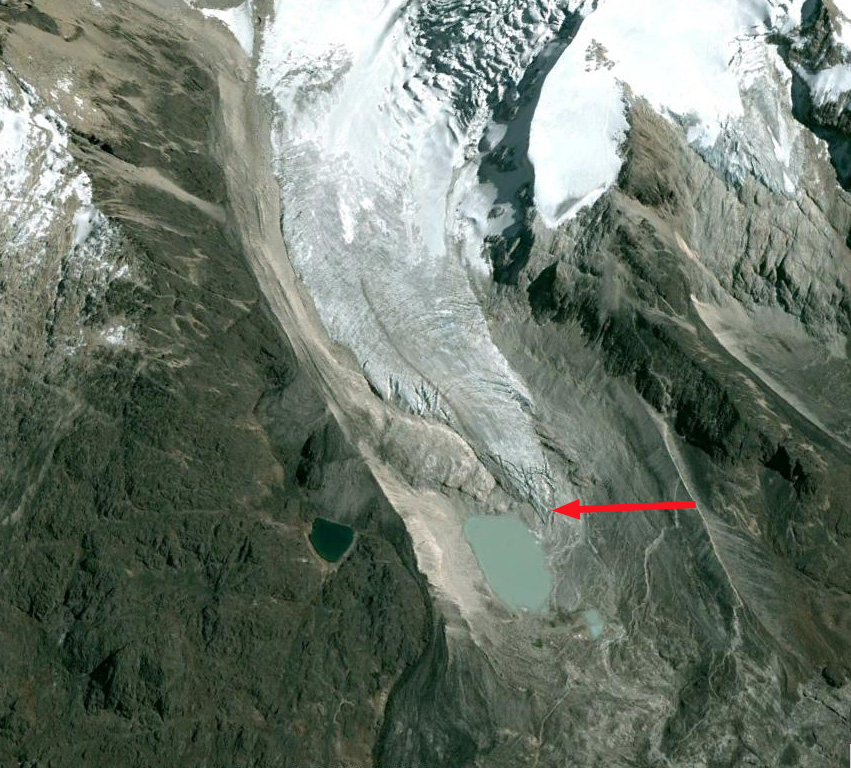
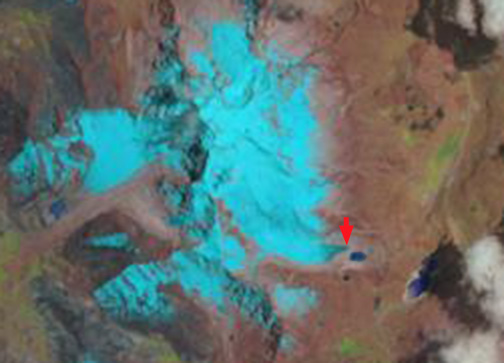
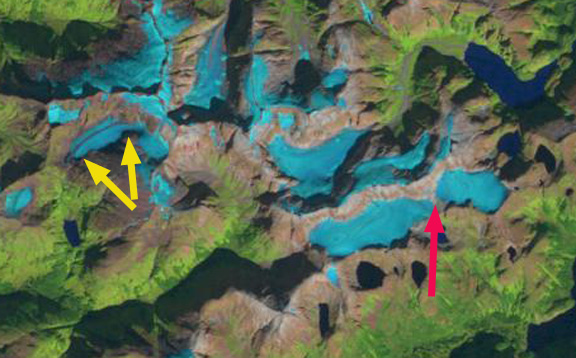
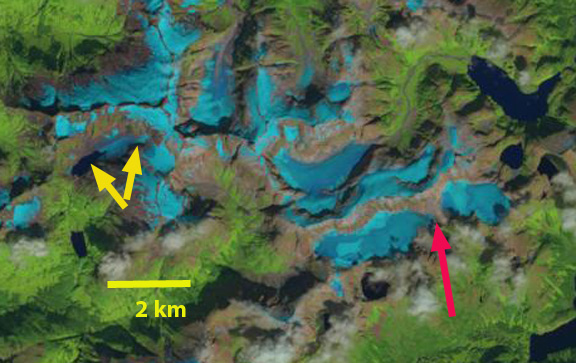
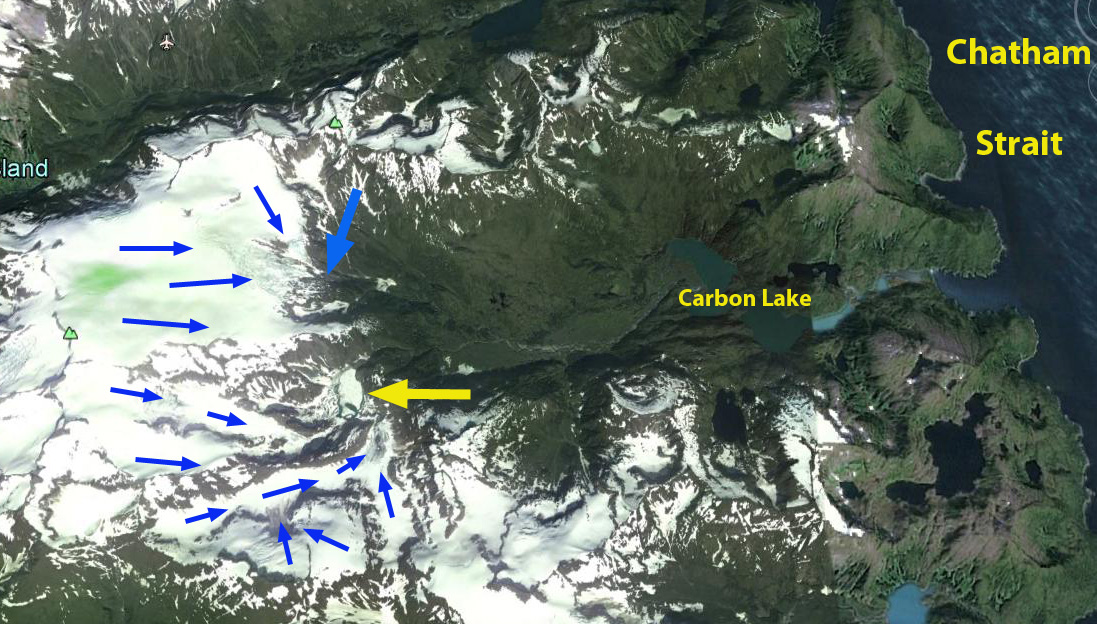
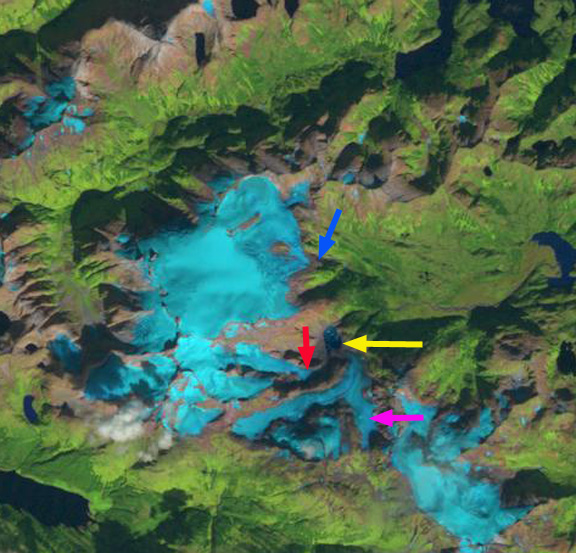
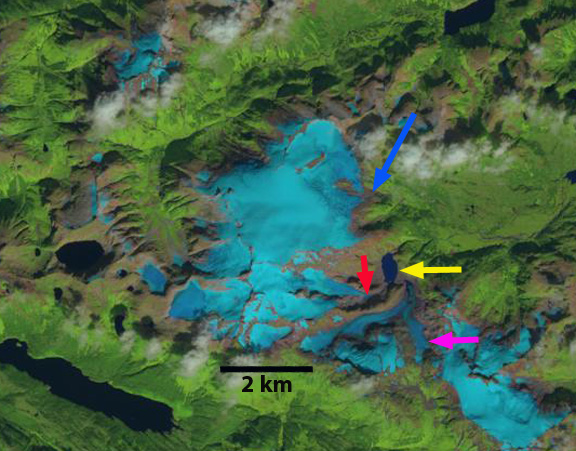
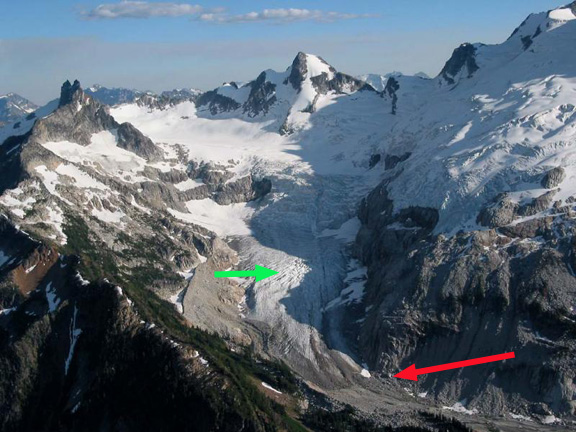
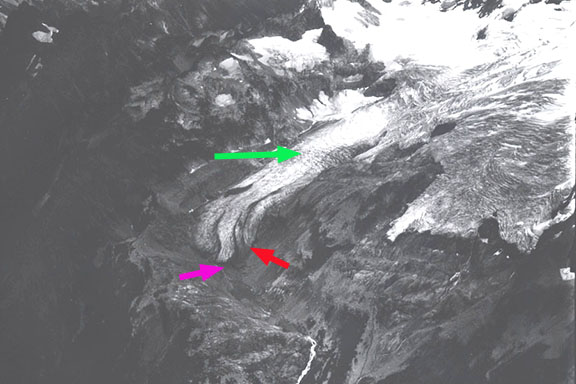
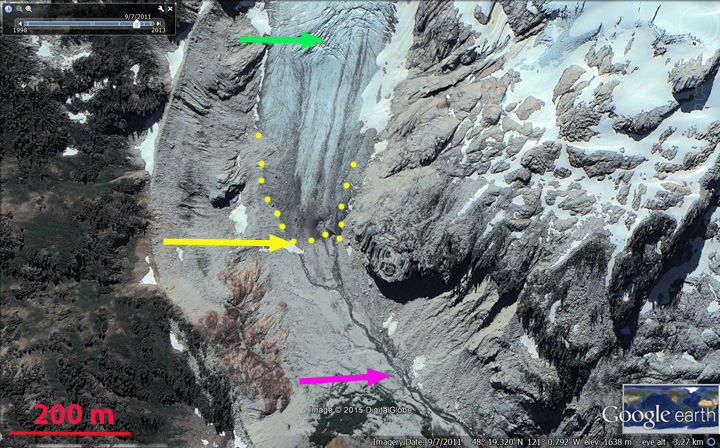
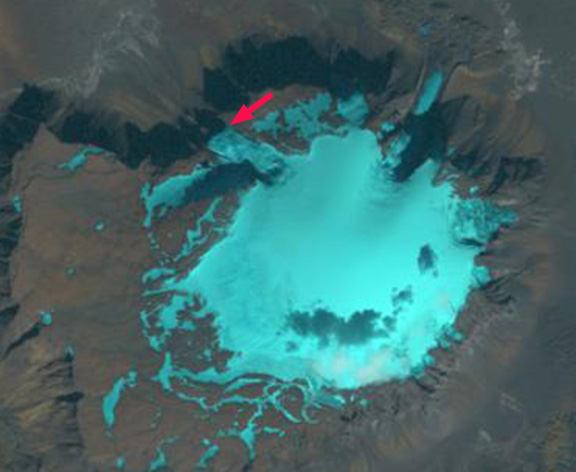
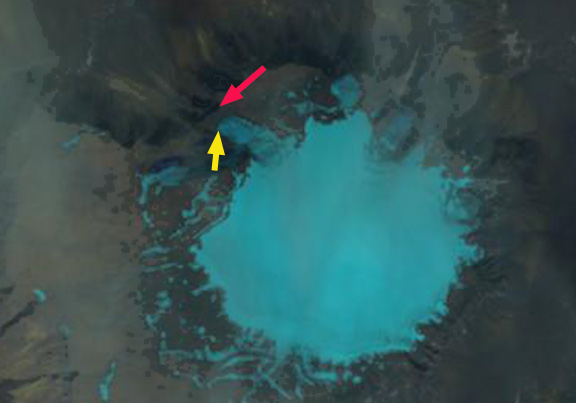
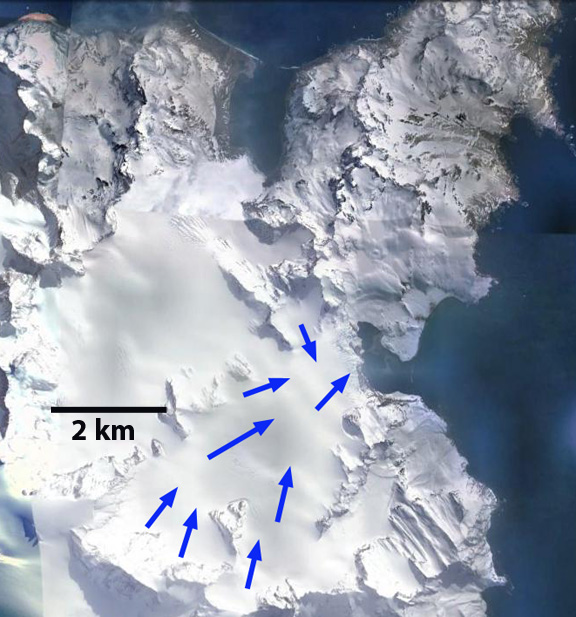
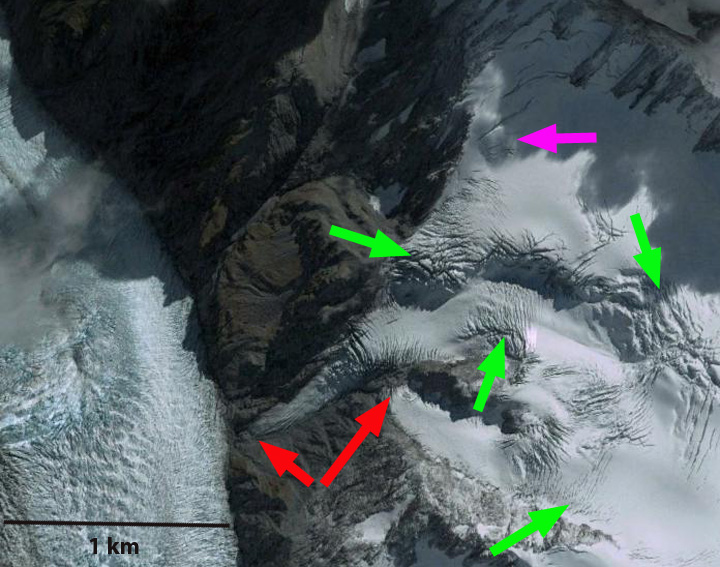
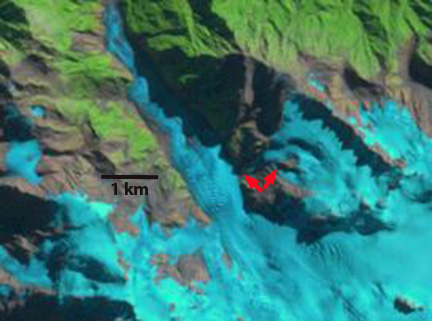
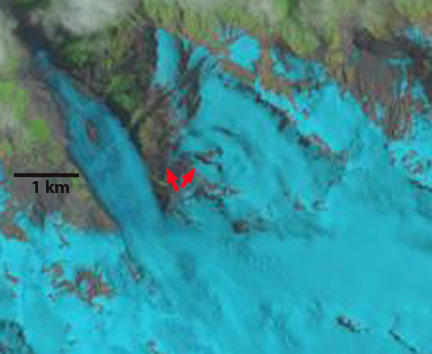
Here we examine changes particularly in crevassing as well as retreat of Salisbury Snowfield and Almer Glacier from 2000-2015. In the Google Earth images from 2007 and 2013 the green arrows indicate crevassed areas and the red arrows the terminus of the Almer Glacier above and Salisbury Snowfield below.  The decrease in the amount of crevassing is evident at each location.  This indicates not just a reduction in velocity, but in glacier thickness that is driving flow.  The thinning is evident with the emergence of a bedrock knob at the pink arrow in 2013 that had been covered by crevassed ice in 2007.  The red arrow indicates the terminus where the main Almer Glacier is within 75 m of the Franz Josef Glacier.  By  2013 the terminus is much dirtier and is 200 m from Franz Josef Glacier. The icefall comparison image from 2007 and 2013 indicates the reduction in width and number of open crevasses, probably in depth too. This is something Jill Pelto (UMaine) has been measuring crevasses in the field on Easton Glacier in the North Cascades over the last few years to see how crevasses are changing as a glacier thins and slows (image below).

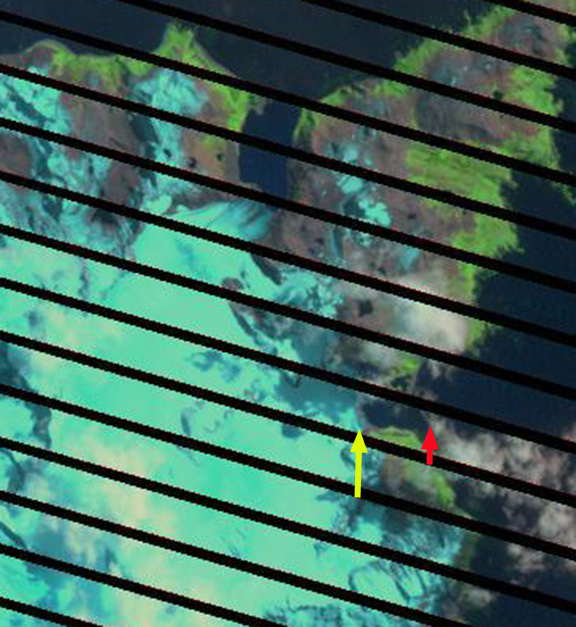
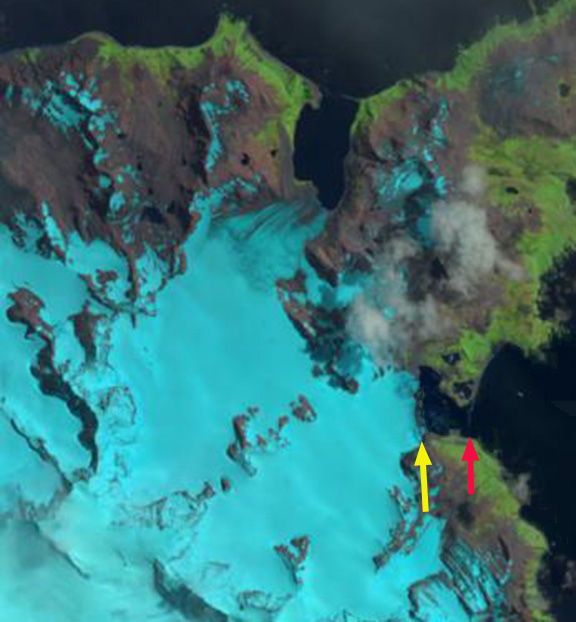
In 2014 New Zealand had a warm year and snowlines are high for early summer in January 2015 which will continue the retreat.  The Landsat image from January, 2015 suggests further retreat has occurred since 2013, but given the dirty terminus, it is to hard to determine a specific amount.  The retreat here follows the pattern of glaciers across the Southern Alps of New Zealand- Lyell Glacier and Tasman Glacier

salisbury 2007

2007 Google Earth image

salisbury 2013

2013 Google Earth Image.

salisbury icefall comparison

2007-2013 icefall closeup 

crevase depth
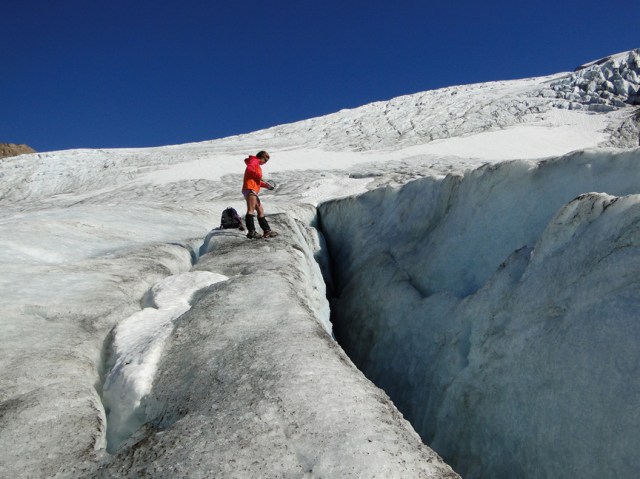
2015 Crevasse Assessment, Jill Pelto, North Cascades
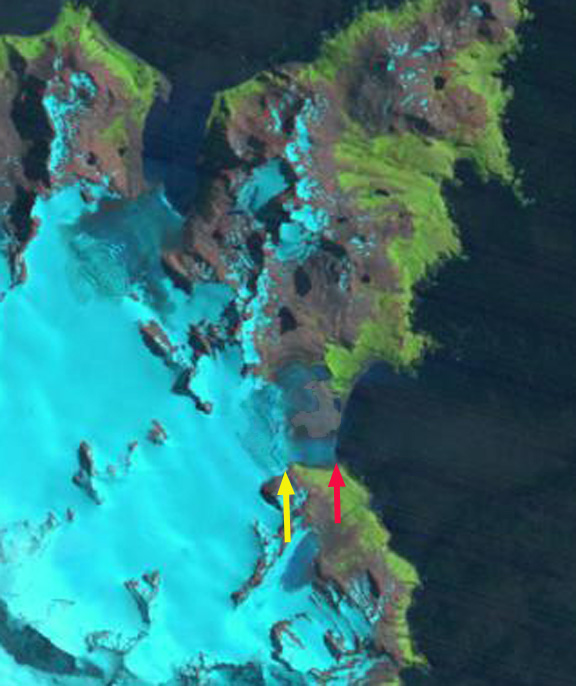
salisbury 2000


2000 Landsat image

salisbury 2015


2015 Landsat image