Thiel Glacier is a valley glacier in the Juneau icefield of Alaska. The glacier was a tributary of the Gilkey Glacier and is shown as such in USGS maps. From 1948-2005 the glacier has retreated 2100 meters from its former junction with the Gilkey Glacier. Below is the USGS map of the area showing the junction of the Battle, Gilkey and Thiel Glacier. The same view from the 2005 Google Earth imagery indicates the separation of the three glaciers and the emergence of a new deglaciated valley section. 
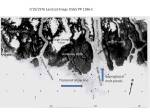
 In 1984 looking down at the glacier from its highest elevation, it was clear that the glacier had too small of an accumulation area to support the long, low elevation valley tongue of the glacier. From that vantage I could not see the terminus. The snowline at the end of the summer typically is at 4000-4500 feet at the end of the melt season, leaving only 45% of the glacier in the accumulation zone. For a glacier to be in equilibrium at least 60% of the glacier needs to be in the accumulation zone. The upper margin of the glacier is outlined in blue and the snowline indicated with blue arrows in the image below.
  The current glacier terminus is stagnant and the retreat is ongoing. At the terminus a close examination of the 2005 imagery forth indicates a series of concentric crevasses at the terminus. Such crevasses typically are the indicative of a collapse feature. Usually it is a subglacial lake that drains that had supported the terminus to some extent. Above this point the ice is stagnant lacking tranverse crevasses that would indicate movement. The surface of the glacier has a rough cross profile as a result without active movement to even out the profile. Areas of debris generally are prominent as the debris is insulating the ice underneath.
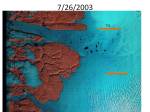
  The 2005 terminus is at 650 feet, compared to the same location in the USGS maps of 1500 feet. This nearly 900 feet of thinning is depicted by the surface wall overlay added to Google Earth, the top of this wall is at 1500 feet. In the foreground is the Gilkey Glacier which the Thiel formerly joined and the new deglaciated valley.
 This glacier will continue to retreat rapidly with the current climate much like the nearby Hoboe Glacier and Tulsequah Glacier and Lemon Glacier
Author: mspelto
Professor of Environmental Science at Nichols College in Massachusetts since 1989. Glaciologist directing the North Cascade Glacier Climate Project since 1984. This project monitors the mass balance and behavior of more glaciers than any other in North America
Methods for assessing and forecasting the survival of North Cascade, Washington glaciers
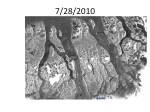
This paper was just published, Methods for assessing and forecasting the survival of North Cascade, Washington glaciers. It represents the third in a series of papers that looks at methods to identify when an alpine glacier will not survive. The first paper was using the change in thickness along a profile up the center of the glacier. Glaciers that were thinning appreciably and similarly along their entire length were determined to be in disequilibrium and would not survive. The second paper looked at glaciers that experienced thinning in the accumulation zone as distinguished by emergence of bedrock outcrops, marginal recession in the accumulation zone and overall accumulation zone thinning. Glaciers that were thinning in the accumulation zone were forecast to not survive. In this paper the model is expanded to look at the percentage of a glacier that is snowcovered at the end of the melt season. This is the accumulation area ratio. Typically a glacier needs to be 60% snowcovered or more at the end of the melt season to have an equilibrium balance. If the glacier has an AAR of less than 30% frequently, those glacier have been noted as thinning appreciably in the accumulation zone and will not survive. To survive a glacier must of course have a persistent accumulation area, as snow is the income of the glacier. A glacier that lacks such a zone, then has only a melt zone-ablation zone, and only liabilities and will go out of business. Lets look at three glaciers that exemplify this issue. The first and third are forecast not to survive current climate, the middle glacier will. The first is Lynch Glacier the pictures are from 1960 and 2007, in the upper left of the glacier-the accumulation zone, you can note the emergence of bedrock outcrops, Point B. This indicates that snowcover is not persisting and this has become a melt zone even though it is near the head of the glacier. The second is Easton Glacier. This glacier descends the south side of Mount Baker. Even in the years with the poorest snowcover, such as 2009 the glacier remains snowcovered to the end of the summer over the upper third of the glacier. This image is from mid-Sept. 2009, mid-Sept. 2010 was a much better year.
 The last glacier is Foss Glacier which shows considerable shrinkage in the upper reaches of the glacier, what should be the accumulation zone, here the glacier is seen in 1985 and 2005.
  .
. 
 Also notice the lack of an accumulation zone in 2005. This was the case that summer on Columbia Glacier (above) and Ice Worm Glacier (below) as well. 2003, 2004 and 2009 were other years in which accumulation was not retained on many North Cascade WA glaciers. The picture of Ice Worm Glacier contrasts the glacier from 2005 to 2009. The picture indicates more retreat at the top of the glacier at Point A.
Castle Creek Glacier, BC annual retreat recorded
Castle Creek Glacier is in the Cariboo Mts. of British Columbia. The glacier descends north-northeast for 6.3 km from 2825 meters to the terminus at 1,810 meters. During the last 50 years of retreat has left a series of annual terminal recessional moraines that indicate how much the glacier has retreated each year. The glacier has a remarkably uniform and relatively low slope for an alpine glacier. This is one feature that helps ensure that the retreat rate changes little from year to year as the glacier flow dynamics are consistent. There is no prominent icefall, there is no low slope terminus tongue that can stagnate. The extent of the glacier during the Little Ice Age is quite evident as the gray vegetation free zone. 
 Castle Creek Glacier has receded every years since 1959 at total of 720 meters up to 2008, about 14 meters per year. The Universtiy of Northern Brictish Columbia as part of the Western Canadian Cryosphere Network has undertaken a detailed investigation of this glacier. Matt Beedle at UNBC has been the field leader for the project, and has had the chance to map and identify the annual recessional moraines. The three pictures below are from Matt Beedle. The first is a series of aerial photographs that have been cropped to show the same area. Note that in 1946 the glacier filled the view, by 2005 it barely makes the image. The period from 1971 to 1991 has the most notable recessional moraine ridges. Beyond the 1967 margin there are at least 10 moraine ridges
The recessional terminal moraines are not unusual features to be formed by a retreating glacier, however they are unusual to be formed each year and to be so well preserved. The recessional moraines are deposited on a till plain exposed by the glacier retreat. Often such moraines are ice cored and tend to disappear as the ice core melt outs, not the case here. The moraines form during the winter when the glacier continues to move and the terminus is not melting. In summer after the terminus area is exposed the terminus melts back. The Key as pointed out by Matt Beedle is summer temperature. Such moraines will not form on a glacier with a stagnant glacier tongue. Such moraines also do not form on glaciers that have a terminus area that is an avalanche runout zone that can bury the terminus some years.

The glacier fits the pattern of glaciers throughout the southern interior ranges of BritishColumbia and Alberta which Blch et al (2010) noted lost 11% and 25% of their area over the period 1985–2005 respectively.
Seco Glacier Retreat in Southern Patagonia, Argentina
Seco Glacier descends magnificently towards Lago Argentina and is a site enjoyed by many visitors to the region from boats.  A new website is being developed on the Glaciers of Argentina that features this view. The glacier has retreated 1050 meters in the last century exposing a still barren rock landscape. The terminus is still heavily crevassed indicating considerable movement at the tongue. The recently deglaciated terrain that extends one kilometer beyond the terminus abruptly ends in forest.
  A series of photographs from the Glaciers of Argentina indicate the retreat of this glacier from 1953 to 2009. Also note the development of vegetation around the precipitation gage. The rate of development of vegetation on newly deglaciated terrain is the ecesis rate. In a wet temperate climate such as this with seed sources simply uphill of the deglaciated terrain on the valley walls usually leads to incipient trees developing within 20 years of deglaciation.
  . The glacier front is still actively crevassed, indicating considerable flow, this is not a stagnant rapidly melting glacier tongue. The glacier ends at 450 meters, its top elevation is at 2300 meters. The snowline is at 1300 meters. In the images from 1953 to 2009 there is a rock outcrop in the upper right near the snowline that has expanded relatively little. This indicates that the accumulation zone at this elevation and above is maintaining its thickness.
 . This is a glacier that is retreating due to regional warming, but it not a glacier that is in danger of disappearing with current climate.
Midtdalsbreen Glacier, Norway retreat Continues in 2010
The Norwegian Water Resources and Energy Directorate is the most extensive national glacier monitoring program in the world. They noted in 2010 that 27 of 31 glaciers monitored retreated. Midtdalsbreen near Finse drains the eastern portion of the Hardangerjøkulen (Hardanger ice Cap).  This glacier retreated 34 meters from 2009 to 2010 and has retreated 143 meters in the last 10 years. This retreat is less than the retreat of Rembesdalsskaka Glacier which drains west from the Hardangerjokulen and has retreated 311 meters in the last decade. The 2010 Image below indicates the area beyond the terminus that is quite fresh and lacks any new vegetation as yet, the small hillocks and ridges are ice cored. The debris has not stabilized yet. The terminus is quite lacking in crevasses and the slope modest, suggesting the retreat will be ongoing.
  Beyond the current margin are a series of low moraines some of them forming annually with no retreat from October-May and then summer retreat.
  Moraines like this tend to be ice cored when formed and are prominent. The moraine is really a 20-50 cm or debris overlying a core of dirty ice. Once this ice melts years later the once obvious moraines are hardly noticeable. The terminus of the glacier is well defined. The upper section of the glacier that drains the ice cap lacks clear margins. The ice cap generally does retain snowpack throughout the summer season, continuing to feed the glacier outlets. The reduction in the area and depth of this seasonal snowpack by summers end leads to less outflow from the ice cap through the outlet glaciers and hence terminus retreat.
Glacier Retreat creates Amsler Island Palmer Station Antactica
In mountain ranges around the world glacier retreat is leading to the formation of new lakes. In the Antarctic and Greenland retreat is leading to the formation of some new islands. Palmer Station on Anvers Island just off the Antarctic Peninsula is largely surrounded by glaciers. It has been called ground zero for climate change. Hard to argue, except I have seen that term applied to many other locations, that are also hard to argue with. To the north of the base a new island formed in 2004. Amsler Island was named in 2007, it used to be just part of Norsel Point. Below is a 1999 image and a 2004 image from Google Earth. 
 The channel now connects Arthur Harbor to Loudwater. The channel is now over 200 meters wide. The ice front is quite heavily crevassed. The crevasses indicate a terminus ice cliff that is not currently in a stable position and additional calving should lead to continued channel expansion. There are still a couple of small ice patches on Amsler.
  This change lacks the magnitude of those seen on Fleming Glacier.
Llaca Glacier Retreat, Peru
The Cordillera Blanca, Peru has 27 peaks over 6,000m, over 600 glaciers and is the highest tropical mountain range in the world. Glaciers are a key water resource from May-September in the region, Mark (2008). The glaciers in this range have been retreating extensively from 1970-2003, GLIMS identified a 22% reduction in glacier volume in the Cordillera Blanca. Vuille (2008) noted that the retreat rate has increased from 7-9 meters per year in the 1970’s to 20 meters per year since 1990. One of the glaciers that is continuing to recede is Llaca Glacier descending the west slopes of Ranralpaca. This glacier has retreated 1700 m from its Little Ice Age moraine, outlined in lime green. Llaca Laguna is impounded by this moraine. The glacier still has a significant consistent accumulation zone and can survive current climate.
  Stagnant pockets of debris covered ice no long connected to the glacier fill much of the valley between the laguna and the current glacier. The terminus despite ending on a steep slope lacks significant crevassing indicating a lack of vigorous flow which will lead to continued retreat of 20-30 meters per year.
  This glacier drains into the river which then flows into the Rio Santa in Huarez, Peru. Mark (2008)note the importance of glaciers to the Cordillera Blanca watersheds in the Huarez region receive 35% of their runoff from glaciers, and the upper Rio Santa likely receives 40%.
Banded Glacier a new alpine lake
The Banded Glacier on Mount Logan in the North Cascades of Washington has retreated since 1960 creating a new alpine lake. The glacier has retreated 450 m in from 1960 to the 2006 satellite image expanding the proglacial alpine lake. This glacier is retreating as are all North Cascade glaciers. The 1960 image is from Austin Post (USGS). The 2006 image has a blue dotted line at the 1960 terminus. Note the spread of rock outcrops in the accumulation zone suggesting this glacier will have trouble surviving, a blue arrow indicates the new rock outcrops..The glacier has lost 40% of its area in this 46 year period. The north side (left side in the image) is very short at this point. The new lake has a number of icebergs in it. The number of crevasses has also diminished as the glacier has thinned, become shorter and as a result moves slower. The images below are from 1960, 1998, 2006 and 2009. The retreat from 1998-2009 is 270 meters.


 The slower movement is despite an increase in surface slope as the glacier has retreated from the flatter lake basin area onto the slopes leading to the summit of Mount Logan. This glacier is difficult to view unless you are right in the basin where it is. In 2005 and 2009 this glacier lost almost all of its snowcover, not a good sign for a glacier to survive.
North Cascade Glacier Mass Balance 2010
 A glacier has no memory of the past year when it comes to mass balance, unlike say the extent of sea ice, it is more like the extent of snowcover. This was emphasized by a comparison of glacier mass balance in the North Cascades from 2009 to 2010. Temperature sensitivity is also highest during the summer for a glacier and for snowcover in general. As the melt season begins the snow cover extent is large on a glacier-100% for North Cascade glaciers. The key is how rapidly the snow line rises during the melt season. For continental scale snowcover it is more of a recession northward. In the Northern Hemisphere for example February 2010 was the third most extensive snow cover extent of the last 44 years, March the 18th of the last 44 years, and April the 41st most of the last 44 years, in the Northern Hemisphere and the 44th most extensive in North America. (Rutgers University Global Snow Lab). This change indicates a record snow cover melt off in 2010 for the last 44 years. This was not surprising given that global temperatures anomalies were also at there highest levels during this period. This can happen on a glacier as well.
 For North America the main change with global warming is the decrease in melt season snow cover extent as noted in the image below, which shows red for well below average snowpack, and dark blue well above average snowpack. Note the dark blue nature of summer in the 1970’s and the dark red in the summers after 2003. t is during the summer when temperature alone is the key, not storm tracks and jet stream position.
  . For the North Cascades the summer melt season of 2009 was the record, not 2010. North Cascade glaciers over the 27 years I have been monitoring them. I
For the North Cascades In 2009 a negative PDO (Pacific Decadal Oscillation) and negative ENSO (La Nina) existed leading to below normal temperatures and average precipitation during the winter in the Pacific Northwest. The combination of a negative PDO and a negative or equilibrium La Nina has led to an equilibrium or positive glacier mass balance in the North Cascades, WA in 13 of 16 years since 1960. The summer of 2009 had the highest total ablation recorded during annual mass balance measurements since 1984, offsetting good winter snowpack and leading to a mean negative mass balance of -1.9 m. In 2010 a positive PDO and ENSO (El Nino) conditions persisted during the winter leading to above normal temperatures and average precipitation in the Pacific Northwest. The combination of a positive PDO and El Nino has led to negative glacier balance in all 14 years this has occurred since 1960. A markedly cool 2010 melt season led to near minimum ablation since 1984, and an equilibrium mean annual balance of 0.05 m. Ablation season conditions dominated the mass balance record for both years. In 2009 there was a transition from a La Nina to an El Nino accompanied by a change to a postiive PDO. In 2010 a change from an El Nino to a La Nina and to a negative PDO. We will be exploring the impact of coastal upwelling strength, upwelling onset, PDO, ENSO and the Pacific Transition for these two unusual summer seasons. In 2009 a high pressure ridge was centered over the West Coast, upwelling began early and there was limited marine influence along the coast. In 2010 an anomalous high pressure center in the eastern North Pacific generated northerly winds along the West Coast and a late onset of upwelling. Our goal is to be able to forecast the summer melt season conditions sometime in May. A comparison of the mass balance maps for Columbia Glacier in 2009 and 2010 illustrates the difference
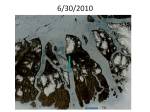
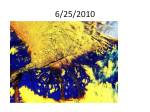
 The lines are contours of mass balance ochre is the zero balance line as of August 1, then brown-red 1 m of snowpack, blue, two meters and green three meters, than lime green is the end of summer snow line. Note that as of Aug. 1 both years had nearly identical snowpack, but ablation was much higher due to record warmth in August 2009, and the snowline ended much higher than in 2010. The result despite less winter snowpack, a more positive though still negative mass balance for Columbia Glacier in 2010. In the summer of 2010 we measured the snow depth and/or snow melt at 180 locations on this glacier. The Columbia Glacier is a low elevation glacier mostly below 5200 feet. It is also avalanche fed. Both factors led to abnormally low snow accumulation in the winter of 2010, and despite the cool summer a negative balance. Easton Glacier on Mount Baker on the other hand is mostly above 6000 feet, and does not receive avalanche accumulation. The winter snowpack was close to normal and then below normal melting led to a positive mass balance. The glacier gained an average thickness of 0.7 meters. This is small compared to the loss of 2 meters.
Glacier Nef Retreat, Rio Baker, Chile
Glacier retreat and thinning is particularly strong in the Patagonian icefields of South America. The two largest temperate ice bodies of the Southern Hemisphere are the Northern Patagonia Icefield (CHN image below) 4,000 km2 and the Southern Patagonia Icefield (CHS), 13,000 km2.  It has been estimated that the wastage of the two icefields from 1995–2000 has contributed to sea level rise by 0.105 ± 0.011 mm year,which is double the ice loss calculated for 1975-2000 (Rignot et al. 2003).Nearly 90% of the glaciers studied are affected. Of the 72 glaciers surveyed in the region 63 have retreated significantly, only eight have remained stable and one advanced. O’Higgins Glacier, which feeds the Pascua River has retreated 11.6 km, IRD, 2010. Baker River (Rio Baker) is located to the east of the Northern Patagonia Icefield and is fed mainly by glacier melt water originating from the eastern outlet glaciers of the iecefield Leones, Soler, Nef, Colonia. Rio Baker is the most important Chilean river in terms of runoff, with an annual mean discharge of about 1000 m3/s . Glacier Nef is one of the main glaciers feeding Rio Baker. Rio Baker is a critical hydropower resource for Chile. Hidroaysen Project is proposing 5 dams on the Baker and Pascua River generating 2750 MW of power. Glacier Nef retreated 3400 m from 1945-2000, 2400 m retreat of the retreat occurred in the 1994 collapse of the terminus tongue into the proglacial lake, which is now 3.5 km long as seen in the image from Pierre Chevallier IRD.
  The glacier has an area of 164 km2 the proglacial lake began to from after 1945, but was less than 1 km long until after 1994. The glacier had primarily been thinning in height and width near the terminus from 1945-1994
(Aniya, 1986 ) and Winchester, et al. (2010). Below is a map of the hydropower project, from Hidroaysen Project .  Today Glacier Nef has not reached the head of this proglacial lake and will continue to retreat. The west side of the terminus is debris covered and has a fringing proglacial lake. The lack of elevation change and the isolated proglacial lake here suggests the lake will expand laterally as well as length wise. The retreat follows the pattern of enhanced calving in a proglacial lake for NPI glaciers such as , Gualas GlacierReichert Glacier, Steffen Glacier, and Colonia Glacier. The retreat via calving due to a thinning terminus tongue is similar to the case on Gilkey Glacier, Alaska, Tasman Glacier, New Zealand and Triftglestcher, Austria. The visible trimline indicates the thinning. The lack of vegetation indicates the recent nature of the retreat from this lateral trimline.
 The glaciers feeding Rio Baker remain quite large and will remain a large meltwater source for the forseeable future. The majority of Glacier Nef is above the recent equilibrium line altitude of 1200 m. The section of the Rio Baker below is where one of the dams will go.
Stephenson Glacier retreat, Heard Island
The Australian Antarctic Division manages Heard Island Island and has undertaken a project documenting changes in the environment on the island. One aspect noted has been the change in glaciers. The Allison, Brown and Stephenson Glacier have all retreated substantially since 1947 when the first good maps of their terminus are available. Fourteen Men by Arthur Scholes (1952) documents a year spent by fourteen men of the Australian National Antarctic Research Expedition. Their visit to the glacier noted that they could not skirt past the glacier along the coast. After crossing Stephenson Glacier they visited an old seal camp and counted 16,000 seals in the area Ensuing mapping and aerial photography has enabled a sequence of glacier boundary maps to be created that illustrate the changes in the glaciers. Thost and Truffer (2008) noted a 29% reduction in area of the Brown Glacier from 1947-2003. They also observed that the volcano Big Ben that the glaciers all drain from has shown no sign of changing geothermal output to cause the melting and that a 1 C warming has occurred over the same time period. Stephenson Glacier extends 8-9km down the eastern side of Big Ben. it 1947 it spread out into a piedmont lobe that was 3 km wide and extended to the ocean in two separate lobes around Elephant Spit. A picture from the Australian Antarctic Division taken in 1947 shows the glacier reaching the ocean and then in 2004 from the same location. 
 around then broadens to form a piedmont lobe up to -3 km wideKiernan and McConnell (2002) an order of magnitude increase in the rate of ice loss from Stephenson Glacier after 1987. Retreat from the late 19th century to 1955 had been limited.
  As Kiernan and McConnell observed retreat began to increased and by 1971 the glacier had retreated 1 km from the south coast and several hundred meters from the northern side of the spit. This retreat by 1980 caused the formation of Stephenson Lagoon and by 1987 Doppler Lagoon had formed as well. After 1997 the two lagoons have joined as Stephenson Glacier has retreated rapidly. The terminus is now 2.2 km from the south coast and 3.1 km from the north coast. The highly crevassed area above the terminus indicates the rapid ongoing flow of the glacier. The terminus is highly fractured in Google Earth Imagery indicating this section will continue to retreat via calving of icebergs into the lagoon, which is quite full as it is. The first image below shows the terminus location over the last 60 years from the Australian Antarctic Division. The second image are the AAD overlays that can be imported into Google Earth. The last image is a closeup of the still disintegrating terminus into the combined lagoons from 2008.

 The Stephenson Glacier is undergoing a rapid calving retreat that began due to ongoing mass balance loss. This mass balance loss is shared by the other glaciers on the island are observations, though the actual terminus retreat may be less the volume losses of Brown Glacier recently have been large.
Ryder Glacier, Northern Greenland Transient snowline rise
Ryder Glacier drains from the northern margin of the Greenland Ice Sheet into Sherard Osborn Fjord. The glacier was first surveyed by Lauge Koch in 1917. By 1956 the glacier had lost 75% of its floating tongue. Since 1990 the glacier front has advanced slightly with much of this change beginning in a mini-surge in 1995. As noted in the Arctic Report Card 2010 since 2000, the net area change of the 35 widest marine-terminating glaciers is -1535 km2. This is an effective average glacier length change of -1.7 km since year 2000. While the overall area change indicates the largest observed retreat, 7 of 35 glaciers did advance in 2010 relative to 2009. The largest glacier advances were at Ryder and Storstrømmen glacier, each advancing 4.6 and 4.2 km2, respectively.The shelf front of Ryder Gletscher advanced has advanced recently at about the
rate of flow, but it is thin <200 m and fractured in the floating region. This does not appear to be an advance driven by increased mass balance. In the last decade particularly since 2003 the transient snowline observable in satellite images has in most years reached 1000 m. The floating tongue has to date managed to avoid the large losses on Petermann Glacier. Both glaciers have experienced enhanced surface melt, the key has been greater basal melt to date at Petermann Glacier. This is in contrast to the 800 m level reported in the Satellite image Atlas of Greenland. The transient snowline (TSL) on the outlet glaciers of the local ice caps provides a crucial measure of annual balance and the extent of significant melting on the Ice Sheet. The number of satellite images available has increased dramatically providing the capability for TSL identification daily if clouds permit using MODIS. MODIS, Landsat 7, NOAA Microwave imagery and ENVISAT images below indicate the transient snowline for the Ryder Glacier area. Note that many of images from late June indicate a TSL in the 1000 m range even early in the melt season. To the west of Ryder Glacier (R), Steensby Glacier (S) and sometime Petermann Glacier (P) are evident n the outlet glaciers of Steensby Gletscher and Ryder Gletscher, where
it reaches an altitude of approximately 800 m. Ryder Glacier’s TSL lies very close to the southern boundary of the processed images from the Danish Meteorological Institute. The first slide is the topgraphy of the Ryder Glacier near the TSL, the second is a 1976 satellite image from the USGS Greenland Satellite Image Atlas 1386-c. The rest are annotated images downloaded from DMI or from the USGS for the Landsat images which are false color images. The TSL tends to rise from 975 m to the east of the glacier outlet to 1100 m south of and west of the fjord entrance.