
Recent observations indicate that the Fleming Glacier on the Antarctic Peninsula which used to feed the Wordie Ice Shelf is accelerating and thinning even faster(Wendt et al, 2010) This is leading to the production of numerous tabular icebergs from the glacier front as seen below from a 2009 Google Earth image.  . A is a rift that is also the ice front toward the upper right. B and C are rifts that will produce future tabular ice bergs. D is an iceberg with an area of just under 1 square kilometer. Wordie Ice Shelf was the northernmost large Ice shelf on the western AP. The ice shelf disintegrated between 1970 and 2000. From an area of 1900 km2 in 1970 to 100 km2 in 2009 as mapped by the British Antarctic Survey. The first image is from the BAS in 1989. Followed by a series of maps illustrating its demise put together by the BAS and USGS
 The breakup was suggested to have occurred due to a warming trend in the region that began in the 1970’s generating meltwater . There is also thinning and weakening around some of the pinning points where the ice shelf was grounded. This is similar to observations from Wilkins Ice Shelf.
The Wordie Ice Shelf was fed by several major tributary glaciers including the Fleming Glacier.
(Rignot and others (2005) used satellite radar interferometry to observe changes in behavior of Fleming Glacier from 1995 to 2004 identifying a 40-50% increase in glacier velocity from the terminus to 50 km above the terminus and a two meter per year thinning. More recent Airborne thickness data indicate thinning has increased to 3 or 4 m per year in the lower reach of the glacier during the 2004-2008 period (Wendt et al, 2010). Rignot and other (2005) further observed that 6.8 ± 0.3 km3/yr of ice, which is much larger than snow accumulation of 3.7 ± 0.8 km3/yr. This imbalance has certainly increased with acceleration.
Without the presence of a thick, slow moving ice shelf buttressing the Fleming Glacier it has accelerated. Below is a map from Wendt et al (2010) showing the Fleming Glacier former margins. Below that is Google Earth Image showing the nature of the calving front. Notice the tabular ice bergs that have and are about to break off. Below that is an image further up glacier, a nunatak has appeared in mid glacier that is not evident in the 1989 image. 

 As observed for the Jakobshavn and Pine Island Glacier thinning leads to reduced buttressing and increased glacier flow.
Author: mspelto
Professor of Environmental Science at Nichols College in Massachusetts since 1989. Glaciologist directing the North Cascade Glacier Climate Project since 1984. This project monitors the mass balance and behavior of more glaciers than any other in North America
North Cascade Glacier 2010 Mass Balance Forecast
Beginning in 2006 the North Cascade Glacier Climate Project began to forecast glacier mass balance from atmospheric circulation index data. To be useful for water resource managers such a forecast must be made early in the spring. This is when snowpack begins melting at elevations below the glaciers and reservoirs can begin to be recharged. A first generation forecasting model that relied on October-March Pacific Decadal Oscillation and El Nino Southern Oscillation Index values was developed. The mass balance forecast method reliably determined if the mass balance of North Cascade glaciers would be negative, equilibrium or positive in 22 of the last 26 years. Most people may be under the impression that the snowmelt season is well underway, in fact 2010 has seen a record loss of snowpack extent through March this year in North America. A look at the snow cover depletion using data from the Rutgers Global Snow Lab beginning in either the 7th, 8th or 9th week and ending with the 14th week indicates this record melt. In the second image the rapid snow cover loss is further apparent. In the Northern Hemisphere for example February 2010 was the third most extensive snow cover extent of the last 44 years, March the 18th of the last 44 years, and April the 41st most of the last 44 years (Rutgers University Global Snow Lab). This change indicates a record snow cover melt off in 2010 for the last 44 years. This can happen on a glacier as well.
 However, for glaciers the snowmelt season usually ends close to May 1. The melt season in the North Cascades is still not upon us. Typical maximum accumulation occurs around May 10.
  The best long term snowpack data is for April 1, hence that date is often used to evaluate the end of winter snowpack for snow measurement stations most of which are well below glacier elevations. This year snowpack on April 1 averaged 0.82 meters. There has been no year with positive mass balance and snowpack on April 1 below 1.0 meters.
  If we look solely at the indices both PDO and ENSO had positive values this winter. This is similar to the case in 1987, 1993, 1994, 1995, 1998, 2003, 2004,and 2005 all negative balance years.
  The rule for the model is that if PDO and ENSO are positive glacier mass balance will be negative. Both of the indices reflect sea surface temperature in the Pacific, and positive values favor warmer SST’s near the west coast. Lastly we have the temperature forecast from NOAA for spring which for the area shows a high degree of confidence for above normal temperatures from April-June.
  All of the above indicate glacier mass balance will be negative in the North Cascades this year even though the galciers are deeply buried in snow right now.
Harrison Glacier, Glacier National Park Slow Recession
There continues to be a persistent misconception that all glaciers in Glacier National Park will be gone by 2030, I get asked that by journalists frequently and when I point out that is not the case they are surprised. An examination of 15 Glacier National Park glaciers using the recently published Alpine Glacier Survival Forecast method, indicates that 10 of the 15 glaciers are experiencing a disequilibrium response and will disappear, the other five have been shrinking little. A simpler and more visual look at the survival issue, illustrates why though they all are diminishing the glaciers will not all be gone by 2030. Blackfoot and Harrison Glacier are the two largest glaciers and show minimal changes in the accumulation zone. Both glaciers continue to retreat with the main termini retreating approximately 100-120 m since 1966. In this post we take a close look at the Harrison Glacier the most vigorous and slowest receding of the few remaining Glacier National Park glaciers. Key and Fagre (2003) utilized a model to construct the future of glaciers in the Blackfoot-Jackson watershed, and determined that all would be gone by 2030 with continued substantial warming, but not with limited additional warming. Based on the slow recession and equilibrium response of Blackfoot and Harrison Glacier to recent climate over the last 40 years these two glaciers are not going to disappear within the next 30 years. Harrison Glacier has according to the ongoing work of Northern Rocky Mountain Science Center (NOROCK) Has lost 9% of its areas between 1966 and 2005, a 40 year period. In the first image below the glacier is outlined in the 1966 map of Harrison glacier overlaid in Google Earth. The orange outline is left on the following three images all from Google Earth’s historic imagery files. The map indicates the area of crevasses above the main terminus. A look at the glacier over the last two decades indicates the glacier remains vigorous in terms of flow, as indicated by the many crevasses. In every image from 1991 second image to 2003 and 2005 last two images, even in these later summer images the glacier retains snowpack in its upper accumulation zone. This suggest a glacier that can survive current climate at a diminished size. 


 The above images indicate the slow recent recession of the Harrison Glacier, which unlike the majority in the park is only slowly receding. This is in contrast to nearby Shepard Glacier and Grinnell Glacier which often are devoid of snow and are losing area at a rate of 10% per decade, four times that of Harrison Glacier. Why the difference? Most of the glaciers lay on the east or northeast slopes-lee side of the mountain ridges and have significant avalanching from the slopes above. Grinnell Glacier has a significant accumulation area at 7000 feet and Harrison Glacier at 9000 feet. Hence, the greater change in area as seen between the 1996 orange margin and 2006 recent margin for Grinnell Glacier
Mer de Glace, Glacier Retreat-A Receding Sea
Mer De Glace drains the north side of Mont Blanc. This is the largest glacier in this section of the Alps, it is 12 km long. The “sea of ice” terms not only refers to the size of the glacier, but also to the ogives, curved color bands formed at the base of the icefall. This sea of ice is slowing down as well as thinning and retreating. This has led to the lowest 12% of the glacier being stagnant and appears ready to melt away in the coming decades. A new paper Vincent et al (2014) model Mer de Glace into the future and generate a retreat of 1200 m by 2040, this is likely a minimum. 
Post has been relocated and update at
Mer de Glace
Petermann Glacier Retreat 2010-Rift Extension-2011 Update-2012 Update
The Petermann Glacier in northwest Greenland is significantly different than the fast flowing large outlet glaciers, such as the Jakobshavn and Helheim Glacier we here so much about. It is also different from neighboring Humboldt Glacier. Petermann Glacier is much thinner at the calving front and moves much slower. The result is the volume flux from this glacier is much less than Jakobshavn which loses 40 cubic kilometers per year, versus 1 cubic kilometer at the calving front of Peteramann and 12 cubic kilometers at the grounding line. A detailed review of some of the differences is explored in an article I wrote for Realclimate in 2008.
In 2011 the fjord in front of the glacier emptied of ice by July 22. The glacier itself has yielded no substantial icebergs or retreat following on the spectacular losses in 2010 noted below. The main rift near the ice front has not shown significant expansion, in the MODIS image below from 8/31/2011, Middle image. This lack of response in 2011 is not a surprise as after a substantial calving event in 2008, it was not until 2010 that the next one occurred, 2012 seems like a better bet. The change from July 28, 2010 (top image) is still amazing.
Update July 2012, the rift has led to the anticipated iceberg calving event well documented at Icy Seas and Arctic Sea Ice, see last image in sequence for the 2012 event. The glacier becomes thicker with distance from the calving front as of now there are now incipient rifts to note in the NASA MODIS image below. This combined with the thicker ice suggests that another iceberg calving event is not imminent, and cannot be forecast as the previous two were with a lead time of at least a year. There is a small area of weak ice, a melange at the blue arrow that is likely to provide smaller icebergs during the course of this summer.


In 2008 Petermann Glacier lost a substantial area, 29 km2 due to calving as noted by Jason Box at Ohio State. and a crack well back of the calving front indicates another 150 km2 is in danger, Crack C. This preconditioned area of weakness noted in 2008 is explored in satellite images below. Of course recent events of Aug. 2010 have resulted in a number of updates to this post. Petermann Glacier has a floating section 16 km wide and 80 km long, that is, 1280 sq. km. This is the longest section of floating glacier in the Northern Hemisphere. As of 8/5/2010 this floating section is now reduced to about 250 sq km in area and 65 km long. This impending loss I commented upon two years ago, and that Pat Lockerby has been focussed on this summer, has now occurred. This does not herald the end of the retreat. The loss of this much frontal ice should lead to glacier acceleration and some additional rifting in the near future. Unlike most Antarctic ice shelves this glacier is well buttressed by fjord walls and not prone to a rapid collapse. Inland of the grounding line unlike on Pine Island Glacier the Petermann Glacier goes from 500 meters below sea level at its bed to near sea level in a distance of 100 km. This limits the ability to form an ice shelf. Crack C is the main rift existing behind the calving front. A comparison of this crack from 2008 and 2010 indicates it has extended considerably toward the middle of the glacier. I have annotated two very detailed NASA images labeling the Supraglacial stream (SGS) channel that was interrupted by the rift severing it from the previous supraglacial stream channel (PGS). I have also labelled the turns in Crack C, note the 2007 end of the rift at the and the 2010 rift end indicated by blue arrows in the 2010 image. Also note the right hand blue arrow indicating the SGS entering the C crack and creating a bit of open water. The rift has now extended nearly to the center of the glacier and the central supraglacial stream. 
 The crack is going to spread and will lead to another major calving event. It seems unlikely it will occur in 2011, 2012 more likely. The rift as of April 18, 2010 in the image below from the Danish Meterological Institute MODIS library, is nicely visible, the bright white is likely indicating the presence of snow that has drifted into the rift.
  In 2011 the fjord in front of the glacier emptied of ice by July 22. The glacier itself has yielded no substantial icebergs and the main rift near the ice front has not shown significant expansion, in image below from 8/31/2011
The cropped image from Pat Lockerby indicates the newly created iceberg the largest in the Northern Hemisphere. The area of floating ice on the Jakobshavns in contrast has varied from year to year with retreat but has remained less than 40 sq. km. The size of the floating tongue provides the potential for a longer exposure and greater melting at the base of the glacier. This is also due to the slow velocities, 1 kilometer per year. The slow velocity results in a greater duration of surface and basal melting, which effectively thins the glacier to a mere 60-70 meters at the calving front. Petermann Glacier loses 90% of its thickness before it reaches the calving front thinning from 600-700 m at the grounding line primarilly due to basal melting. The calving front protrudes a mere 5-10 m above sea level, not your typical towering ice cliff you generally envision for a large Greenland outlet glacier. This reflects the fact that the ice at the front is only 60-70 m thick (Higgins, 1990). Thus, at 500-600 meters of thickness is lost to melting. This is largely basal melting as demonstrated by Johnson and others (2010). The glacier velocity is close to 1 km per year, 3/meters day, about 10% of the velocity of Jakobshavn (Rignot, 2000). The volume of the ice lost is much less than that from the loss of a comparable area by Jakobshavn because the ice is an order of magnitude thinner. Radar assessment by Howard Zebkar, Stanford Univeristy of glacier velocity indicates the acceleration near the grounding line as the glacier narrows and friction is reduced, then deceleration as the glacier thins after becoming fully afloat.
A recent paper by Joughin et al (2010) illustrates why Petermann Glacier is the key glacier in NW Greenland. It is their Figure 3 shown here that indicates on the left the large inland extent of high velocity of this glacier and on the right the recent lack of acceleration. An acceleration will require further ice tongues losses.  The key to this glacier’s second major ice loss this decade, after limited retreat in the last century, is thinning of the floating tongue. The thinning weakens the glacier and reduces the degree of anchoring to the fjord walls. The loss of this ice should then lead to acceleration, developing more crevassing and glacier retreat. The crack seen in the image of Petermann Glacier (ASTER image provided by Ian Howat of Ohio State) is more of a rift, like those on Larsen Ice Shelf, than a crevasse.
 The transverse rift is further connected to longitudinal-marginal rifts. Illustrating the poor connection of the Petermann Glacier to its margin and lack of a stabilizing force this margin has, even 15 km behind the calving front. This is not the only rift of its kind on the glacier. Also note that like on Larsen Ice Shelf the rift crosscuts surface streams. These illustrate the significance of surface melting, which reached a record in 2008 (Box and others, 2009). In 2010 the floating tongue lost its snow cover earlier than normal. This is important as Johnson et al (2010) have noted that basal melting is high closer to the grounding line, but not as high near the terminus, indicating that surface melting is a mechanism of thinning near the calving front. The surface melting does not enhance flow on this section of the glacier at all, as it is already afloat.
The images below are a series of Landsat images provided by the USGS, from 2002, 2006 and 2007. These illustrate the shift in the terminus and in the position of key rifts A, B and C. The distance back from the terminus has diminished for A and B from 2002 to 2007. In 2006 to 2007 the shift in the position of C is also evident.The final image is a larger scale indicating the entire valley section of the Petermann Glacier. The darker blue hue indicates that this is bare ice and is in the ablation zone. This is true in each year examined. The transition to the lighter hue, indicates the snowline, which is a short distance above the valley tongue. Petermann Glacier is poised to lose a greater area as it retreats than Jakobshavn Glacier, but a smaller total volume. 


Higgins, A. 1990. Northern Greenland glacier velocities and calf ice production. Polar Forschung, 60, 1-23.
Gígjökull Retreat and Eruption Impact on this Glacier-Updated 2/2011
Gígjökull drains north from the Eyjafjallajökull Ice cap. Eyjafjallajokull began to erupt on March 20. In the initial eruption the fountains of lava were vented from a fissure in a relatively ice free area, east of the ice cap, and did not generate much flooding from ice melt. The vent indicated by NASA from early April has shifted closer to the main ice cap, but is still peripheral to it. The ash plume is also travelling east away from the still white ice cap on April 1.  In the renewed eruption on April 13-16, 2010 the eruption has shifted closer to the summit of the ice cap melting several holes in the glacier visible in radar imagery from the Icelandic Coast Guard. These are located at the crest and just south of the crest of Gígjökull. The glacier has not been vaporized, but has experienced considerable melt.
  . The current eruption is close to the head of Gígjökull . Gígjökull is a 7.5 kilometer long glacier that empties out of the summit crater area at 1600 meters flowing across the ice cap plateau to 1500 meters then descending steeply in an icefall from the ice cap plateau to the terminus at 200 meters. There are pictures of lahars, Icelandic Met Service, from 4/16/2010 from just east of Gigjokull indicating this glacier is experiencing some substantial melt. The impact of the volcano will result in this glacier not being a good indicator of climate change impact on a glacier going forward, and will exacerbate the rapid recent retreat due to global warming. The Icelandic Met Office conducted a comparison of the runoff from glaciers draining the area around the volcano and from an ice cap in northeast and one in west Iceland indicate that the thick ash layer actually insulated the snow and ice underneath retarding glacier melt. Runoff in Jun-August 2010 a warm, dry period was just below normal in a gaged river draining the icecap near the volcano, and far above normal on ice caps farther from the volcano during summer 2010. Typically it takes a thickness of debris of 2 cm to switch from enhancing to retarding melting. The lahars visible in radar imagery on the 16th are mainly flowing to the south side of the ice cap. Contrast the series of images below from 4/17/2010 and 3/9/2010 from the Icelandic Met Office with the 2005 and 1992 images below. Below are the hydropgraphs from the Icelandic Met Office comparing the 2010 hydrograph of 2010 to those of 2006-2009, 2010 is the black year.
 The climate induced retreat continued up to 2010 as the glacier lost its entire stagnant section adjacent to the lake. And now the lake has been filled in by mud in a matter of days. As of May 2nd the glacier still exists, many would think it had melted away completely, but glacier are tough to melt. The last image is from the Icelandic Institute of Earth Science (Sigrún Hreinsdóttir)


 The image above is from Tómas Jóhannesson, Icelandic Meteorologic Office, and shows that in 1992 there is no indication of stagnation and breakup in the proglacial lake at the teriminus. In addition compare the width of the glacier in that base of the icefall region. In 2005 the large exposed bedrock region is evident, in 1992 it is an active crevassed glacier across this entire region. Given the thickness of the glacier 100-200 meters in this region, this is a very rapid change in thickness. The glacier retreated in the first half of the 20th century but then began an advance that lasted until 1997. From 1997-2005 the glacier has retreated 700 meters according to data reported to the World Glacier Monitoring Service. This is leading to the expansion of the proglacial lake. The current rate of retreat is nearly 100 meters per year. The lower 1.1 kilometers is stagnant and poised for further fairly rapid retreat. The glacier is several hundred meters thick in this region and would melt slowly in place, but can breakup quickly via calving in the proglacial lake at its terminus. How far will this sub glacial trough extend upglacier from the current terminus will be key to understanding how fast this will occur. The view across the lake and a section of the terminus area that was breaking up in 2004 resulting in a retreat of 370 meters from 2003-2005 is seen in the image below from Ó. Ingólfsson
 Note that in the image above and below. The lower 1.1 kilometers of the glacier lack crevassing and further has as its upglacier end a large bedrock area that is exposed across half the width of the glacier. this indicates the lack of flow from the icefall region of the glacier into the stagnant terminus zone.

Satopanth Glacier Retreat-Debris Cover and Hydropower
Satopanth and Bhagirath Kharak glaciers are located at the headwaters of the Alaknanda River, Uttarakhand, India. Satopanth glaciers has been assessed for the 1962-2006 period by Nainwal and others 2008 . This is accomplished through a comparsion of the 1962 Survey of India map and a total station survey completed in 2006 since 1962. Examination of satellite imagery indicates a retreat of 1900 meters from the Little Ice Age moraine that is evident. Satopanth Glacier has retreated continuously during this period. The total recession of the terminus which is at 3870 meters ranges from 1160 meters to 880 meters depending where on the glacier front retreat is measured, the average rate is reported as 22 meters per year (Nainwal and others, 2008), , for a total average retreat of 970 meters. The image of the terminus below is from the work of Nainwal and colleagues at Garhwal University.(Nainwal and others, 2008) . 
 The glacier has an equilibrium line altitude of 4800 meters, below 4700 meters the glacier is dominantly debris covered, the mean elevation of the glacier is, above the ELA, at 4900 meters. This debris cover is thick enough to retard ablation and also prevent black carbon from enhancing ablation on this section of the glacier. This glacier has a similar behavior, but a more limited accumulation zone than Gangotri Glacier or Khumbu Glacier. The transition zone where the glacier is not debris covered and there is significant melting comprises 20% of the glacier. The remaining 30% of the glacier is in the dry snow zone, where melting is limited and hence black carbon again has a limited role. The recession of this glacier is slowed by the debris cover. An alpine glacier needs a minimum of 50% of its area to be in the accumulation zone to be in equilibrium, this glacier has 40% of its area in the accumulation zone, hence retreat will continue. The debris covered area is illustrated in the first image below, the ELA in the second image and the accumulation zone in the third image. It is apparent that the zone of melting (ablation) is significantly larger than the accumulation zone.
 Run of river hydropower projects to yield 140 MW have been proposed for the upper Alaknanda River basin. Satopanth Glacier will be a key contributor to this project.
Tulsequah Glacier, British Columbia Jokuhlaups and Retreat
 Above is a paired Landsat image from 1984 left and 2013 right indicating the 2500 m retreat during this period of Tulsequah Glacier and formation of a new lake at the terminus. Tulsequah Glacier, British Columbia is a remote glacier draining from the Alaska-Canada boundary mountains of the Juneau Icefield. It is best known for its Jökulhlaups from lakes dammed by Tulsequah Glacier in northwestern British Columbia, Canada (Geertsema, 2000). This Tulsequah Glacier has retreated 1100 m since the Little Ice Age maximum in the 19th century. The continued retreat of the main glacier at a faster rate than its subsidiary glaciers raises the potential for an additional glacier dammed lake to form. The main terminus is disintegrating in a proglacial lake at present. This is not unlike the situation at the Gilkey Glacier just delayed. The images below are from Google earth in 2003 and 2007 and indicate the stagnant nature of the tongue in the lake, and lateral rifting that will be points of instability for a calving disintegration.


As part of the Juneau Icefield Research Program We completed extensive snow pack measurements in the upper reach of the glacier in 1981-1984 and found that snow depths by summers end between 1800-2000 meters averaged 4-6 meters. These observations completed along a transect across the glacier noted in the image below, provide a good example of the different sensitivities of the glacier to global warming. In 1981 a warm winter led to minimal snowpack at lower elevations in the Juneau Region, however, the upper regions of the icefield had above average snowpack. Jabe Blumenthal and I observed snowpack of over 5 meters on the upper Tulsequah Glacier. The areas above 1500 m are not very sensitive to winter temperatures as most as precipitation will fall as snow. In 1982 Juneau had good snowpack and the upper portion of the icefield was gripped by extended cold, the minimum thermometer at Camp 8 registered -44 F. In the images below the ELA for 1984 (right) and 2006 is indicated by a black dotted line, our Camp * a green dot and our accumulation profile is an orange line. In 2006 (left) the ELA is quite high and the accumulation are not large enough for an equilibrium balance. In 1984 the ELA was lower and mass balance was positive. 

Such cold conditions indicate continental dry climate conditions persisting. The result good snowpack low on the glacier and below normal snowpack high on the glacier. From Camp 8 Brian Hakala and I surveyed the upper Tulsequah and found 4 meters of snowpack. In 1984 the highest snowpack of 6 m was noted as Wilson Clayton and I again measured the upper Tulsequah. The glacier still had healthy accumulation. The issue driving the retreat is that the equilibrium line where melting equals accumulation and bare glacier ice is exposed has risen and is now typically at 1400 meters.
When water stored behind, on or under a glacier is released rapidly this outburst is referred to as a jökulhlaup. These outburst floods can pose a serious threat to life and property, but not from the modest floods of the Tulsequah system along this relatively undeveloped watershed. Tulsequah Glacier has a long history of often annual jökulhlaups since the early twentieth century documented by the USGS. The floods resulted after decades of downwasting and retreat of Tulsequah Glacier. In particular a tributary glacier feeding the Tulsdequah retreated and downwasted faster than the main glacier. This valley then was dammed by the main stem of the glacier. There is no surface drainage evident from either Lake No Lake or Tulsequah Lake (labelled TL and NN in image above), indicating all discharge is through a subglacial tunnel.the main stem of the glacier emerging at the terminus and causing modest downstream flooding. 


 Each summer as the lake filled with meltwater, its area, level and volume would increase to the extent that the hydrostatic pressure would float the glacier enough to begin flowing, this water then would further melt the ice enlarging its conduit. Most of the release occurs within several days. Hydrologic data are used to reconstruct the times and peak discharges of floods from the glacier-dammed lakes The first jökulhlaups from Tulsequah Lake were the largest. The history of this these jökulhlaups has been declining peak and total discharges as the lake became smaller. Today, Tulsequah Lake is small, and it will disappear completely if Tulsequah Glacier retreats any further. From 1941-1971 Tulsequah Lake discharged annually. Since 1990 a Lake No Lake has been discharging annually. Lake No Lake), has formed and grown in size as Tulsequah Lake has diminished. Lake No Lake developed from a subglacial water body in a tributary valley, 7 km upglacier from Tulsequah Lake. Like Tulsequah Lake, Lake No Lake rapidly grew in area and volume during its youth, and in the 1970s it began to generate its own jökulhlaups. Lake No Lake appears to be following the same evolutionary path as Tulsequah Lake – its volume is now decreasing due to downwasting of Tulsequah Glacier, and its jökulhlaups are beginning to diminish. As Tulsequah Glacier continues to shrink in response to climatic warming, additional glacier-dammed lakes may form, renewing the cycle of outburst flood activity, the tributary where this is most likely is labeled Future New Lake in the final image.
Urumqihe Glacier, China Separation and Retreat
Urumqi No. 1 or Urumqihe No.1 Glacier is in the Tian Shan Range of China. The Tain Shan Glaciological Research Station nearby, has led to this being the most closely observed glacier in China over the last 50 years. The glacier’s elevation ranges from 3740 meters to 4500 meters in 2005 the glacier had an area of 1.8 km2 (WGMS, 2010). In 1993 it separated into a larger east branch and a west branch. Since 1988 glaciological measurements are carried out for both branches separately (WGMS, 2010). The first image below is from Nozuma Takeuchi, Chiba University, Japan The second is from the WGMS submitted by Tobias Bolch in 2006.


The dryness and inhospitable nature of the region is evident. What is also evident is the limited snow extent on the glacier in the upper image of the east branch of the glacier. Both glacier branches are seen below, they joined in the foreground outwash plain region just 13 years before this image was taken. This region is one of the most continental areas of the world, dominated by polar and continental air masses from the Arctic and central Asia from autumn through spring, causing very low temperatures and little precipitation. During the summer months monsoonal air masses account for two thirds of the annual precipitation. This makes the Urumqi a summer accumulation type glacier, unusual outside of the Himalayan region, where peak accumulation on the upper part of the glacier and peak ablation on the lower part of the glacier, take part simultaneously in summer.
The regional increase of average air temperature of 0.7 C from 1987 to 2000 in north-western China has led to significant glacial mass losses, including a loss of 12 meters in glacier thickness on Urumqi Glacier in the last 35 years. The Average annual precipitation measured on the glacier is 600 to 700 mm relatively low for a glacier, an indicator of the continental climate. Most glaciers north of the immediate southern boundary with India and Pakistan, in China belong to the continental type and react slower to climate change than glaciers in warmer and wetter environments. The annual temperature at the equilibrium line is -8 to -9 C, the soils around the glacier feature permafrost. Runoff has been observed in the Urumqi River basin and has increased by 30% from 1983-2006. Comparison of runoff from glacier and non-glacier basins indicate a much larger change, change of 150%-200% in glacierized basins over the last 50 years. This is due to enhanced melting of the glacier, providing runoff that had been in long term frozen storage.
The mass balance is assessed at specific points indicated in the first figure below, 45 locations which is a higher than typical density 25 point per km2. The second figure is the contoured result of these measurements in terms of the snow-ice (measured in water equivalent units) gained or lost across the glacier. In this particular year the area of snow cover for both glacier branches is about 33% this is much less than the 65% needed for equilibrium on this glacier leading to a negative balance in 2006-07 of -650 mm (WGMS,2010). 
 The mass loss fits the global pattern and cumulative mean of glaciers reporting to the WGMS. The mass balances losses have continued to increase each decade.
Fairchild Glacier Breakup and Retreat, Elwha River Dam Removal, Washington
The 70 km long Elwha River in Olympic National Park was once of the most productive salmon rivers in the Pacific Northwest, this fall it is getting to for the first time flow from the glaciers to the sea, image of watershed from the restoration project . At the headwaters of this stream are two named glaciers Carrie and Fairchild, and four unnamed glaciers, which play an important part in the hydrology of the watershed. The glaciers have retreated considerably since the building of the dams, rapidly since 1980. The result is a significant reduction in late summer glacier runoff than when the stream last flowed naturally. The construction of Elwha Dam (1913) and Glines Canyon Dam (1927) devastated the Elwha River’s salmon runs. Dismantling the Elwha and Glines Canyon dams over the next two years will allow the river to flow freely for the first time in nearly 100 years. The river will run from its headwater glaciers to the sea. Dams alter streamflow by withholding water and then releasing the water to generate power during peak demand periods. This leads to unnatural flows, which interrupt natural variations that are critical to the fish and wildlife species. Besides the ongoing dam removal recent climate change is altering the seasonal flow of the Elwha River. The loss of glacier area has and will lead to ongoing significant changes in summer streamflow in the Elwha River. In the Elwha River from 1950-2006 summer streamflow declined by 25%, spring streamflow by 17%, and winter streamflow increased by 6%. Part of this change is due to the loss of glacier extent in the watershed.
Glaciers act as natural reservoirs storing water in a frozen state instead of behind a dam. Glaciers modify streamflow releasing the most runoff during the warmest, driest periods, summer, when all other sources of water are at a minimum. Annual glacier runoff is highest in warm, dry summers and lowest during wet, cool summers. The amount of glacier runoff is the product of surface area and ablation rate. The North Cascade Glacier Climate Project began annual monitoring program of North Cascade glaciers in 1984. This program has also examined the change in glacier volume and extent in the Bailey Range and Anderson Glacier in the Olympic Mountains.
In the Elwha watershed glacier extent has declined from 2.8 km2 in 1980, to 2.6 km2 in 1990, to 2.1 km2 in 2008.
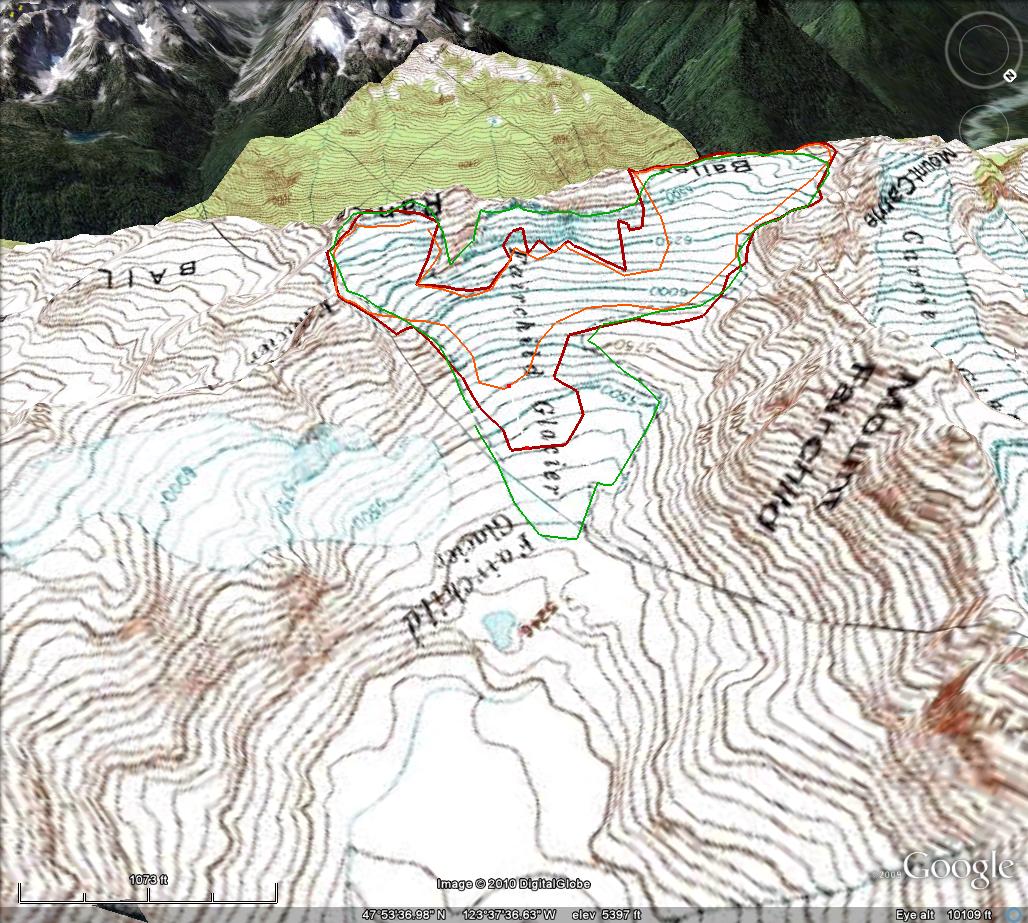
Fairchild Glacier retreated 300 meters from 1950-1994, topographic map versus aerial photograph, green versus red line. From 1994-2009 another 240 m of retreat occurred as indicated by the orange line. In addition the Fairchild Glacier has separated into three sections by 2009. 

 The greatest concern is the emergence of bedrock outcrops in the midst of the glacier since 1994, burgundy arrows in the 2009 image. This is a key symptom of a glacier that will not survive (Pelto, 2010). This is leading to the breakup of the glacier into smaller easily melted segments. This is a process that we have observed lead to the demise of glaciers like the Hinman Glacier. The emergence also indicates the thin nature of the glacier. The view of the glacier from 2005 illustrates the small area of the glacier that is retaining snowpack, this is not a good sign for survival of this glacier.At the end of the summer melt season a glacier needs to be at least 50% snowcovered, to survive it must have a consistent significant area of snowpack. In 2005 in this August picture only 20% of the glacier is snowcovered and by summers end it was 5%.

The consequent glacier runoff has declined by 750,000-850,000 ft3/day in the summer since 1980. The resultant annual hydrograph for the Elwha River is not the same as it was before dam construction. In particular late summer and fall salmon runs will experience less runoff due in part to declining glacier runoff. Streamflow in the Elwha River has declined 25% during July-Sept. for the 1950-2006 period. The mean summer flow from 1950-1991 was 1034 cfs. From 1992-2009 only two summers had mean streamflow above 1034 cfs. The decline in glacier size is not the principal cause of the summer streamflow decline, but it further reduces the summer low flows. Updated 12/14/2011
Waputik Icefield Outlet Glacier retreat, Alberta Canada
The Waputik Icefield, near the Icefields Parkway, north of Banff, Alberta straddles the continental divide. The Waputik outlet “Liiliput” Glacier is a 3 kilometer long outlet draining east into Hector Lake and the Bow River. This glacier drains the north side of Lilliput Mountain, and is just southeast of Balfour Glacier, which it merged with in the late 19th century. That is why the glacier lacks a proper name, it was part of the Balfour Glacier when named. The Lilliput Glacier has retreated 2.3 km from its maximum. The Balfour Glacier with which it was joined retreated at a rate of 10 meters per year at the end of the 19th century and 40 meters per year up to 1945, by 1945 the glaciers had separated (Ommaney, 2000). From 1945 to 1970 limited retreat occurred on either Lilliput or Balfour Glacier.
This Lilliput Glacier is now continuing to retreat, 320 meters since the 1970 picture of the glacier was taken. In 1970 the glacier still has a single terminus in the valley and ended a short distance above a steep bedrock slope. 

 By 1994 the glacier has developed two termini and has retreated 200 m from the 1970 position. The 2002 terminus in this Google Earth image has retreated an additional 100-200 meters depending on location along the front. A closeup of the terminus area indicates limited crevassing, indicating limited movement and continued retreat. The supraglacial stream (winding stream channel on glacier surface) that is visible has downcut a considerable channel, this too indicates limited movement. An active glacier terminus would closeup such a channel seasonally as movement continued and meltwater flow ceased.
  The glacier in 2002 still has an accumulation zone at the head of the glacier. For a glacier like this to be in equilibrium it needs at least 50% of its area to be snowcovered at the end of the summer, this percentage is the accumulation area ratio. In the image below the lines are annual accumulation horizons exposed in the glacier ice. This indicates a region of the glacier that is consistently exposed to ablation today. Only 40% of the glacier is snowcovered above this point. This indicates how little of the glacier is a consistent accumulation zone today. Without a consistent accumulation zone the glacier cannot survive.
Brady Glacier, Alaska begins a substantial retreat
Brady Glacier is a large glacier at the south end of the Glacier Bay region, Alaska. When first seen by George Vancouver it was a calving tidewater glacier in 1794 filling Taylor Bay with ice. Brady Glacier ceased calving and advanced approximately 8 km during the 19th century (Klotz, 1899). As Bengston (1962) notes, the advance is likely another example of an advance following a change from tidal to non-tidal status rather than that of a more positive mass balance. Bengston (1962) further notes that the massive outwash plain at the terminus is primarily responsible for Brady glacier maintaining itself well other glaciers in the Glacier Bay region retreat. The ELA on this glacier is 800 m, the line above which snow persists even at the end of the average summer, this is one of the lowest in Alaska. The main terminus was still advancing in the 1960’s and 1970’s and has managed a 250-300 meter advance since the USGS map of the 1950’s. The main terminus is not advancing any longer and has begun to retreat, the retreat to date is less than 200 meters. The image below is the 1950’s map of the glacier.  Brady Glacier is a complex glacier with many subsidiary termini. Echelmeyer, Arendt, Larsen and Harrison from the University of Alaska noted a thinning rate in the mid 1900’s of about 1 meter per year on the Brady Glacier complex. A comparison of 1950’s USGS maps and 2004-2006 satellite imagery indicate all six main subsidiary termini are retreating. The retreat ranges from 200 m in Abyss Lake, 200 m in Trick Lake to 1200 meters in North Deception Lake. The image below is the 2006 satellite image. Compare to the map, Deception has increased in size several fold. North Trick and South Trick Lake are now joined, Trick Lake.
  Of further interest is the stream draining Trick Lake that sneaks down the west margin of the glacier. This has enabled the water level in the glacier dammed Trick Lake to decline. Note the brown grey “Bath Ring” so to speak above the lake level. The outlet has also been marked in the image below. Pelto (1987) noted that the percentage of the glacier in the accumulation zone was right at the threshold for equilibrium. Subsequent warming of the climate in southeast Alaska and reduced glacier mass balance in the region has initiated this retreat.
 These termini are all closer to the equilibrium and would respond first to changes in mass balance due to recent warming and consequent measured thinning. This entire line of reasoning must be explored. The glacier is thinning substantially and would appear to be poised for a substantial retreat of the main termini, not just the subsidiary termini.
References not linked:
Bengston, K. recent behavior of Brady Glacier, Glacier Bay National Monument, Alaska. IAHS, 58, 59-77.
Klotz O. 1899: Notes on glaciers of southeast Alaska and adjoining territories. Journal of Geography, 14, 523-534.
Pelto, M. 1987. Mass balance of southeast Alaska and northwest British Columbia glaciers from 1976 to 1984: Methods and Results”. Annals of Glaciology 9: 189–193.
