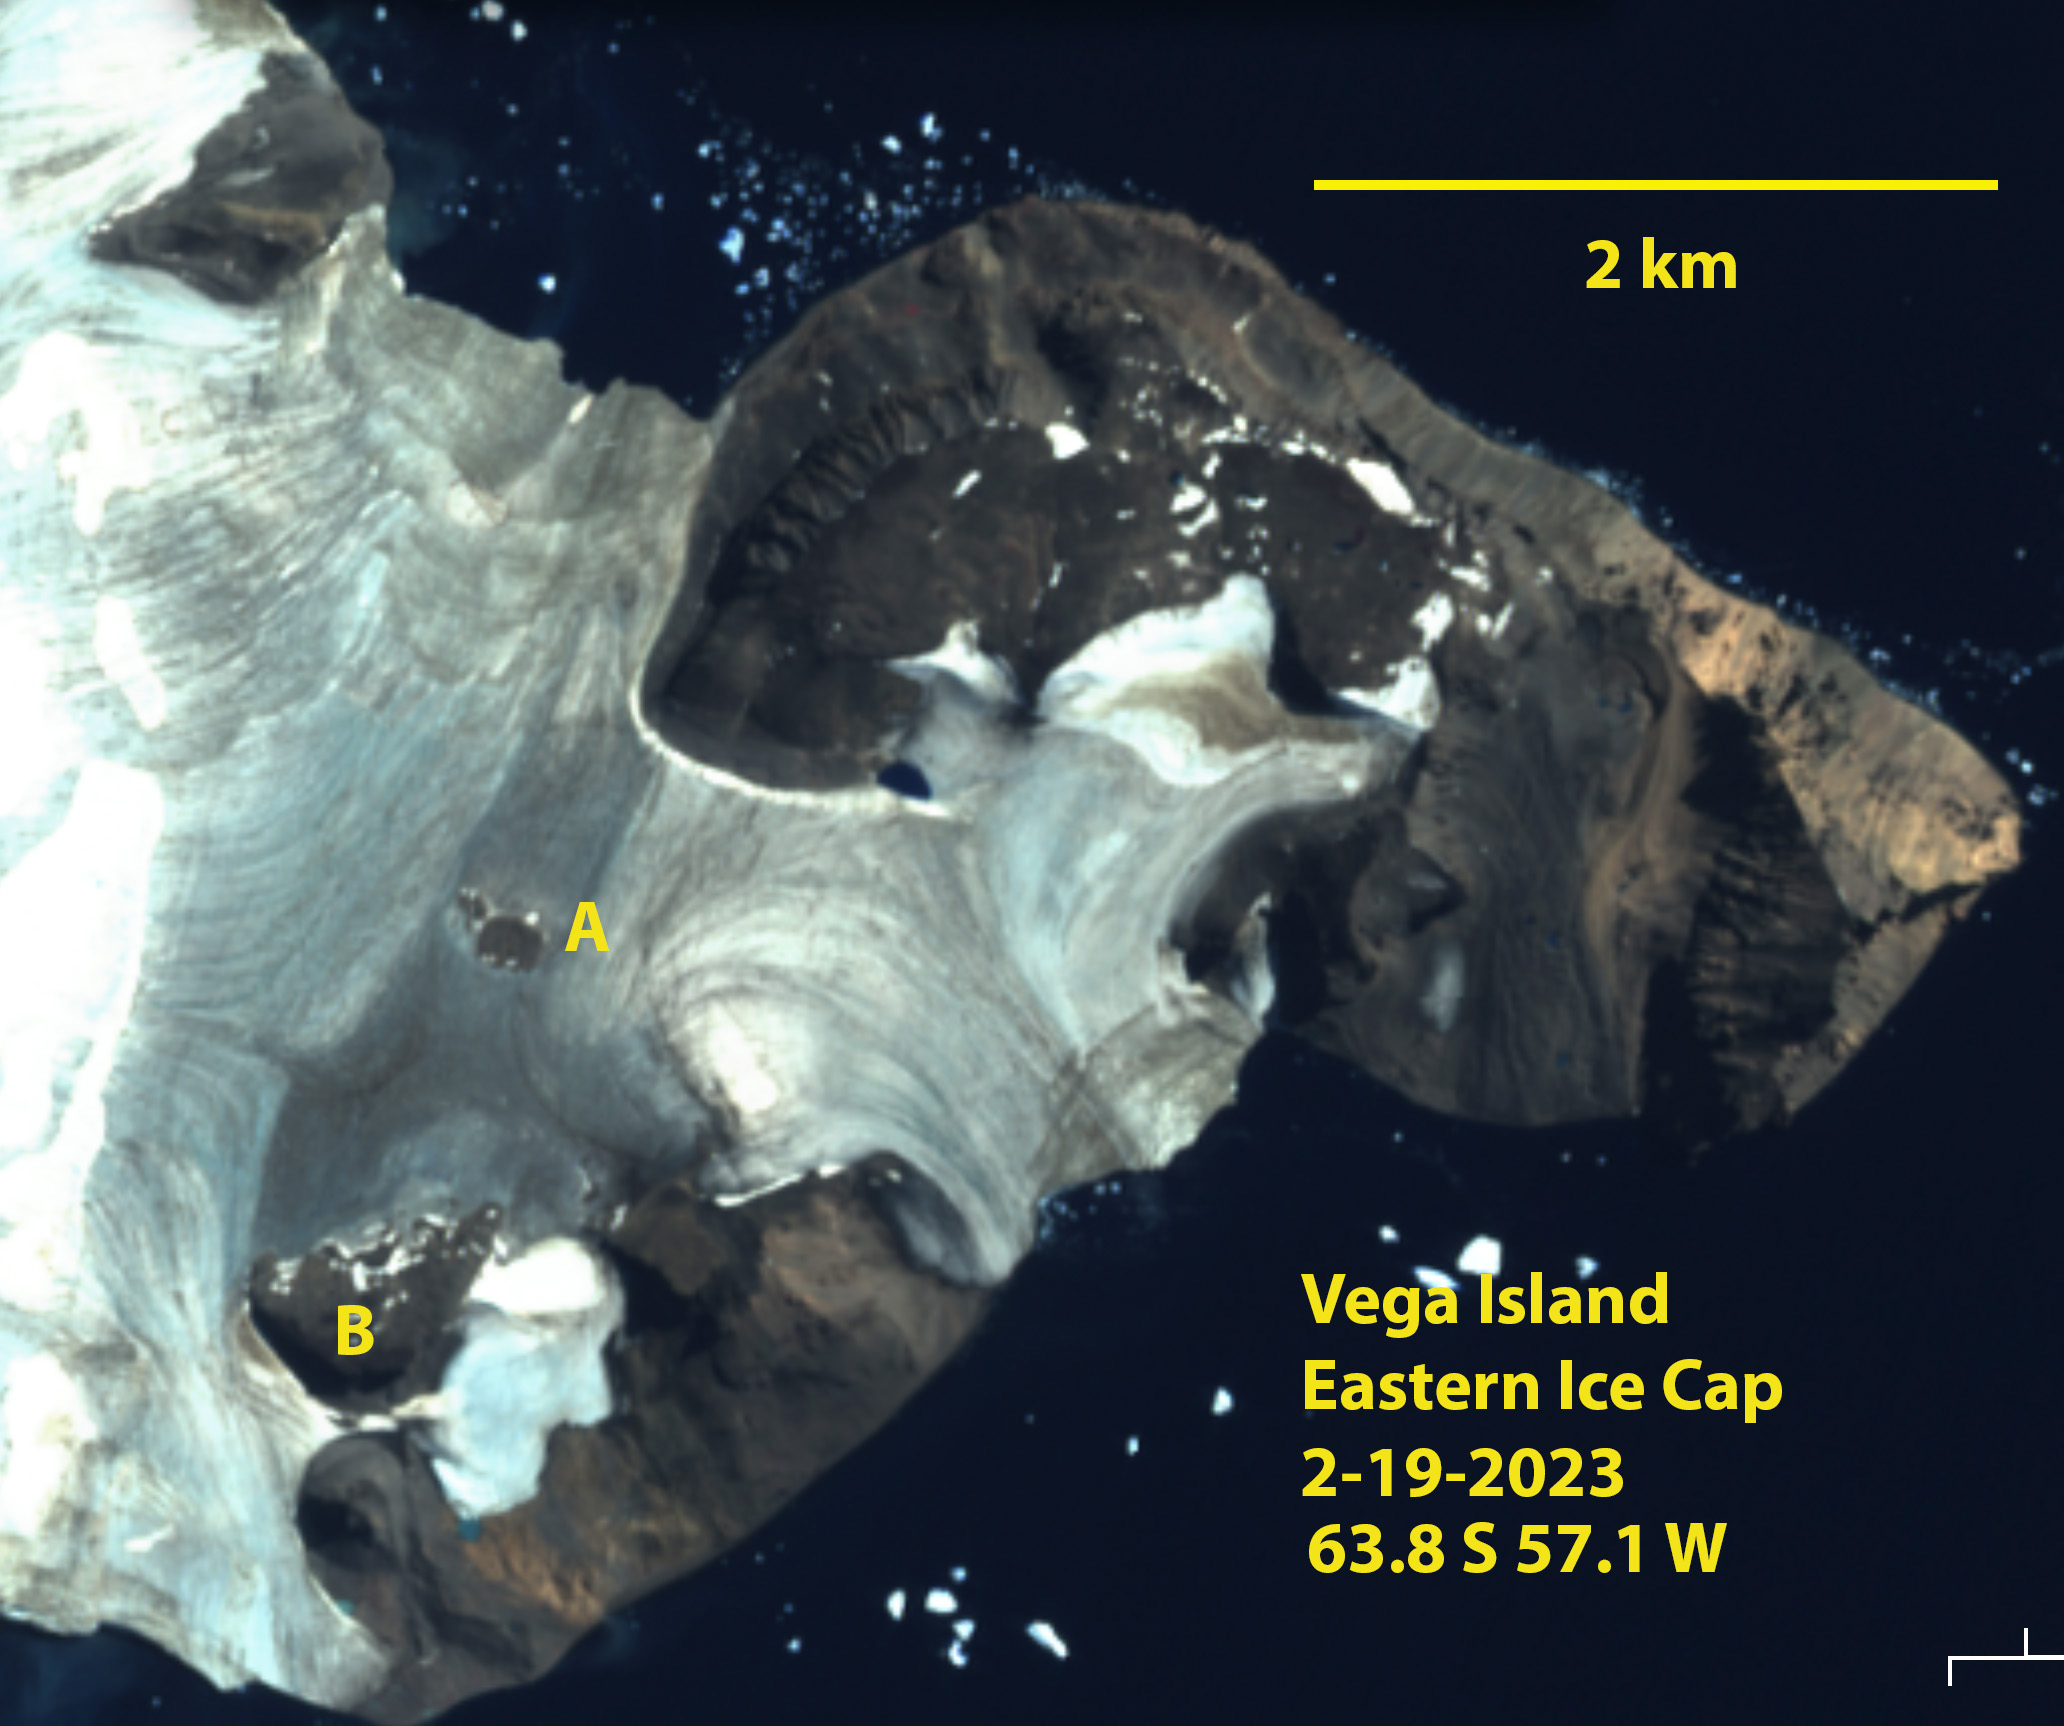
Eastern Ice Cap on Vega Ice Cap is snow free in Feb. 19, 2023 Sentinel images. Bedrock areas at Point A and B will expand with snow free conditions.
In 2023 the near complete loss of snowcover is apparent on a number glacier and ice caps In Antarctica, on several islands along the Antarctic Peninsula. This yields a more extensive bare ice and firn surface area, that increses melt rate and increases the density of light absorbing particles on the surface. This snowcover loss is the result not of a heat wave but of a consistenly warm summer. At Esparanza Base:
- November mean temperature 2.5 C above average
- December mean temperature 0.5 C above average
- January mean temperature 1.5 C above average
- February mean temperature 1 C above average
This yields an mean melt season temperature 1.5 C above average compared to 2020 that had a mean average temperature 0.5 C above average. The most anomalously warm month was November. Monthly temperature anomlies for the region are evident in the global monthly maps from NCEI NOAA, see below. The net amount of melt for these temperatures is still low, which indicates the limited accumulation in the region.
On Vega Island the eastern end features an ice cap that has no retained snowcover from the north to south shore, with two expanding areas of bedrock amidst the glacier at Point A and B. Snowcover begins at 300 m on an ice cap toward center of island. On Vega Island’s western end the ice cap has lost 70% of its snowcover, with snow retained above 400 m.
On the Ulu Peninsula of James Ross Island three of five glaciers along the Lachman Crags are snowcover free. Triangular, Lachman and San Jose Glacier lack snowcover and have a much darker surface, which further enhances melting, then seen in field photographs of these glaciers (Davies, 2020) and Jennnings et al (2021). Glasser and Lachman North Glacier both have significant snowcover above 500 m.
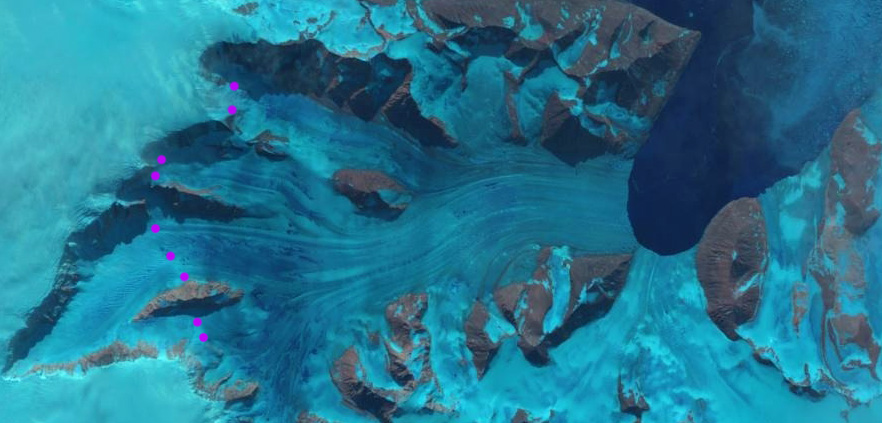
Whisky Glacier is a tidewater glacier terminating in Whisky Bay. This glacier is 90% snowcover free on Feb. 19, 2023. Snow patches are evident above 250 m near the ice divide, note green arrow. The southwest extension (SW) is also snow free.
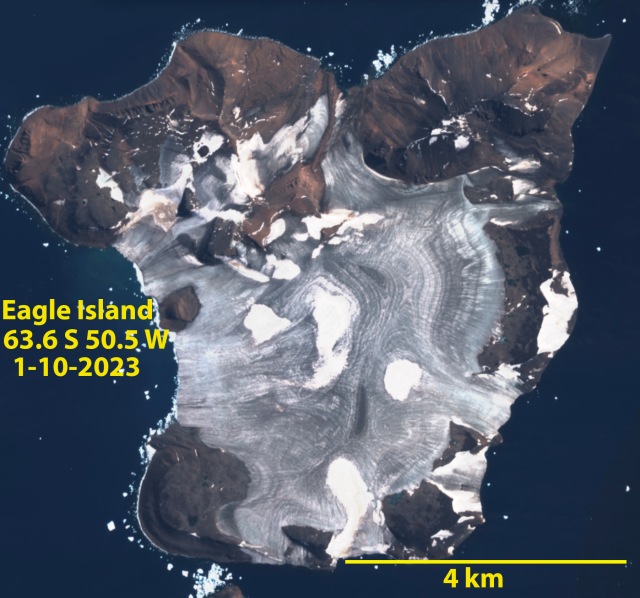
As reported separately, Eagle Island Ice Cap in Sentinel image from Feb. 19, 2023 has only small patches of snowcover left, 5-10% of ice cap all above 300 m. The peripheral ice caps and glaciers here are not an indicator of the larger ice sheets. They are an indicator that snowcover free glaciers are now occurring not just at temperate latitudes. These glaciers like many glaciers in the Central Andes of Chile and Argentina have lost nearly all their snowcover.
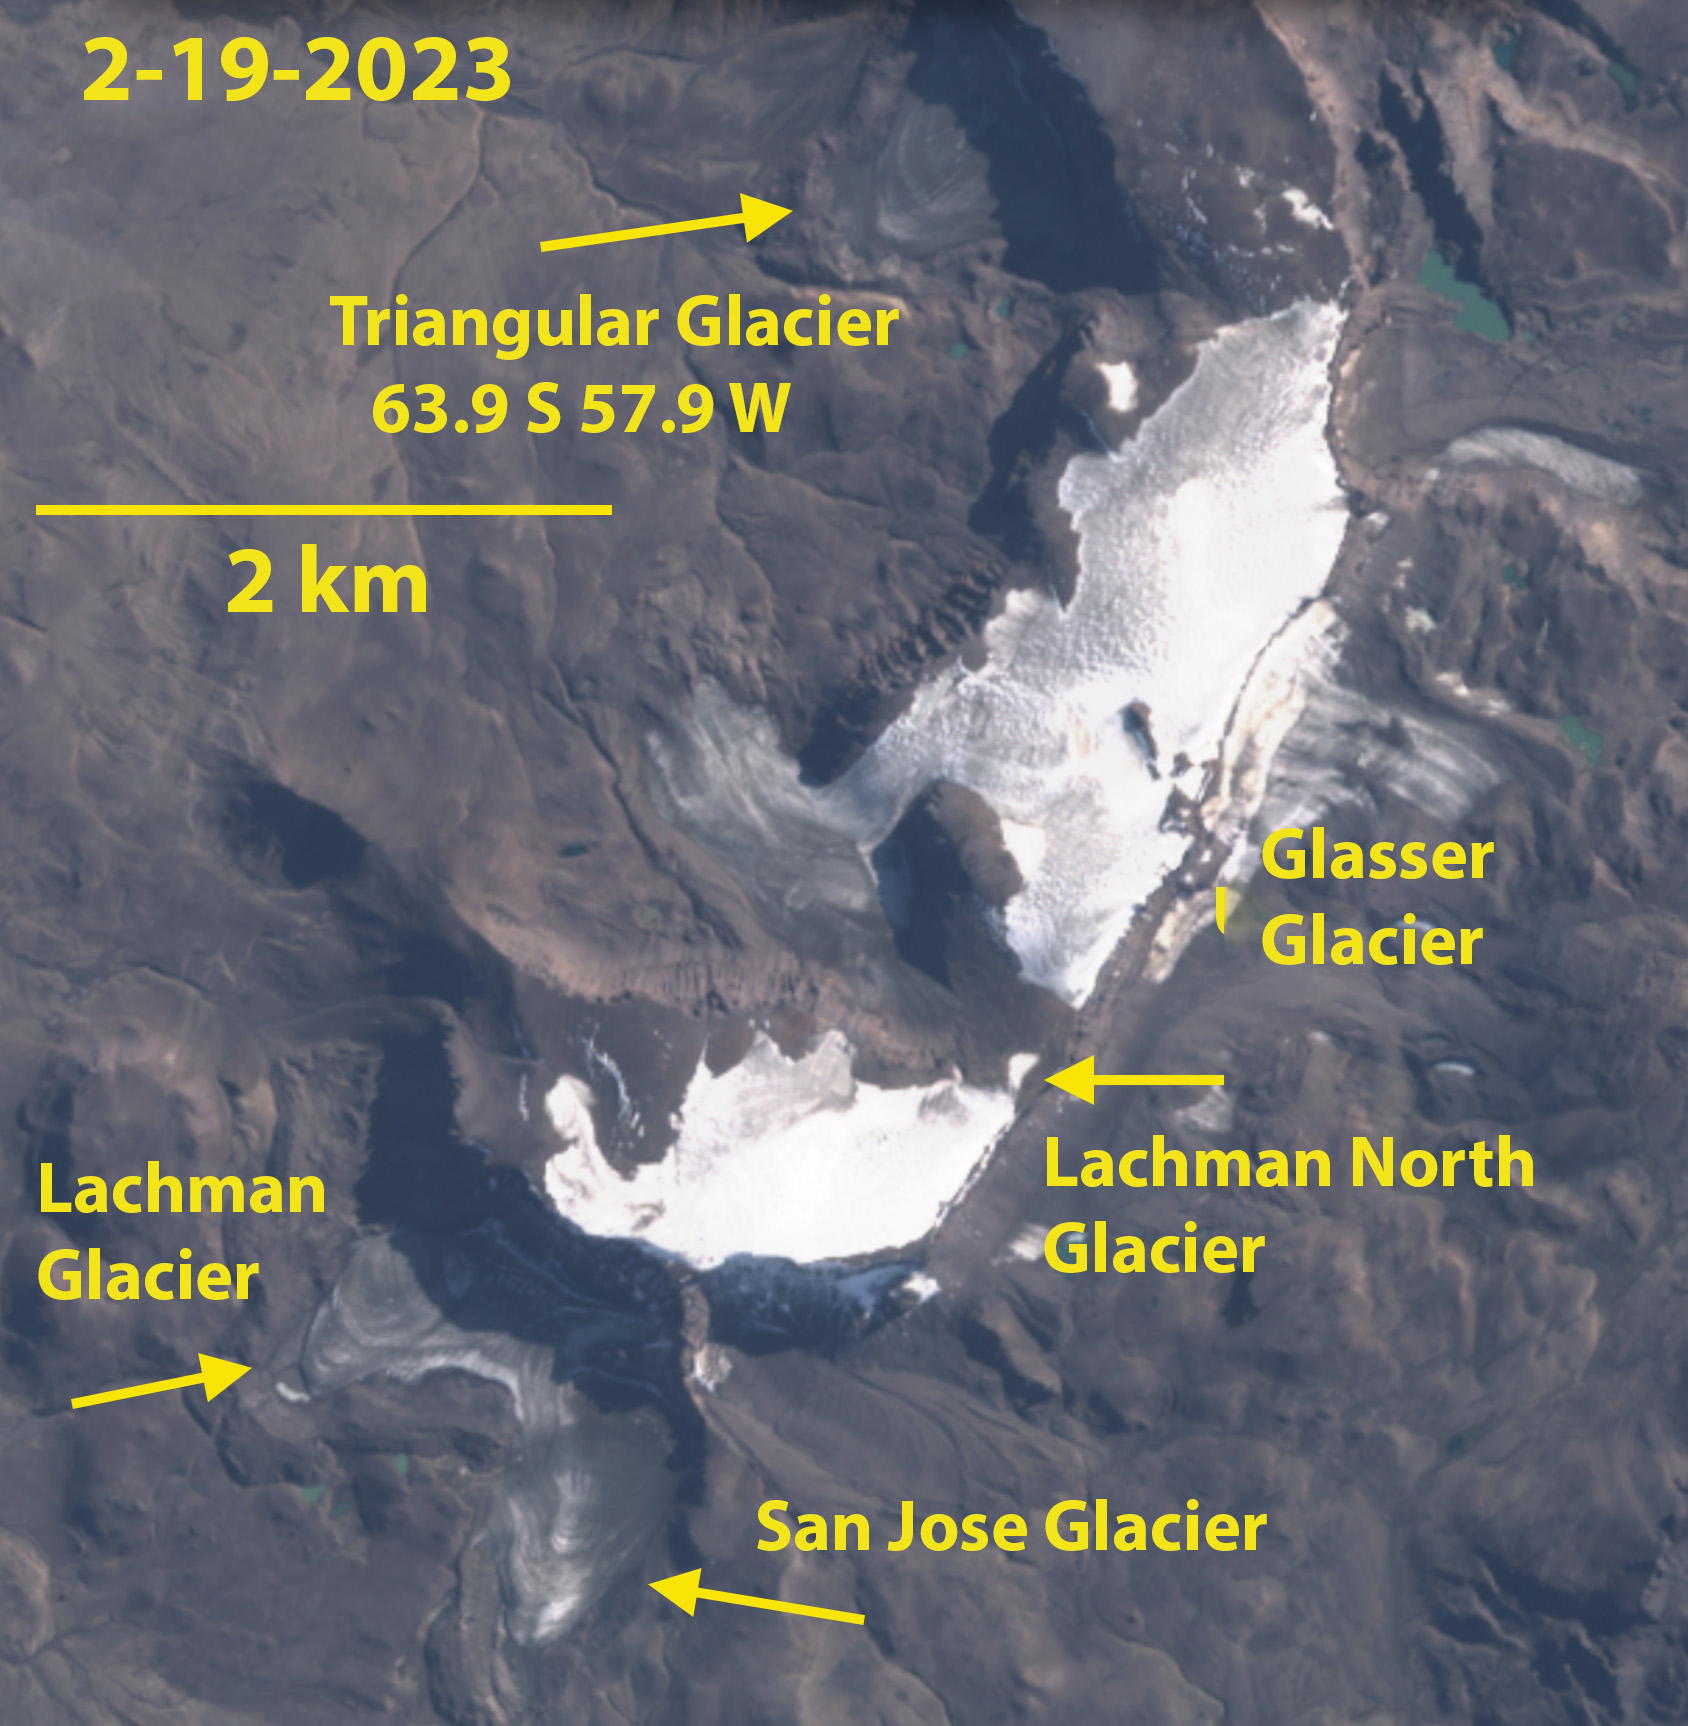
A series of glaciers on the Ulu Peninsula of James Ross Island Feb. 19, 2023 Sentinel images. San Jose, Lachman and Triangular have lost all snowcover and have a low albedo. Glasser and Lachman North Glacier have snowcover above 500 m.

Whisky Glacier on the Ulu Peninsula of James Ross Island Feb. 19, 2023 Sentinel image, illustrating 90% of the snowcover has been lost, green arrow is ice divide.
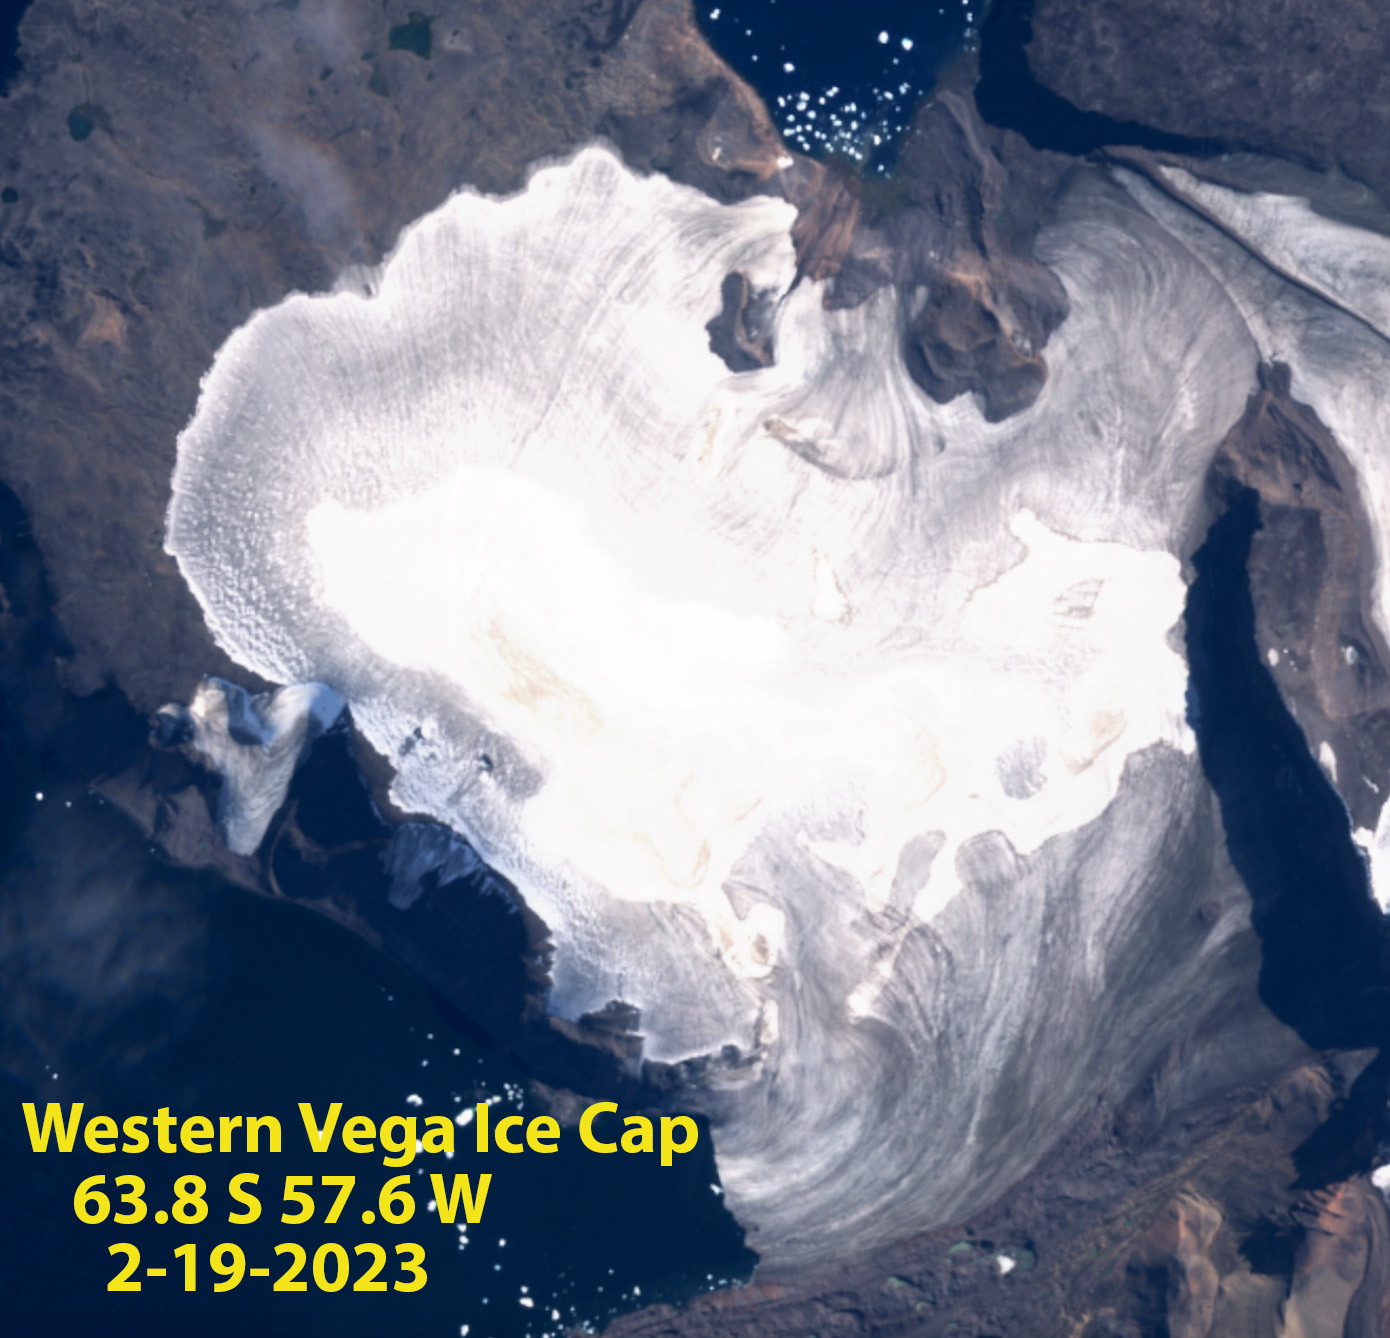
Western Vega Island Ice Cap in Feb. 19, 2023 imnage is 70% snowcover free with snow along summit area above 400 m.
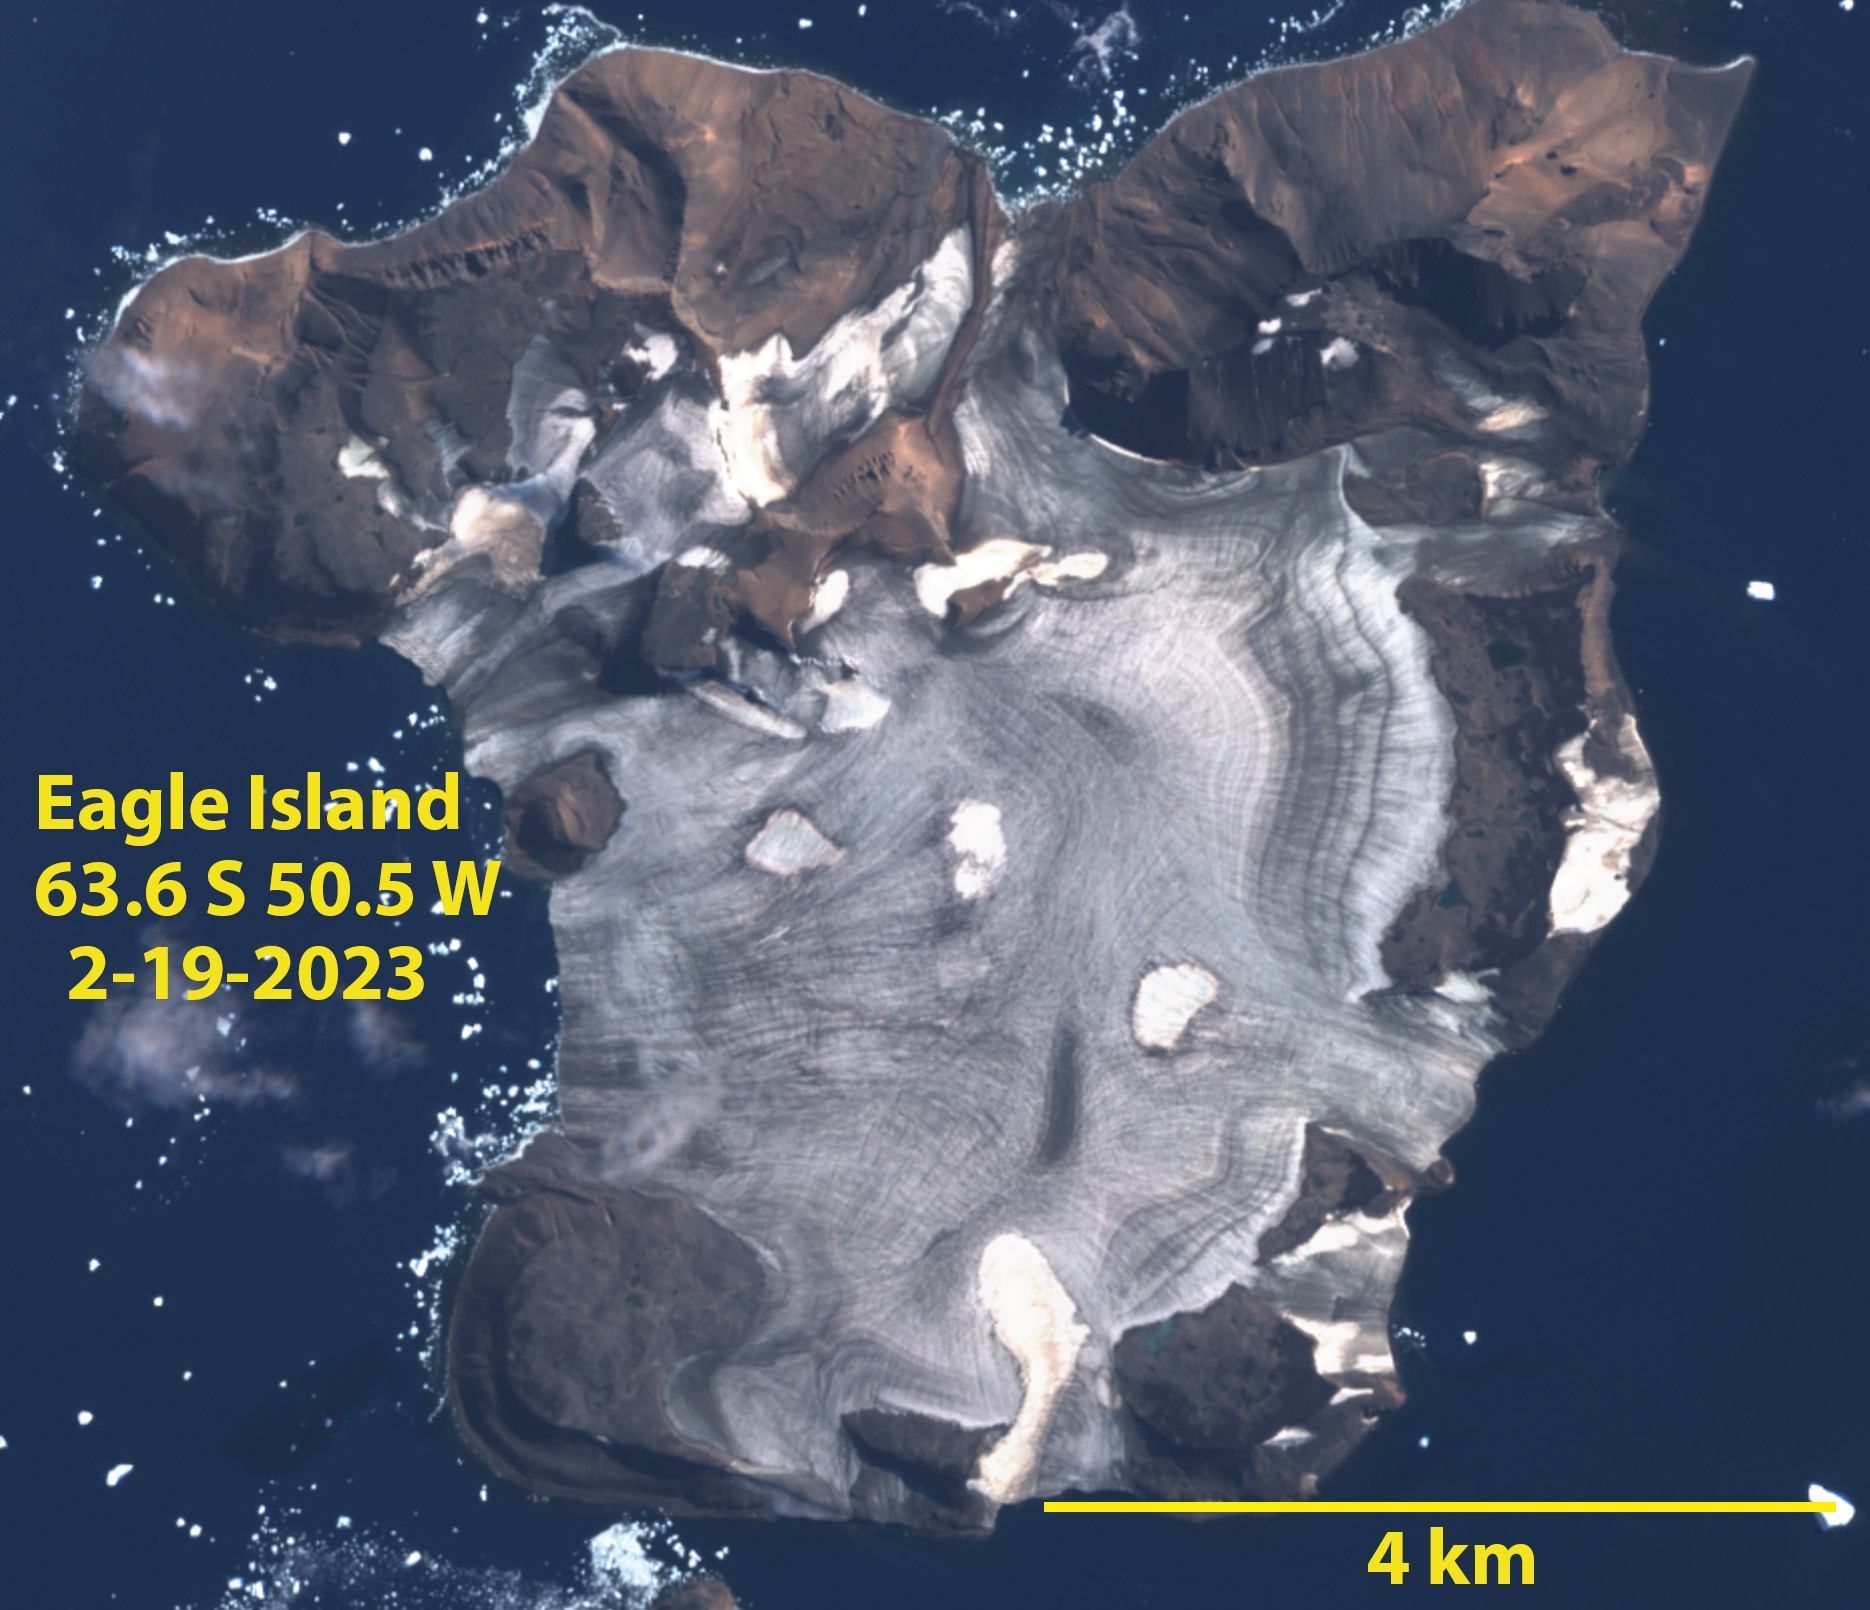
Eagle Island Ice Cap in Sentinel image from Feb. 19, 2023 illustrating only small patches of snowcover left, 5-10% of ice cap.
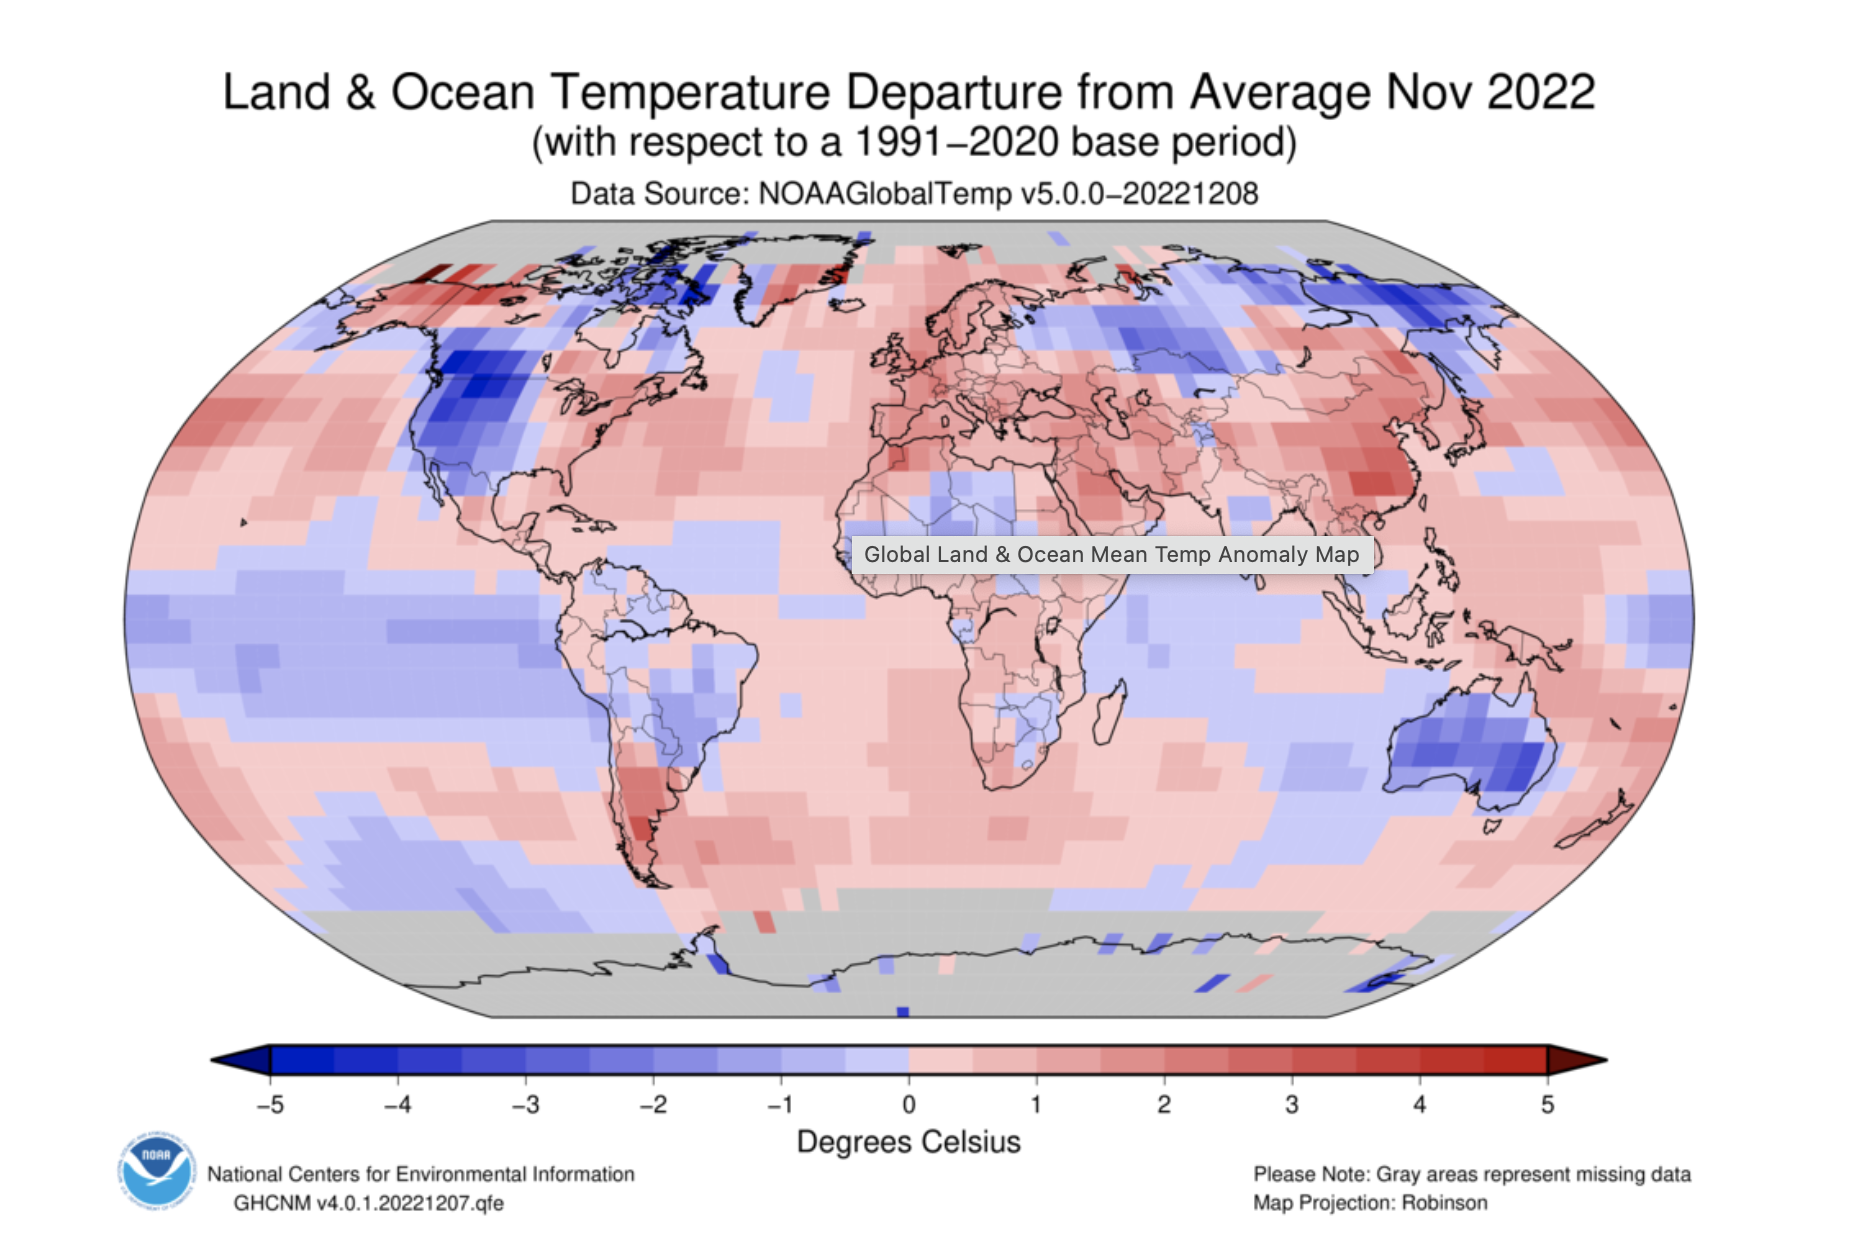

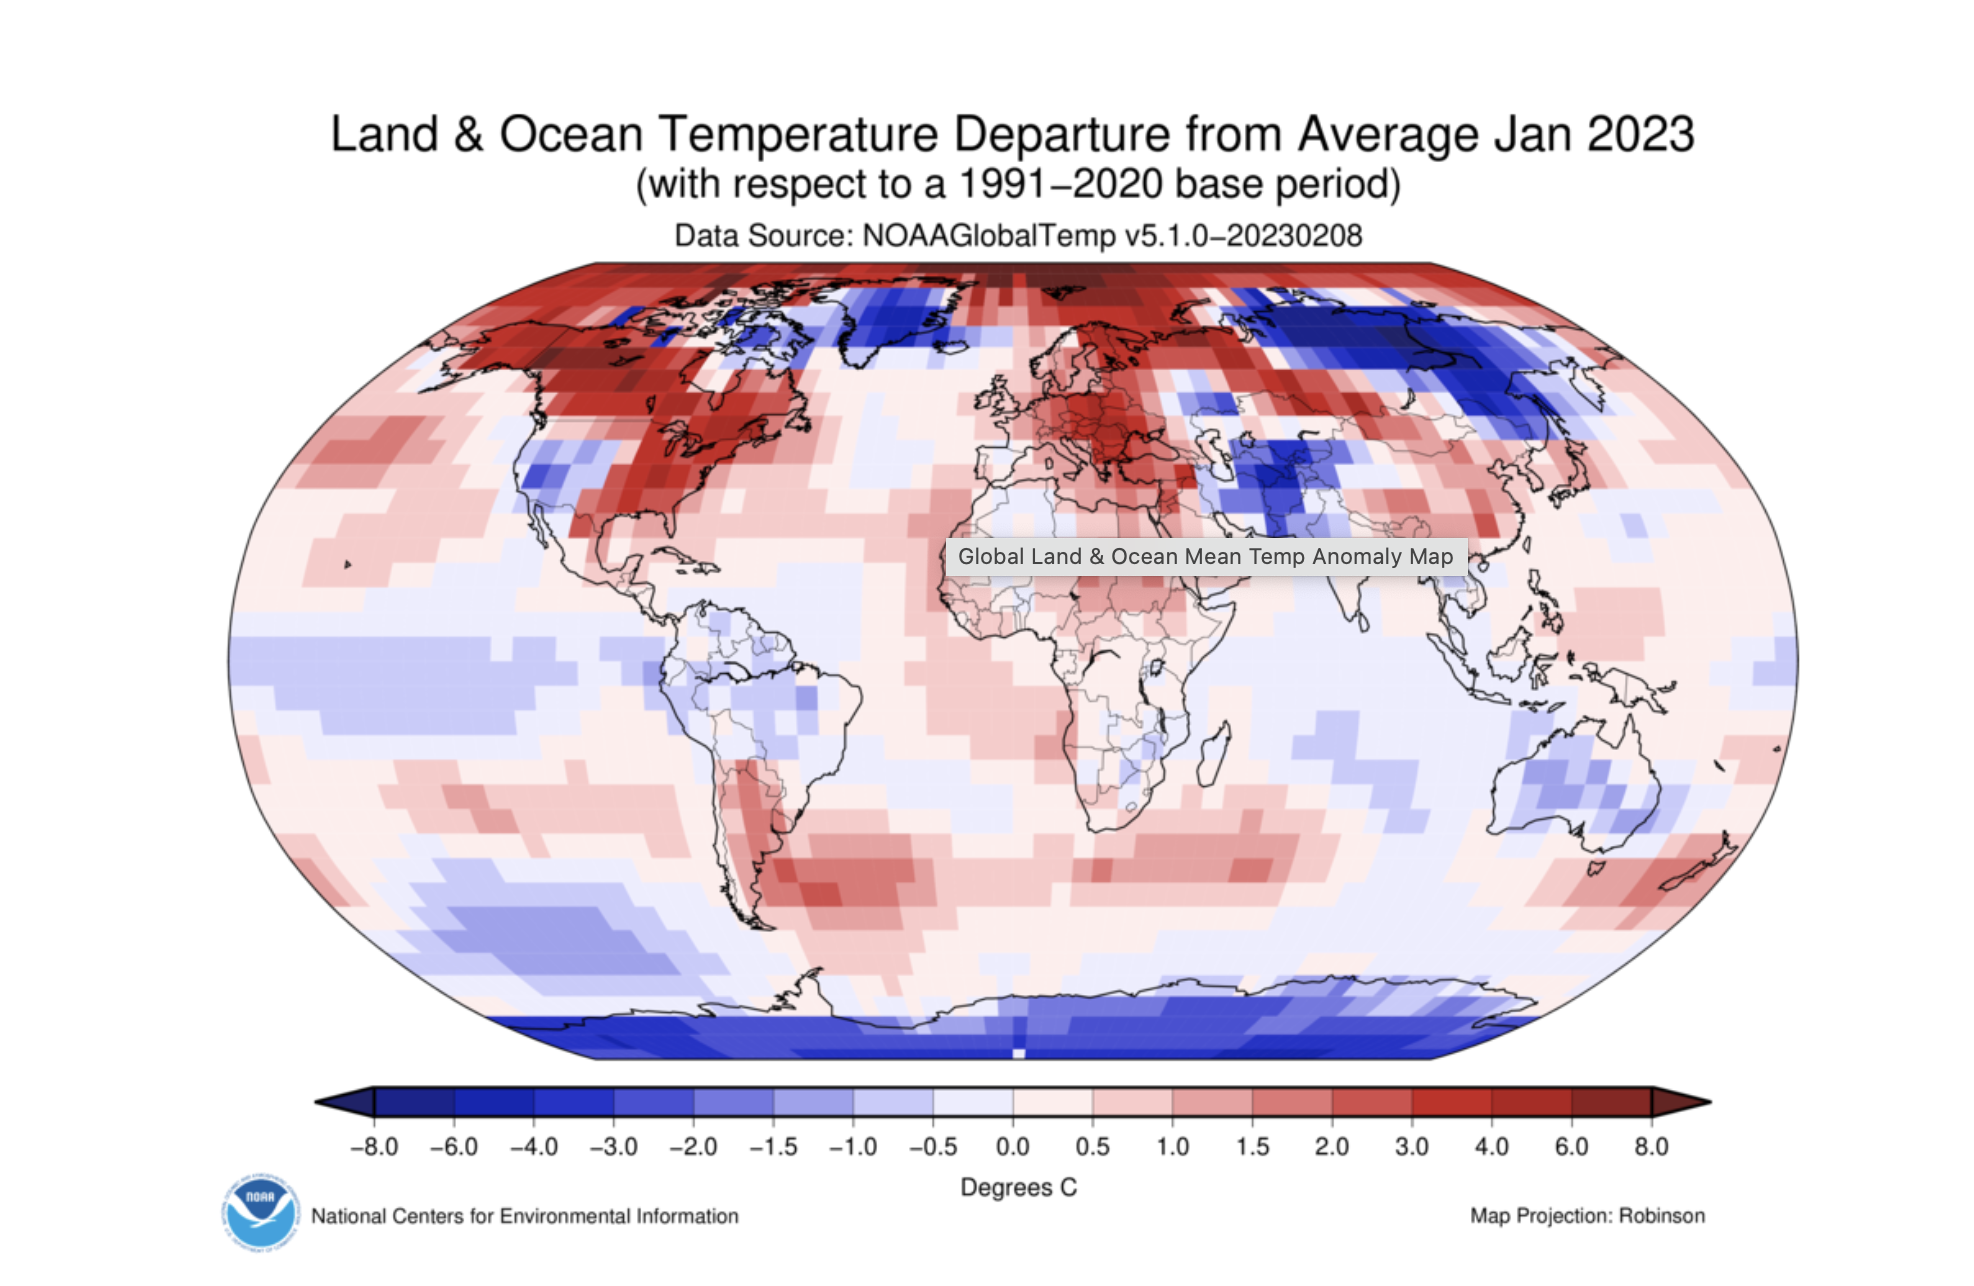
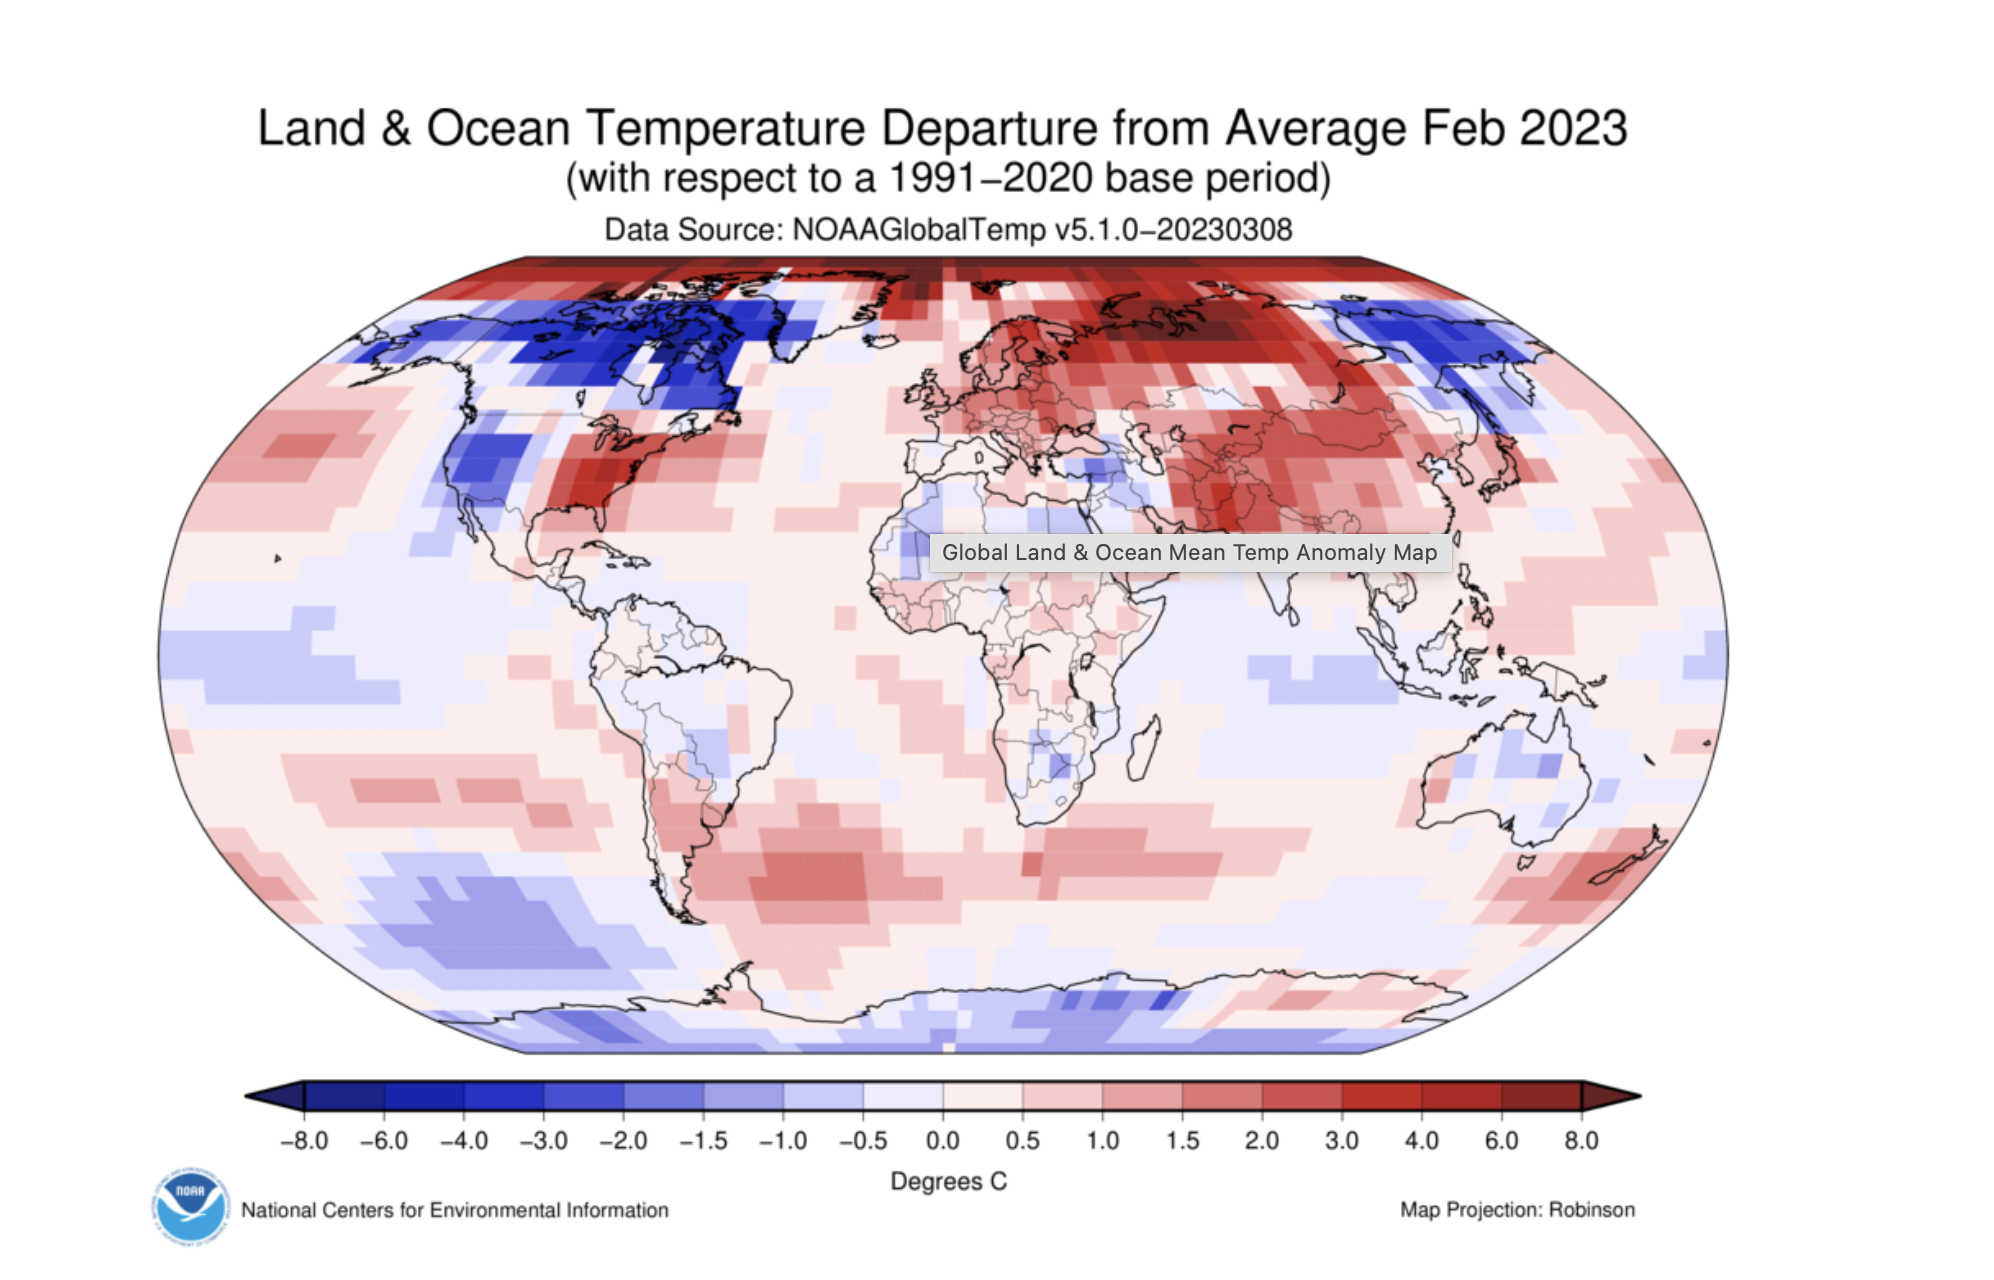
NCEI NOAA Monthly Global temperature anomalies.