

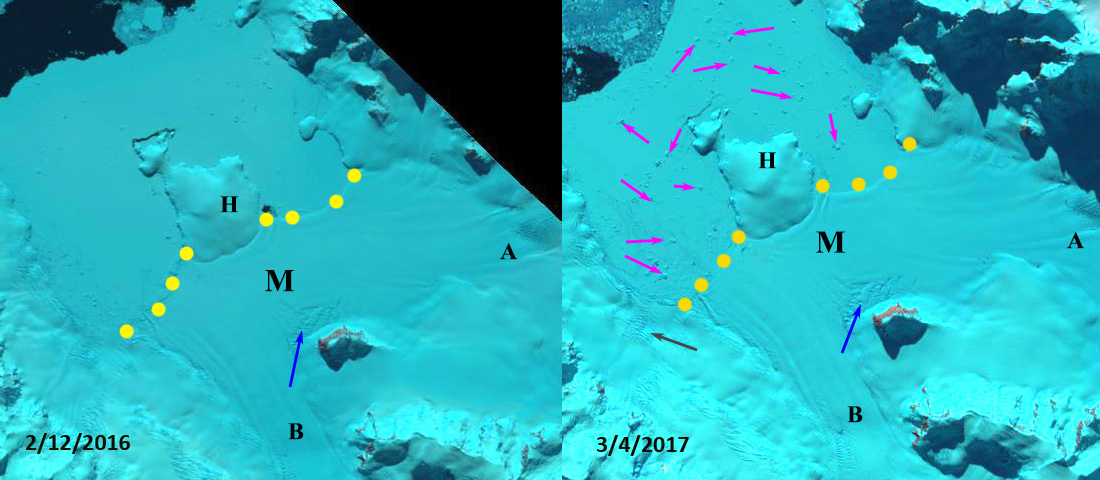
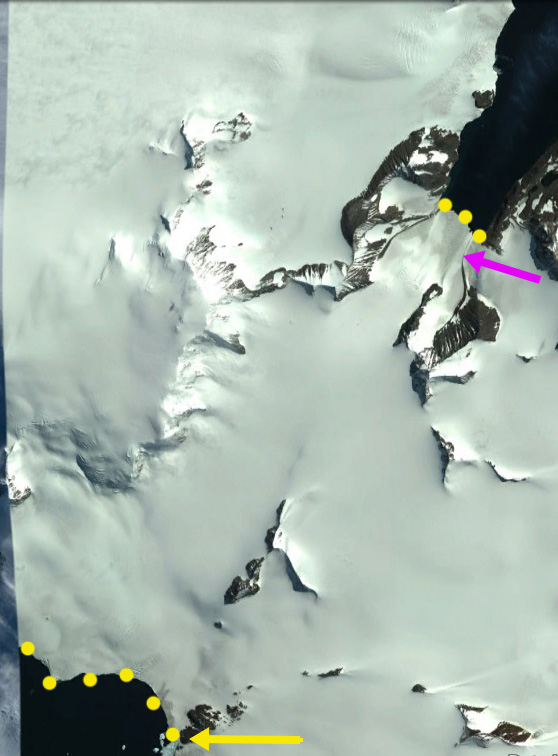
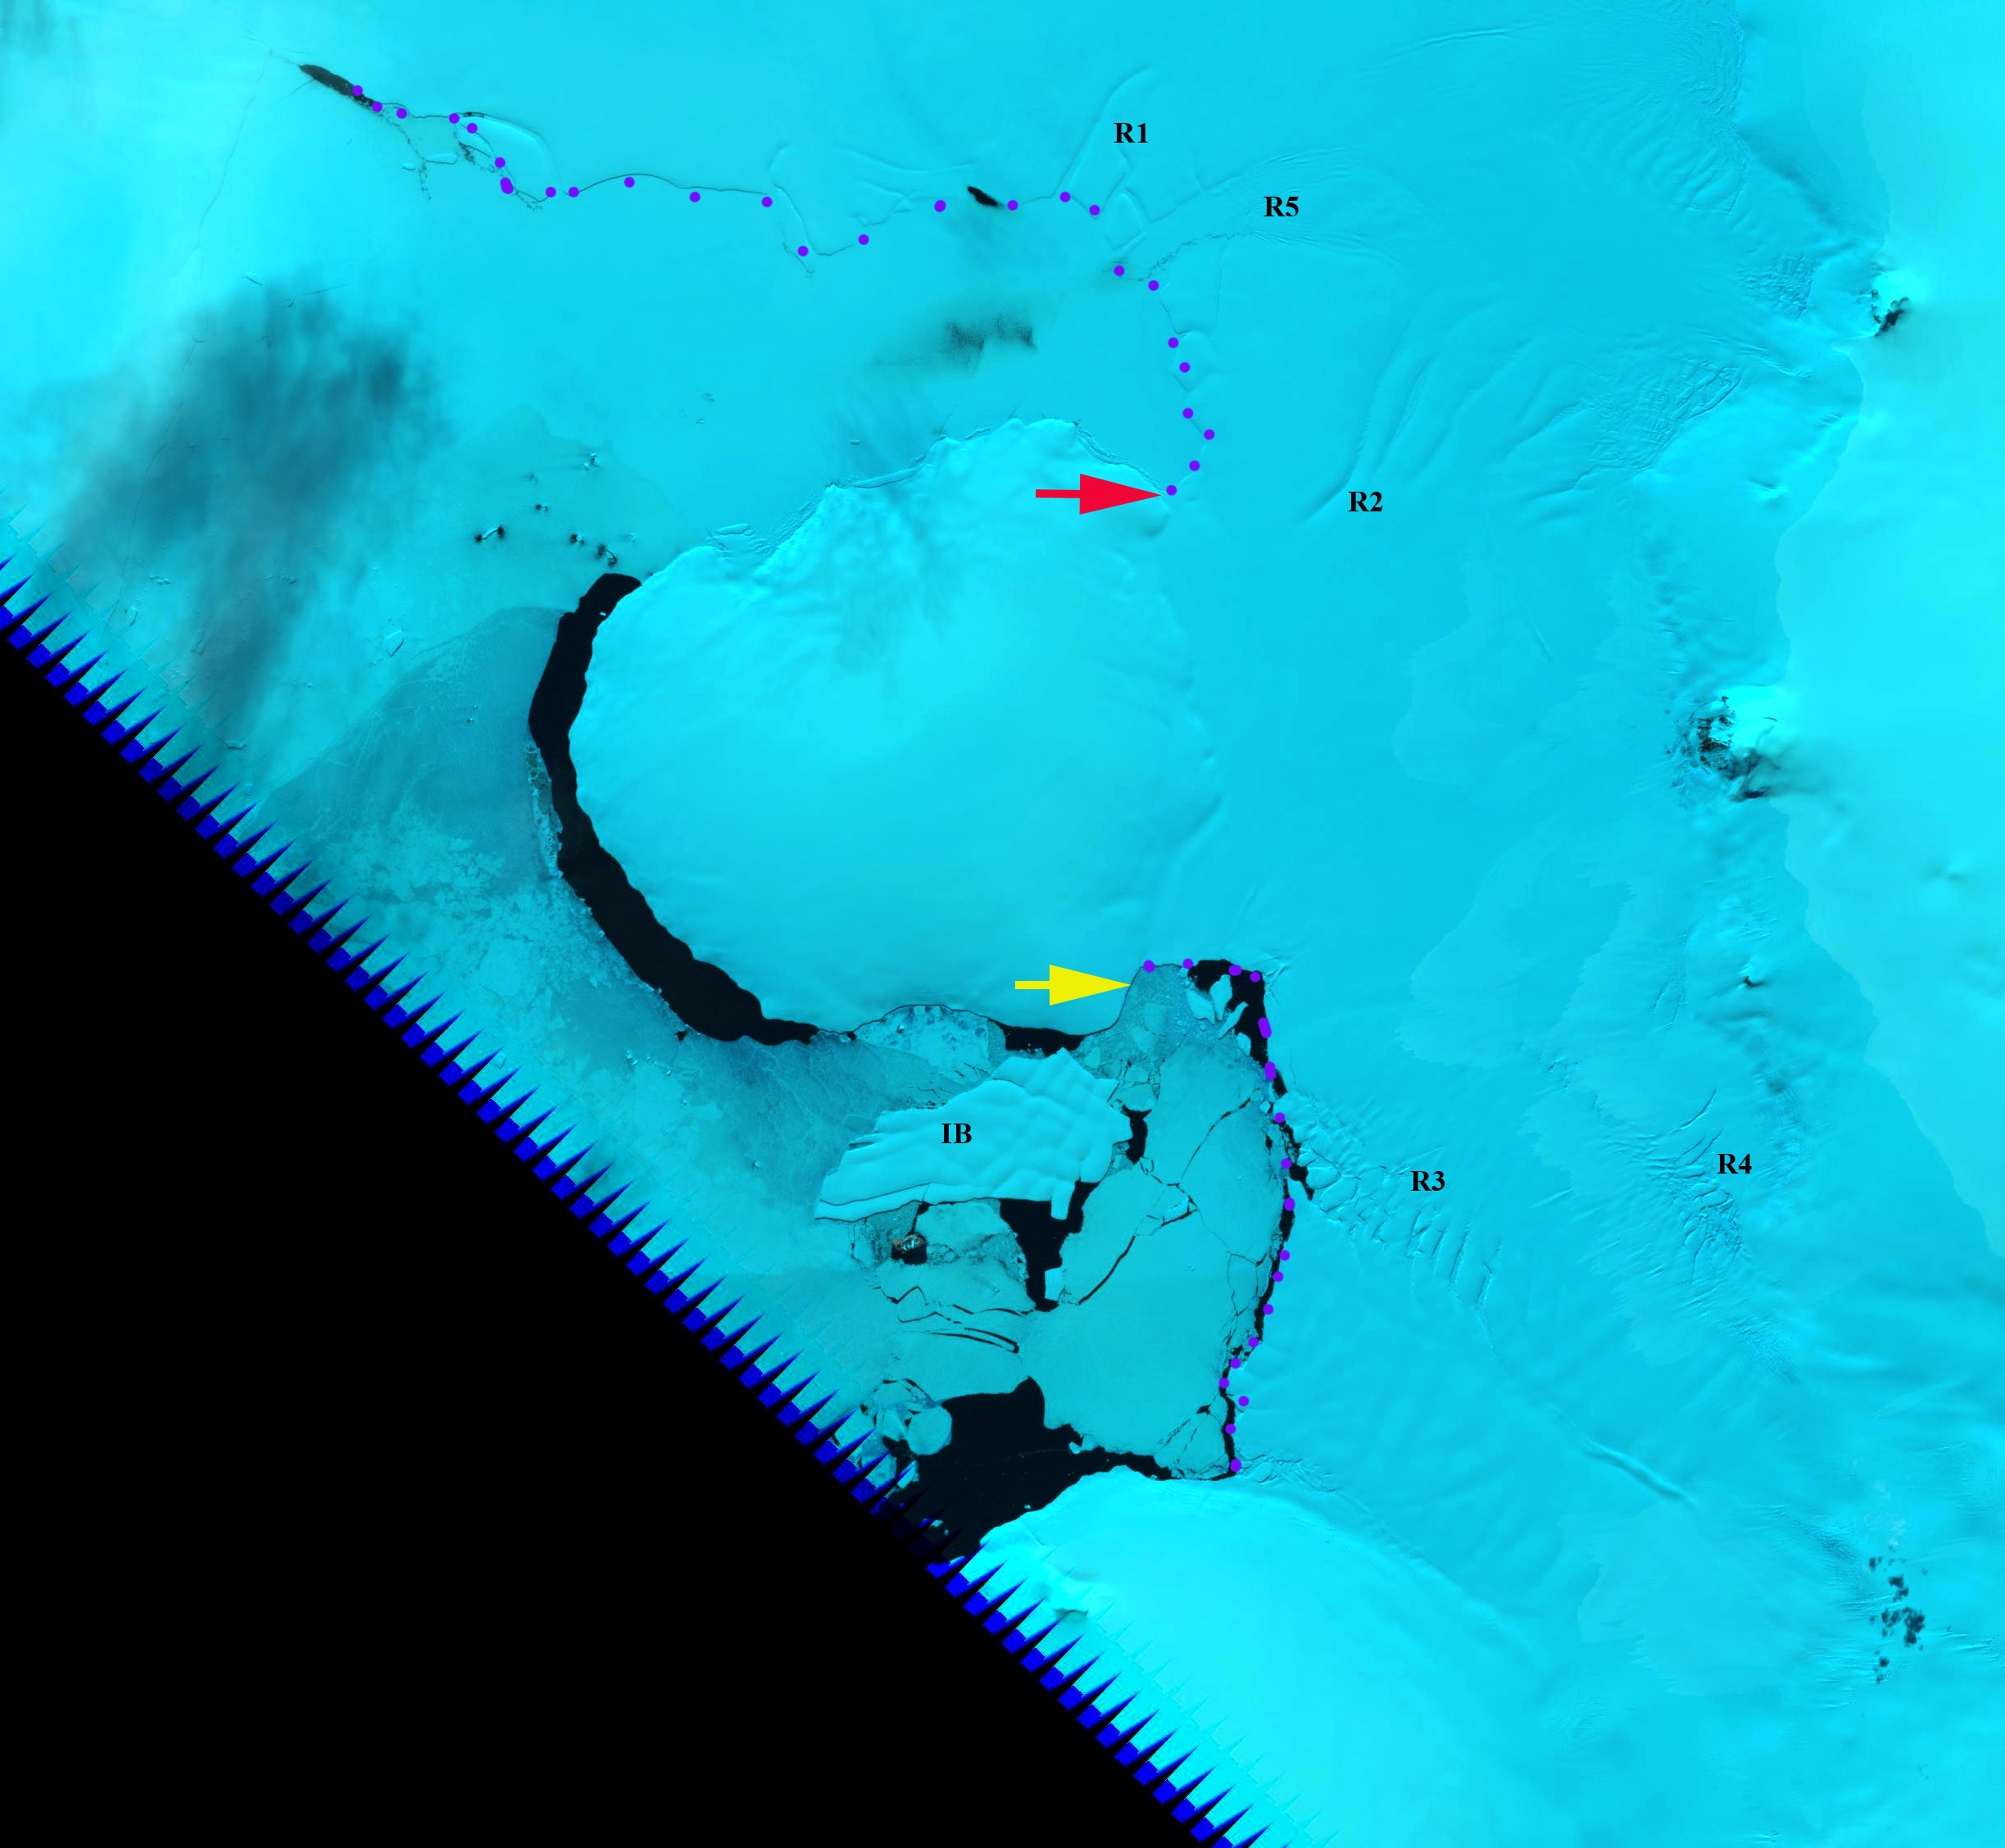
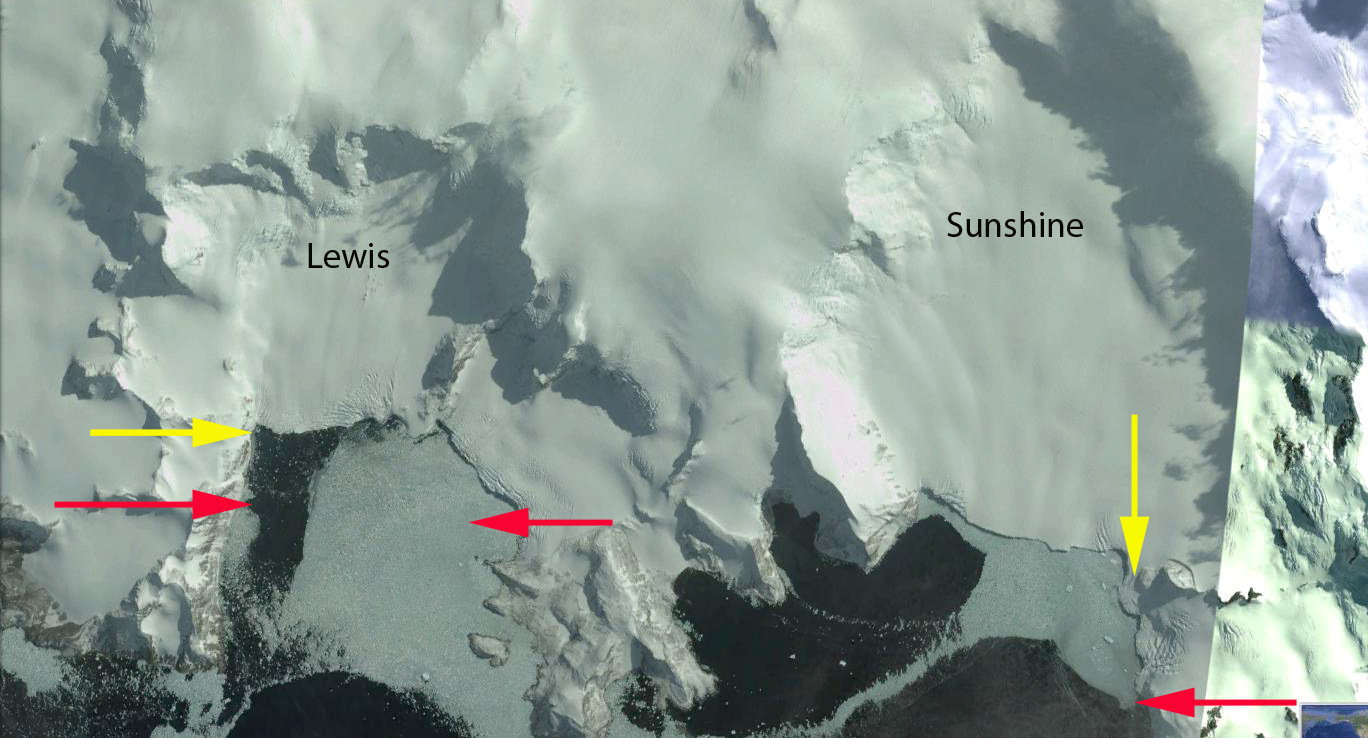
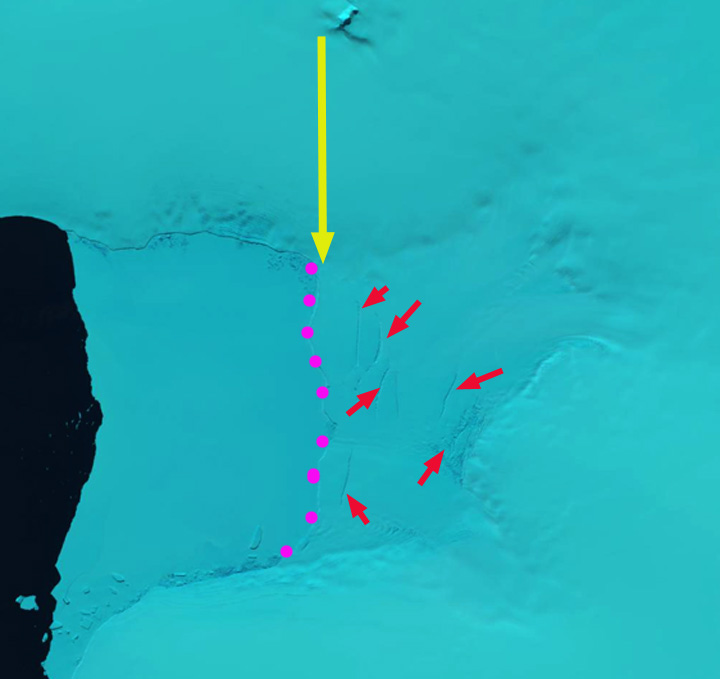
Comparison of the ice front-yellow dots, icebergs-pink arrow and rifting-blue arrow in March 2018 and November 2018 Landsat images. A=Antevs Glacier, B=Bruckner Glacier, H=Humphreys Island and M=Muller Ice Shelf. New iceberg is at the lowest pink arrow adjacent to western calving front.
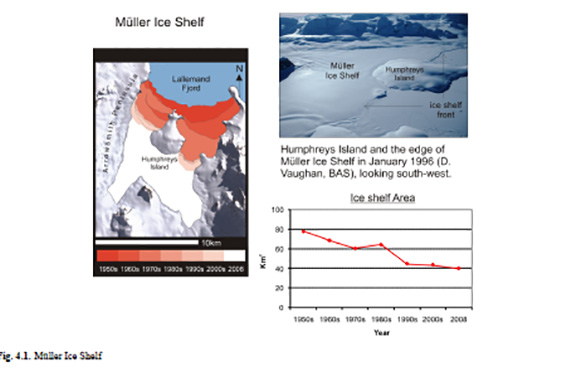
Muller Ice Shelf is on the west side of the Antarctic Peninsula and is one of the smallest remaining ice shelves covering 40 km2 in 2007. It is the northernmost ice shelf on the western side of the Peninsula and is fed by Bruckner Glacier (B) and Antevs Glacier (A), and is pinned on Humphreys Island (H). The glacier advanced from 1947 to 1956 with subsequent retreat until another advance period from 1974-1986 when the ice front advance led to a 4 square kilometer expansion (Cook and Vaughan, 2010). Retreat has since ensued Domack et al. (1995) suggested that warm CDW that is currently within the fjord may be contributing to the rapid bottom melting and retreat of the ice-shelf in recent years. From 1989 to 2017 the western margin has retreated 2.5 km and the eastern margin 1.5 km (Pelto, 2017). Here we use Landsat imagery to identify changes from 2016 to 2018, focussing in particular on a large 2018 calving event. I noticed the iceberg first in the Antarctica REMA Explorer. This is a wonderful viewer for exploring the region. REMA is a Reference Elevation Model of Antarctica that is time stamped and has an 8 m spatial resolution.
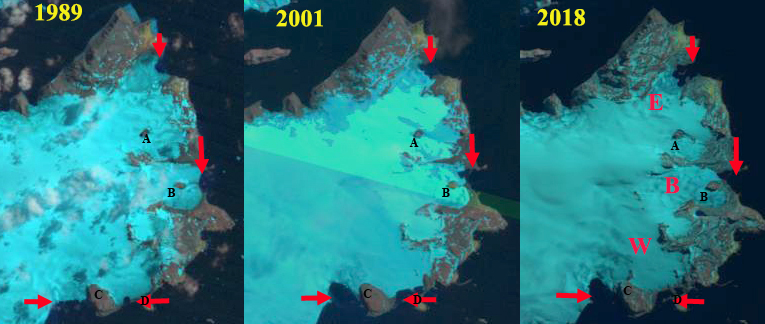
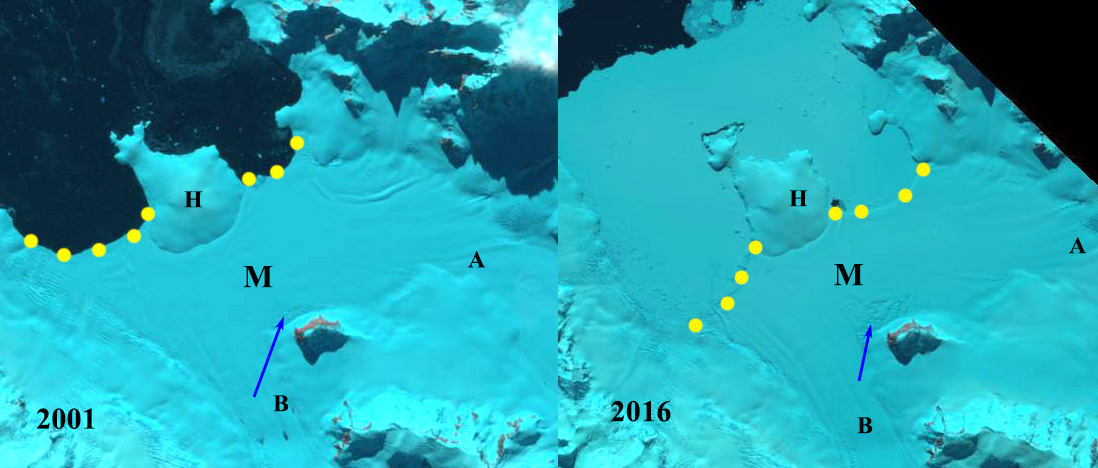
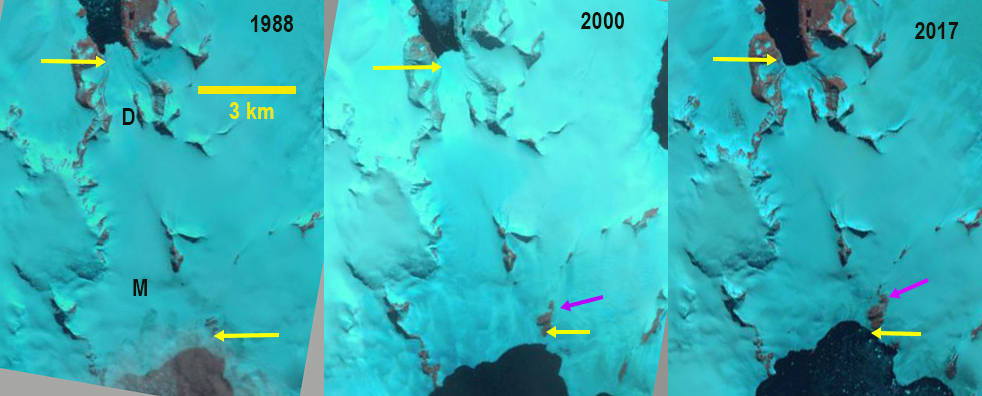
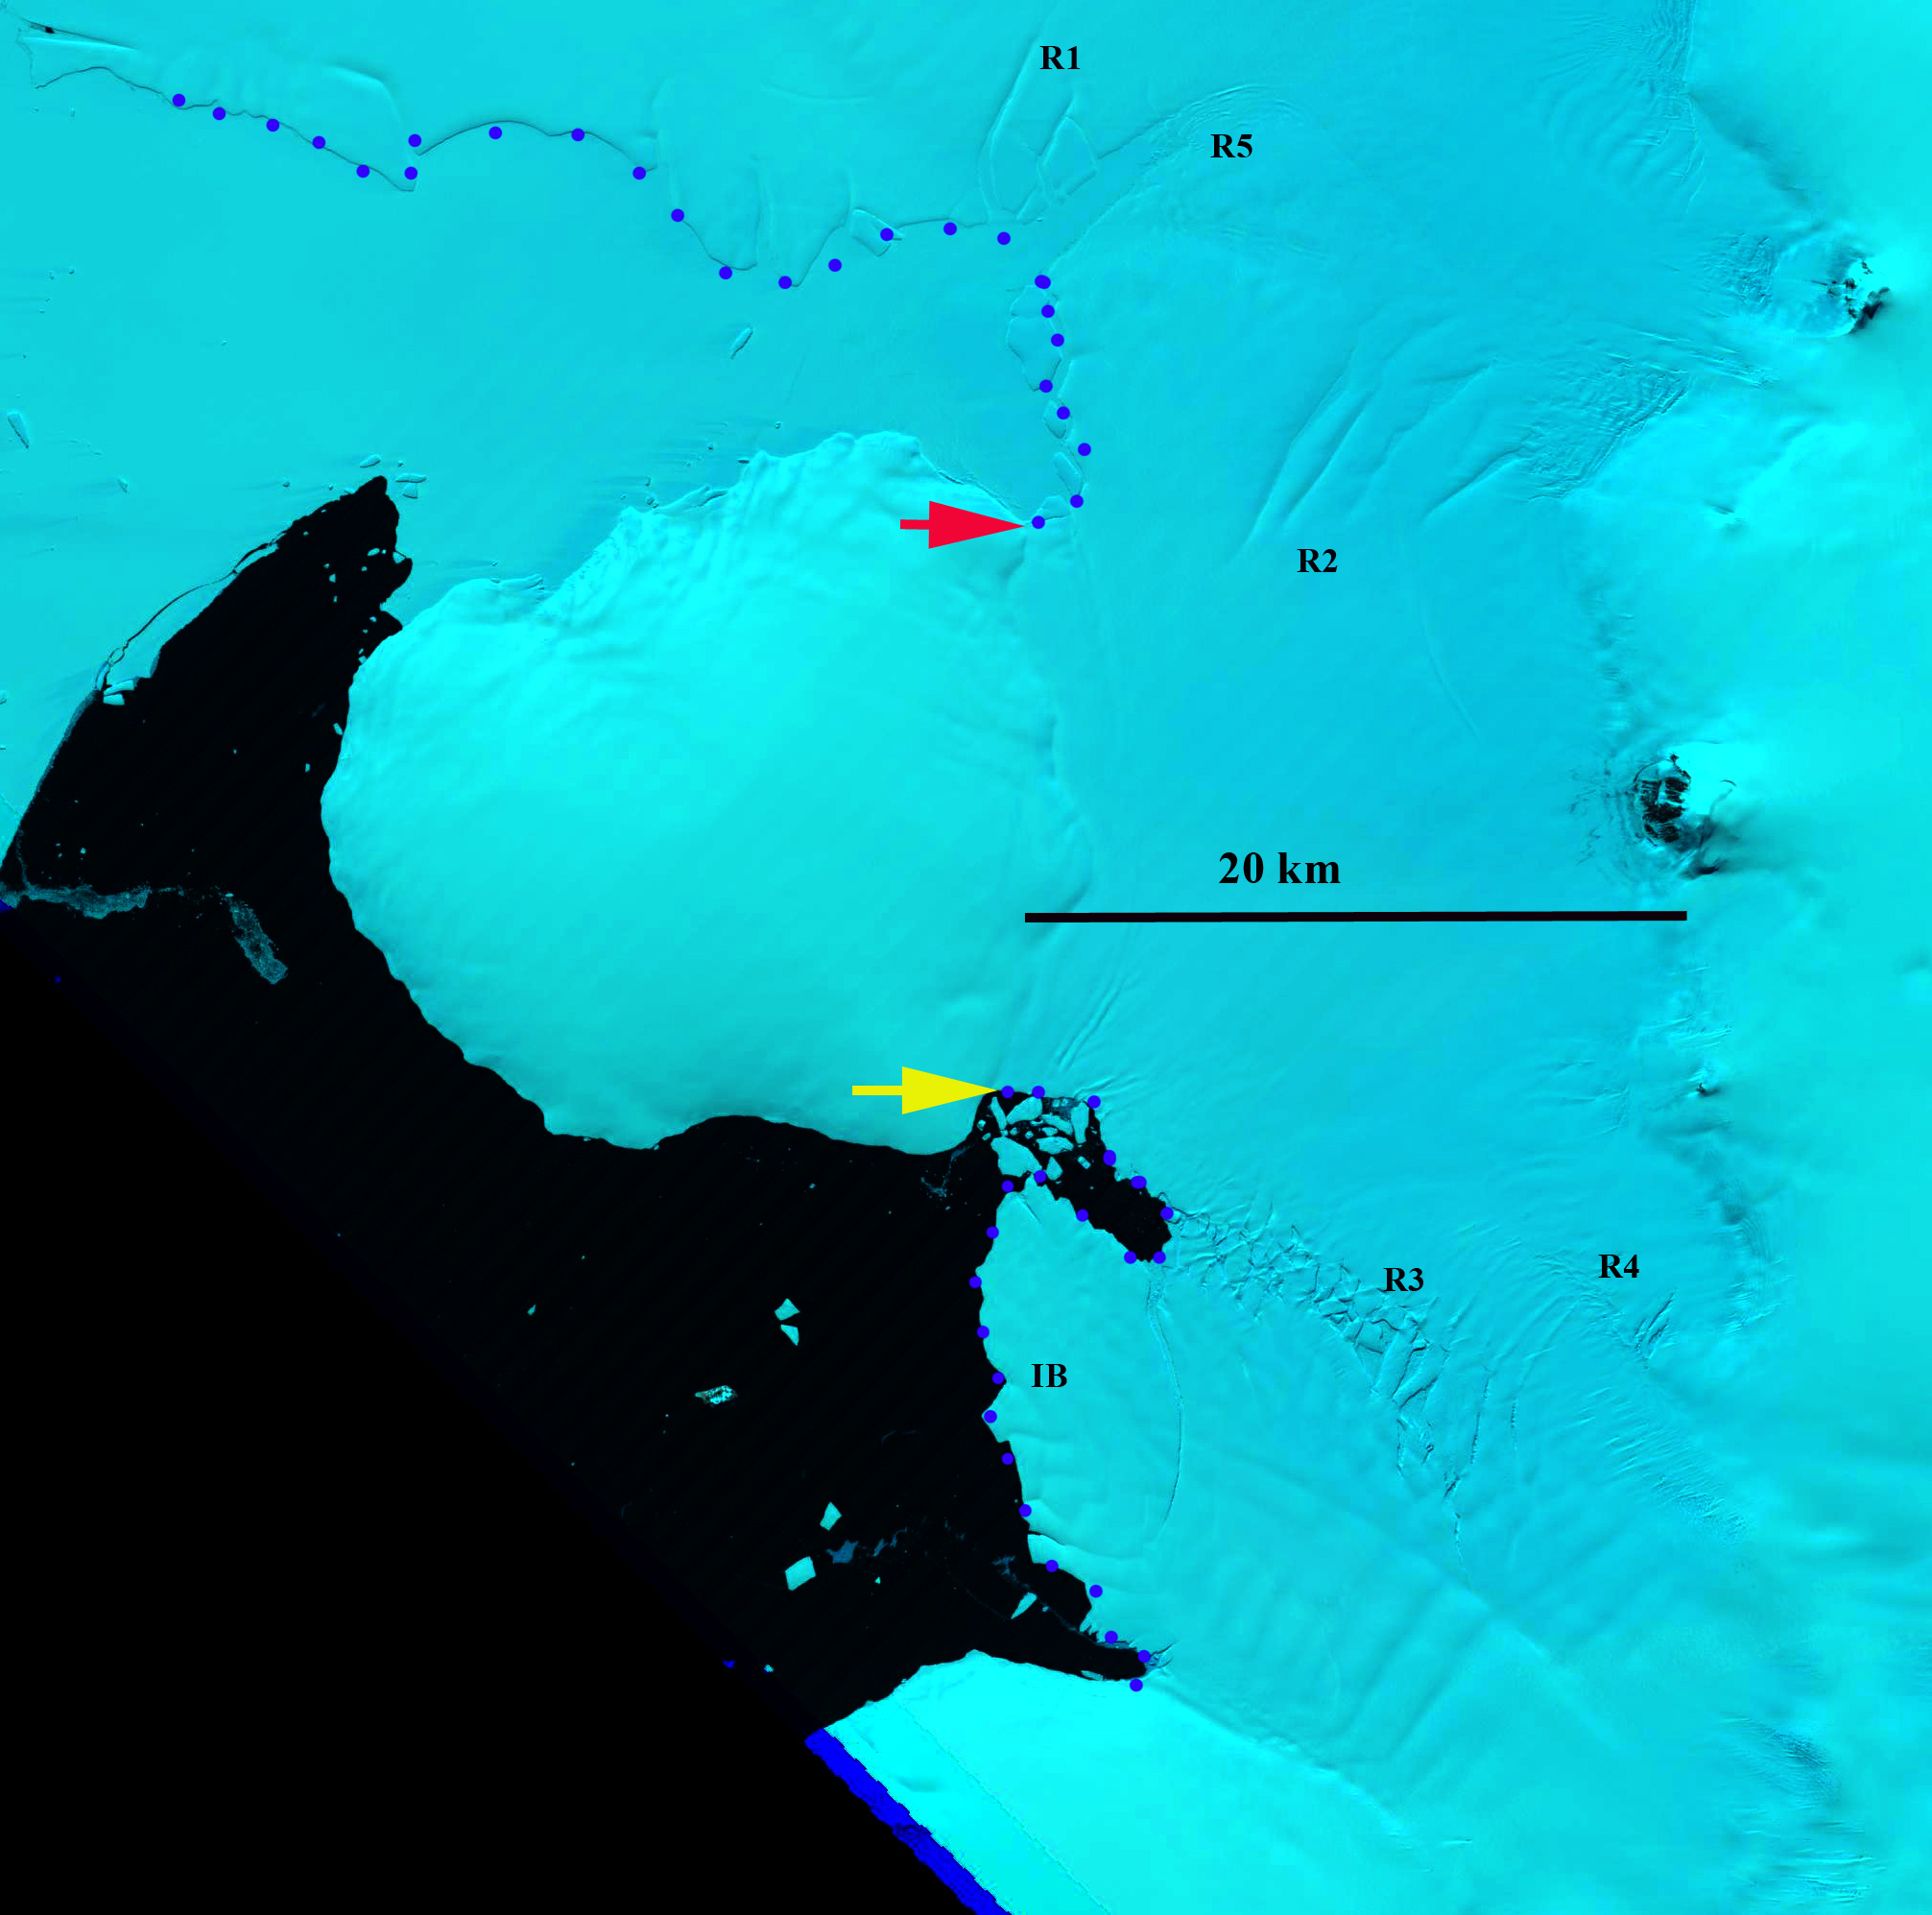
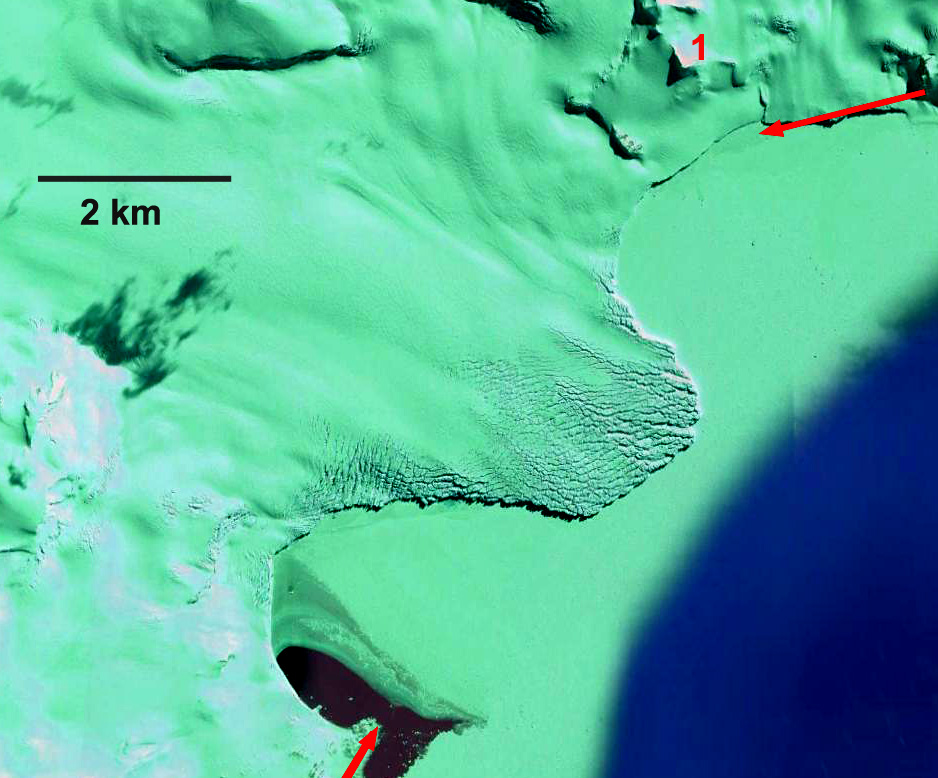
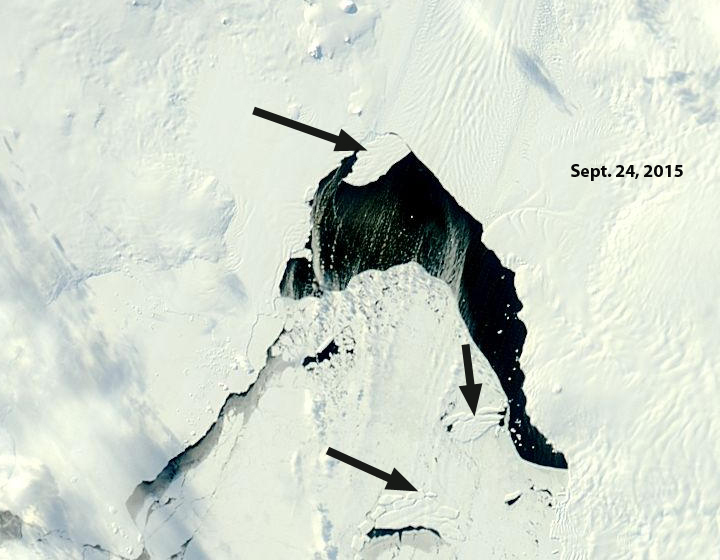
In 2016 the both the eastern and western margin are near the southern end of Humphreys Island, which acts as a pinning point, but this connection is becoming tenuous. Of equal importance is the development of an area of substantial rifting north of the bluff on the southern margin of the ice shelf between Antevs and Bruckner Glacier at the blue arrow. In 2017 the rifting has further expanded, the ice melange now covering an area of ~1 square kilometer. The retreat due to calving is ongoing as indicated by the number of new icebergs in the Feb. 2017 image, pink arrows. In March of 2018 there is one substantial new iceberg several kilometers beyond the western terminus. There is not a significant rift across the western calving front. By Nov. 9, 2018 an iceberg that spans 80% of the western calving front of Muller Ice Shelf has been released. The sea ice is still keeping the iceberg in place adjacent to the calving front. The iceberg is 1.6 km long and 0.4 km wide. This is small by Antarctic standards, but large for the Muller Ice Shelf. The decreased connection to Humphreys Island and the expanding rift area indicates that the Muller Ice Shelf is poised for disintegration like what occurred on nearby Jones Ice Shelf and what is poised to occur on Verdi Ice Shelf.

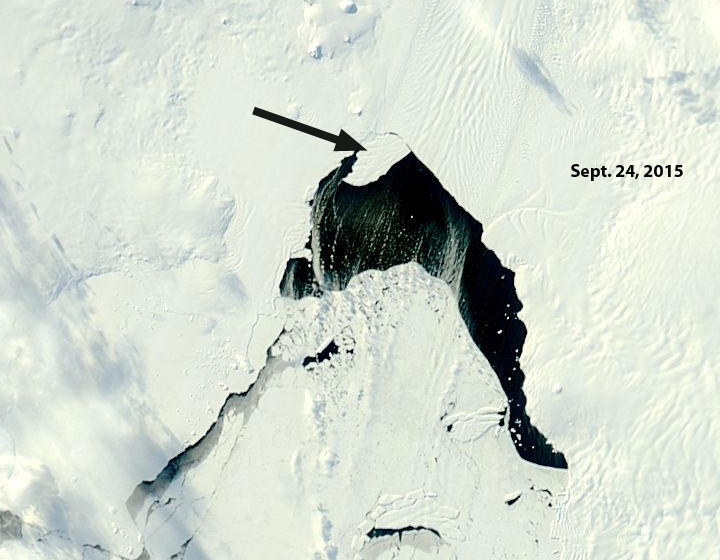
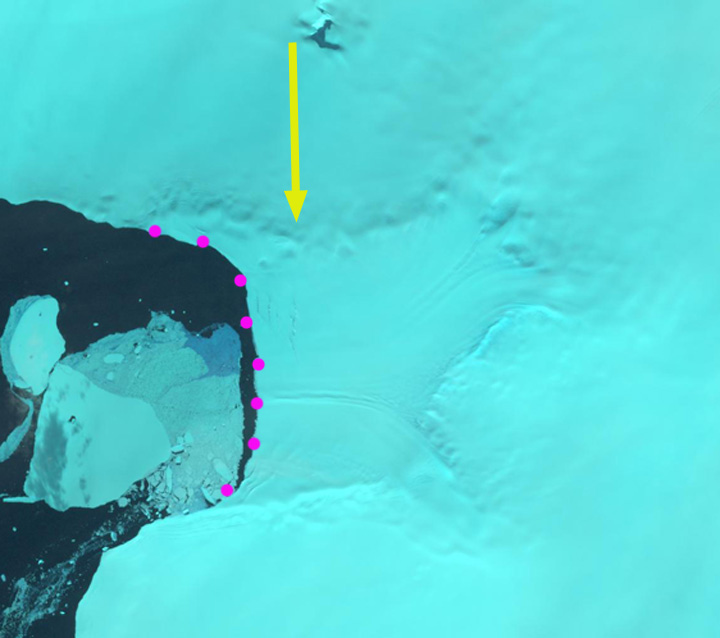
Antarctica DEM explorer view of the new Iceberg from the 11/9/2018 Landsat imagery.
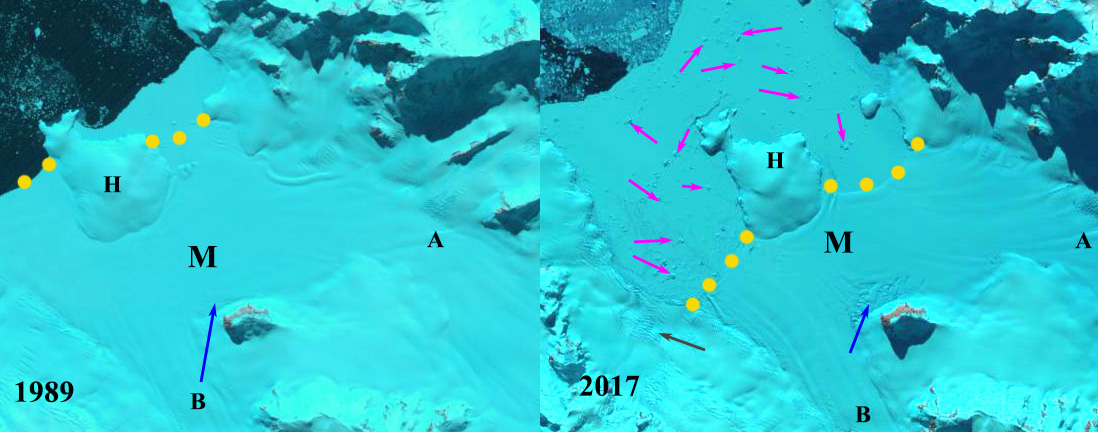
Comparison of the ice front-yellow dots, icebergs-pink arrow and rifting-blue arrow in 2016 and 2017 Landsat images. A=Antevs Glacier, B=Bruckner Glacier, H=Humphreys Island and M=Muller Ice Shelf.


