Snow Free Rocky Mountain Alberta Glaciers in 2025

Bonnet Glacier in Banff National Park in the 9-5-2025 Sentinel image has lost its snow cover in 2025. This is causing rapid expansion of bedrock amidst the glacier as the glacier thins (yellow arrow).

The summer of 2025 featured extensive melt on Alberta glaciers in many cases removing all snow cover. A glacier that cannot retain snow cover is akin to a company have no income, only expenditures for the year. If this trend persists the glacier will not. This builds on a period of glacier loss in the region from 2011-2020 glacier loss accelerated by ~190% from the 1984-2010 period in this region (Bevington and Menounos, 2022). The 2021-2024 period was noted as a period of unprecedented ice loss in Western Canada (Menounos et al 2025). Haig Glacier has been a summer training ground for cross country skiers. This summer by mid-August snow cover was too limited to permit this use, which had happened in 2023 as well. The result in the images below of rapid melt is fragmentation, bedrock emerging amidst glacier and glacier area decline. Here we examine a series of glaciers within 100 km of Banff, Alberta in Sentinel images from September 2025.

Haig Glacier on 9-2-2025. This glacier in Peter Lougheed Provinicial Park has only a sliver of snowcover at the very top of the glacier.
Petain Glacier in Height of the Rockies Provincial Park has a fringe of snow cover left at the top of the glacier in mid-September. The thinning glacier has bedrock emerging amidst the glacier.
Icefall Mountain Glacier on 9-5-2025 has lost all snow cover. This glacier in Siffleur Wilderness Area features expanded bedrock areas amidst the glacier (yellow arrows).
Trifid Glacier in Banff National Park lost its snowcover and is continuing to fragment in this false color Sentinel image.
Drummond Glacier in Banff National Park in early September 2025 has lost 96% of its snow cover this is leading to fragmentation of the glacier.

Willingdon Glacier in Siffleur Wilderness Area lost all but a sliver of snow cover in 2025. The rapid thinning bare glacier ice is leading to fragmentation at yellow arrow.

Macbeth Icefield, BC Loses Bare of Snow Cover in 2025: Adjacent Small Glaciers Vanished

Macbeth Icefield, BC in false color Sentinel image from 9-25-2025. Bare of snow cover reveals annual layers within firn, darkened by dust and forest fire partical deposition. Small glaciers A,B,C and E have vanished.

Macbeth Icefield is the Purcell Mountains of southwestern British Columbia. The several icefield outlet glaciers drain into Duncan Lake the Duncan River and then Kootenay Lake. From 2011-2020 glacier loss accelerated by more tha 250% from the 1984-2010 period in this region (Bevington and Menounos, 2022). The 2021-2024 period was noted as a period of unprecedented ice loss in Western Canada (Menounos et al 2025). The summer of 2025 was even worse. Access to the Macbeth Icefield Recreation Area is currently closed due to extensive forest fire impact to the long hiking trail that accesses the icefield (images below illustrate the burn scars).

I have had the opportunity to review satellite images of this area from 1984-2025. In 2025, for the first time the icefield lost all snow cover exposing many annual layers of firn. The firn is snow that endured at least one summer, and is not yet converted to glacier ice. This firn is signficantly darkened by particles of dust and forest fire derived material. This further enhances melt once exposed.

In 2023 and 2024 significant firn areas were exposed as well, in the sequence of images below. . The repeated years of limited snow cover has led to mass balance loss and a 25-30% reduction in icefield area since 1987. From 1987-2025 several small adjacent glaciers have been lost A,B, C and E. t Point D the glacier has fragmented. At Point F the glacier ended in the lake in 1987 and now the glacier has retreated 700 m from the lake.

Macbeth Icefield in 1987 and 2025 Landsat images indicating recession of icefield margin, loss of snowcover and vanished small glaciers A,B,C and E.
A 2024 forest fire burned extensive areas in the Birnam Creek valley that drains the southern end of the icefield. The 2023 image illustrated the consistent red of forest, with the brown areas at the yellow arrows indicating burn scars.
Macbeth Icefield in Sentinel image from 9-1-2023. Extensive firn area is exposed, while 30% of the icefield has retained snow cover.
Macbeth Icefield in Sentinel image from 9-5-2024. Extensive firn area is exposed, while 20% of the icefield has retained snow cover.
Macbeth Icefield in Sentinel image from 9-25-2025. The lack of snow cover is evident.

Coronation Glacier New Island Development-Baffin Island

coronation-glacier-island-development-scaled

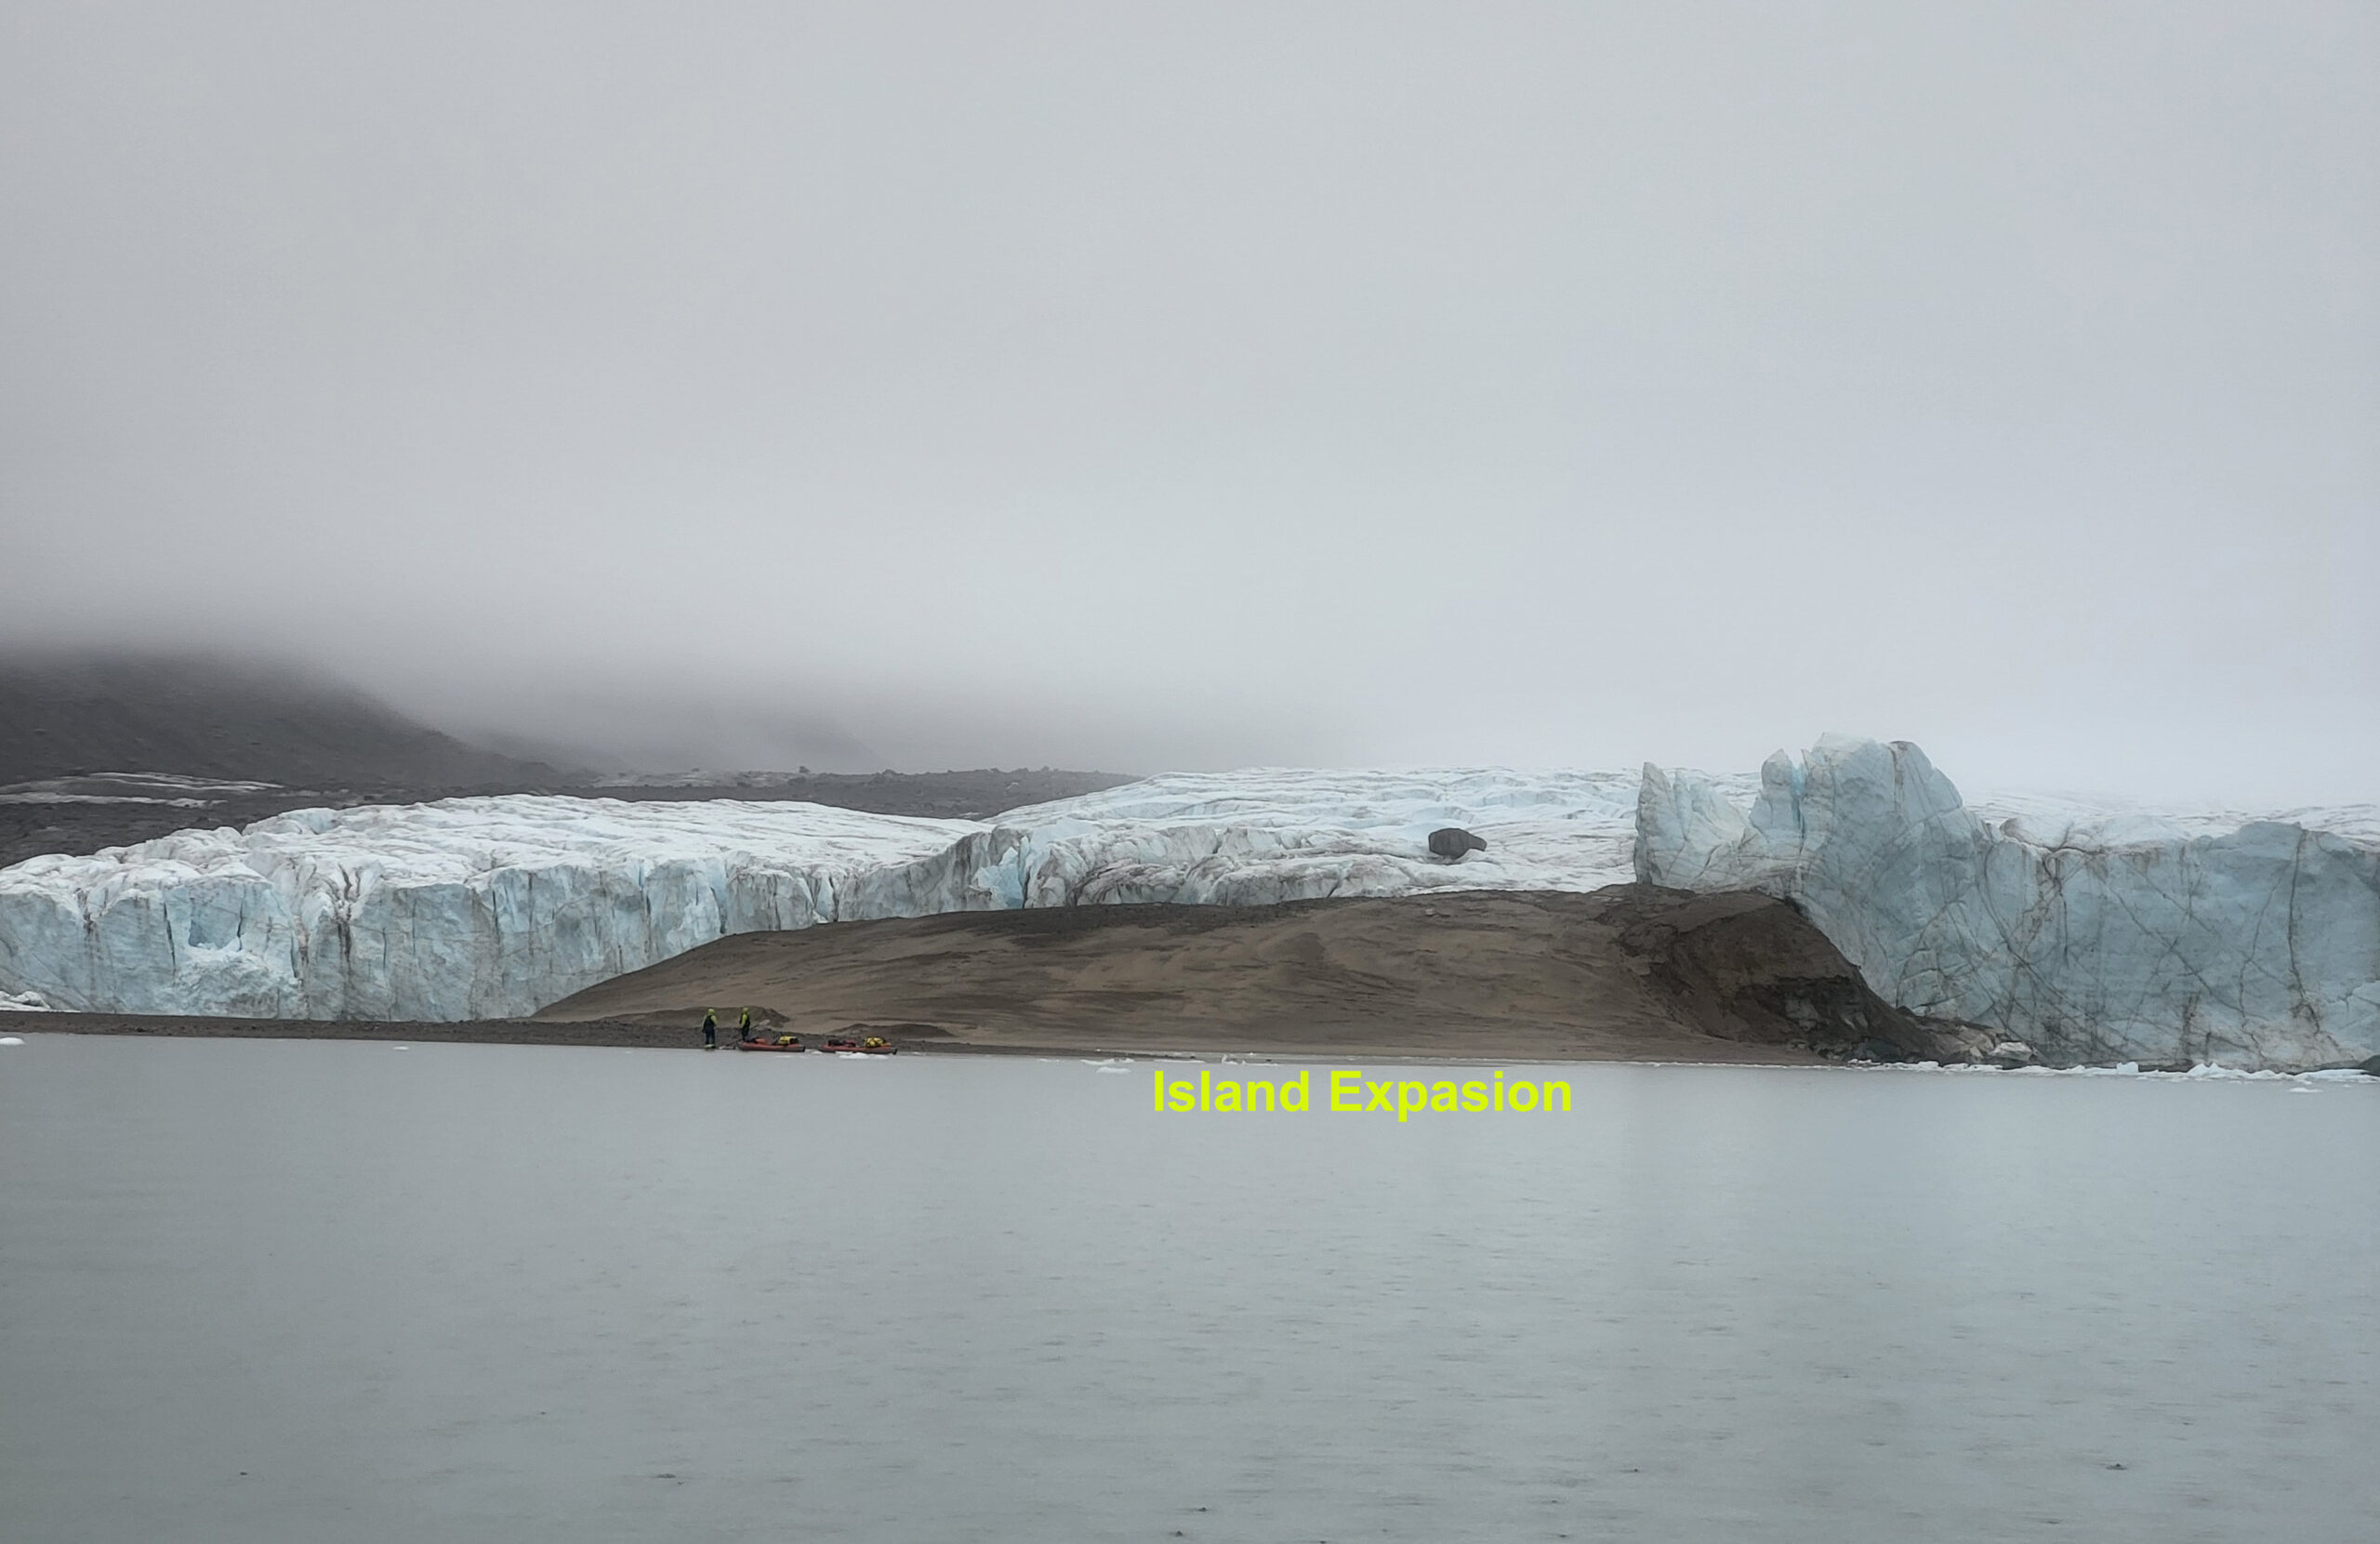
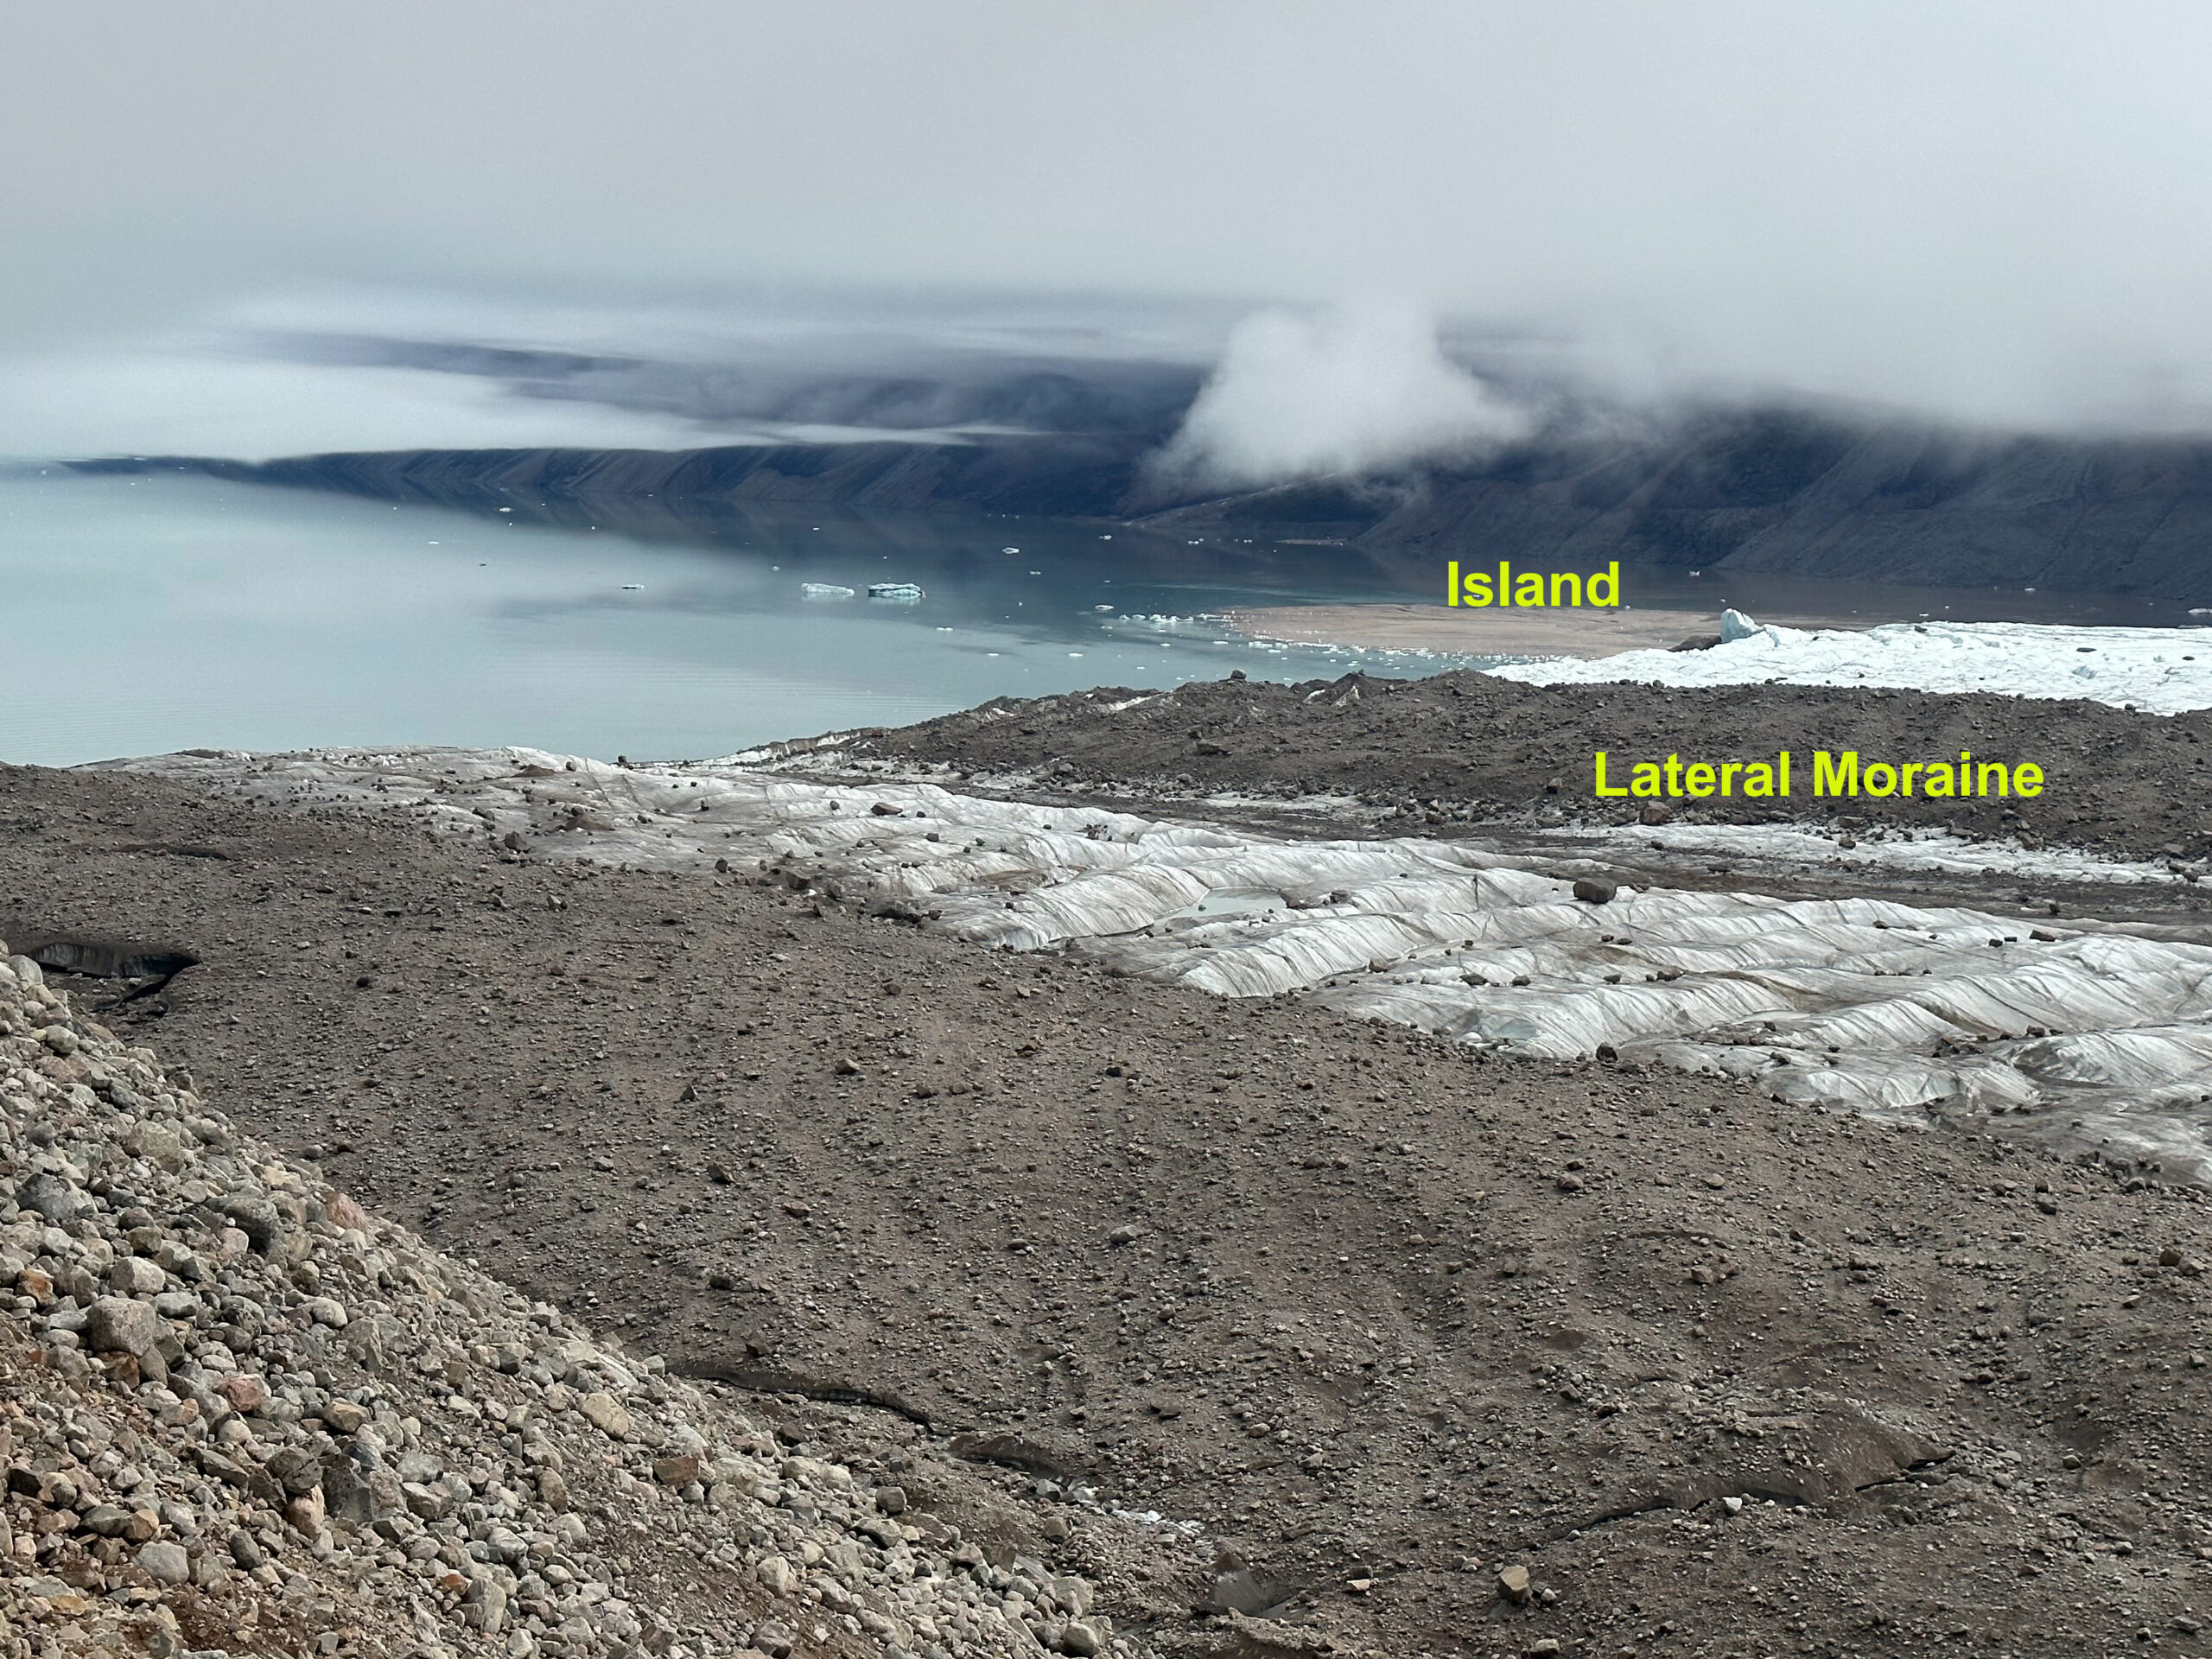
This is a portion of the island emerging from beneath the terminus with the 20-50 m high ice front in July 2023, the main portion of the island extends to the left and then out from the glacier. (Bischke/Biner/Bessen/Klemmensen)

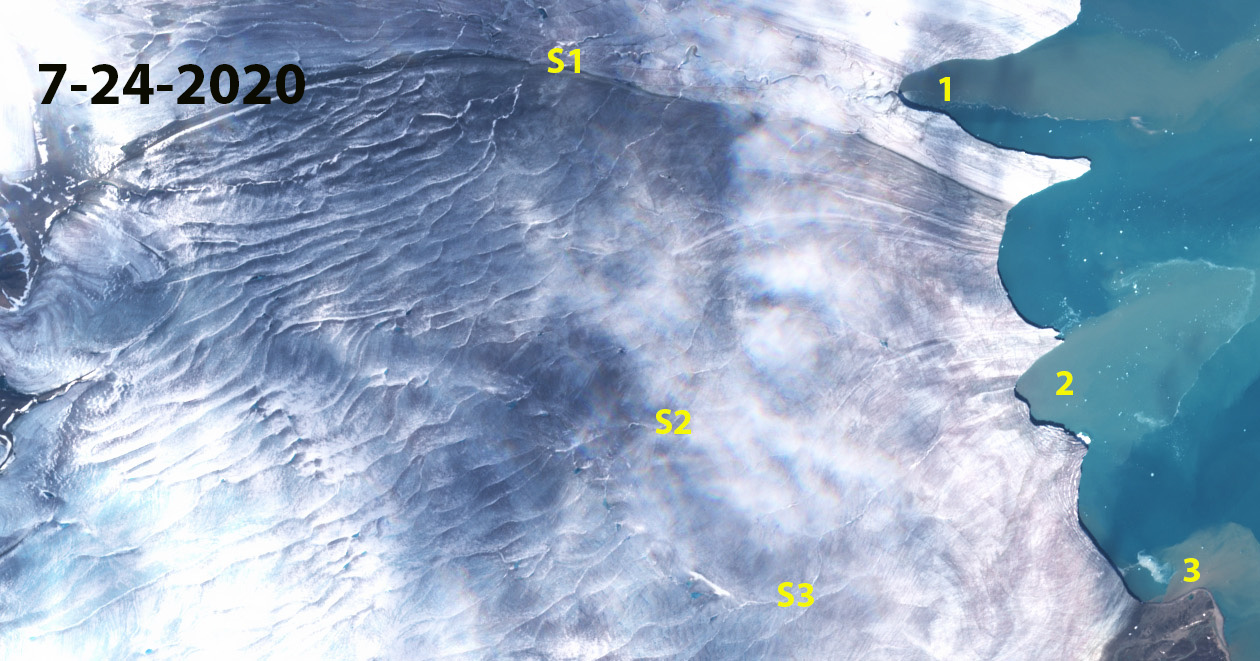
Coronation Glacier is the largest outlet glacier of the Penny Ice Cap on Baffin Island. The glacier has an area of ~660 square kilometers and extends 35 km from the edge of the ice cap terminating in Coronation Fjord. Retreat from 1989 to 2023 has been 1050 m on the northern side of the fjord and 900 m on the south side of the fjord. The average retreat of 975 m in 33 years is ~30 m/year, much faster than the 1880-1988 period. Locations 1-9 are tributaries that have each narrowed or retreated from the main stem of the glacier. I reported on a new island forming at the terminus in 2016, and I have been hoping to identify someone who would visit the island. The island now has an area of 0.25 km², its character is evident in images below. Amanda Bischke reached out on behalf of a four person climbing team heading into the area this summer. In mid-July the team had reached the front of the glaciers and over the next 20 days explored the glacier and its tributary. Here I analyse images taken by the team of Amanda Bischke, Shira Biner, Noah Bessen and James Klemmensen in conjunction with Sentinel images. One striking aspect of the Sentinel image from August 16, 2023 is how the snowline is on the ice cap feeding tributary 1-3 at 1500 m. This has become a common theme, and is resulting in less flow from the ice cap down these tributaries leading to detachment. Tributary 1, 3 and 6 have separated from the main glacier, while Tributary 2,4,7 and 9 have detachments nearly or completely severing the glacier enroute to the main glacier.

I appreciate the collaboration with the climbing party who have posted an initial report, I will update when further reports are published. Of their four first ascents, The Drawbridge was a visually compelling line to me. If you are heading out into a seldom visited glaciated area on a climbing expedtion reach out and see what would be valuable to observe. We can see overall changes from satellite imagery, but not the details. Two examples here are what the surface of the island is composed of, sand and small rocks in this case, or a developing detachment such as at the chasm are not evident from satellite imagery.

coronation glacier 2017-2023

As the glacier retreats the Island continues to expand from 2017-2023. The tributaries I hoped the climbing team  could document where possible if they were still attached.

coronation-terminus-from-island-scaled
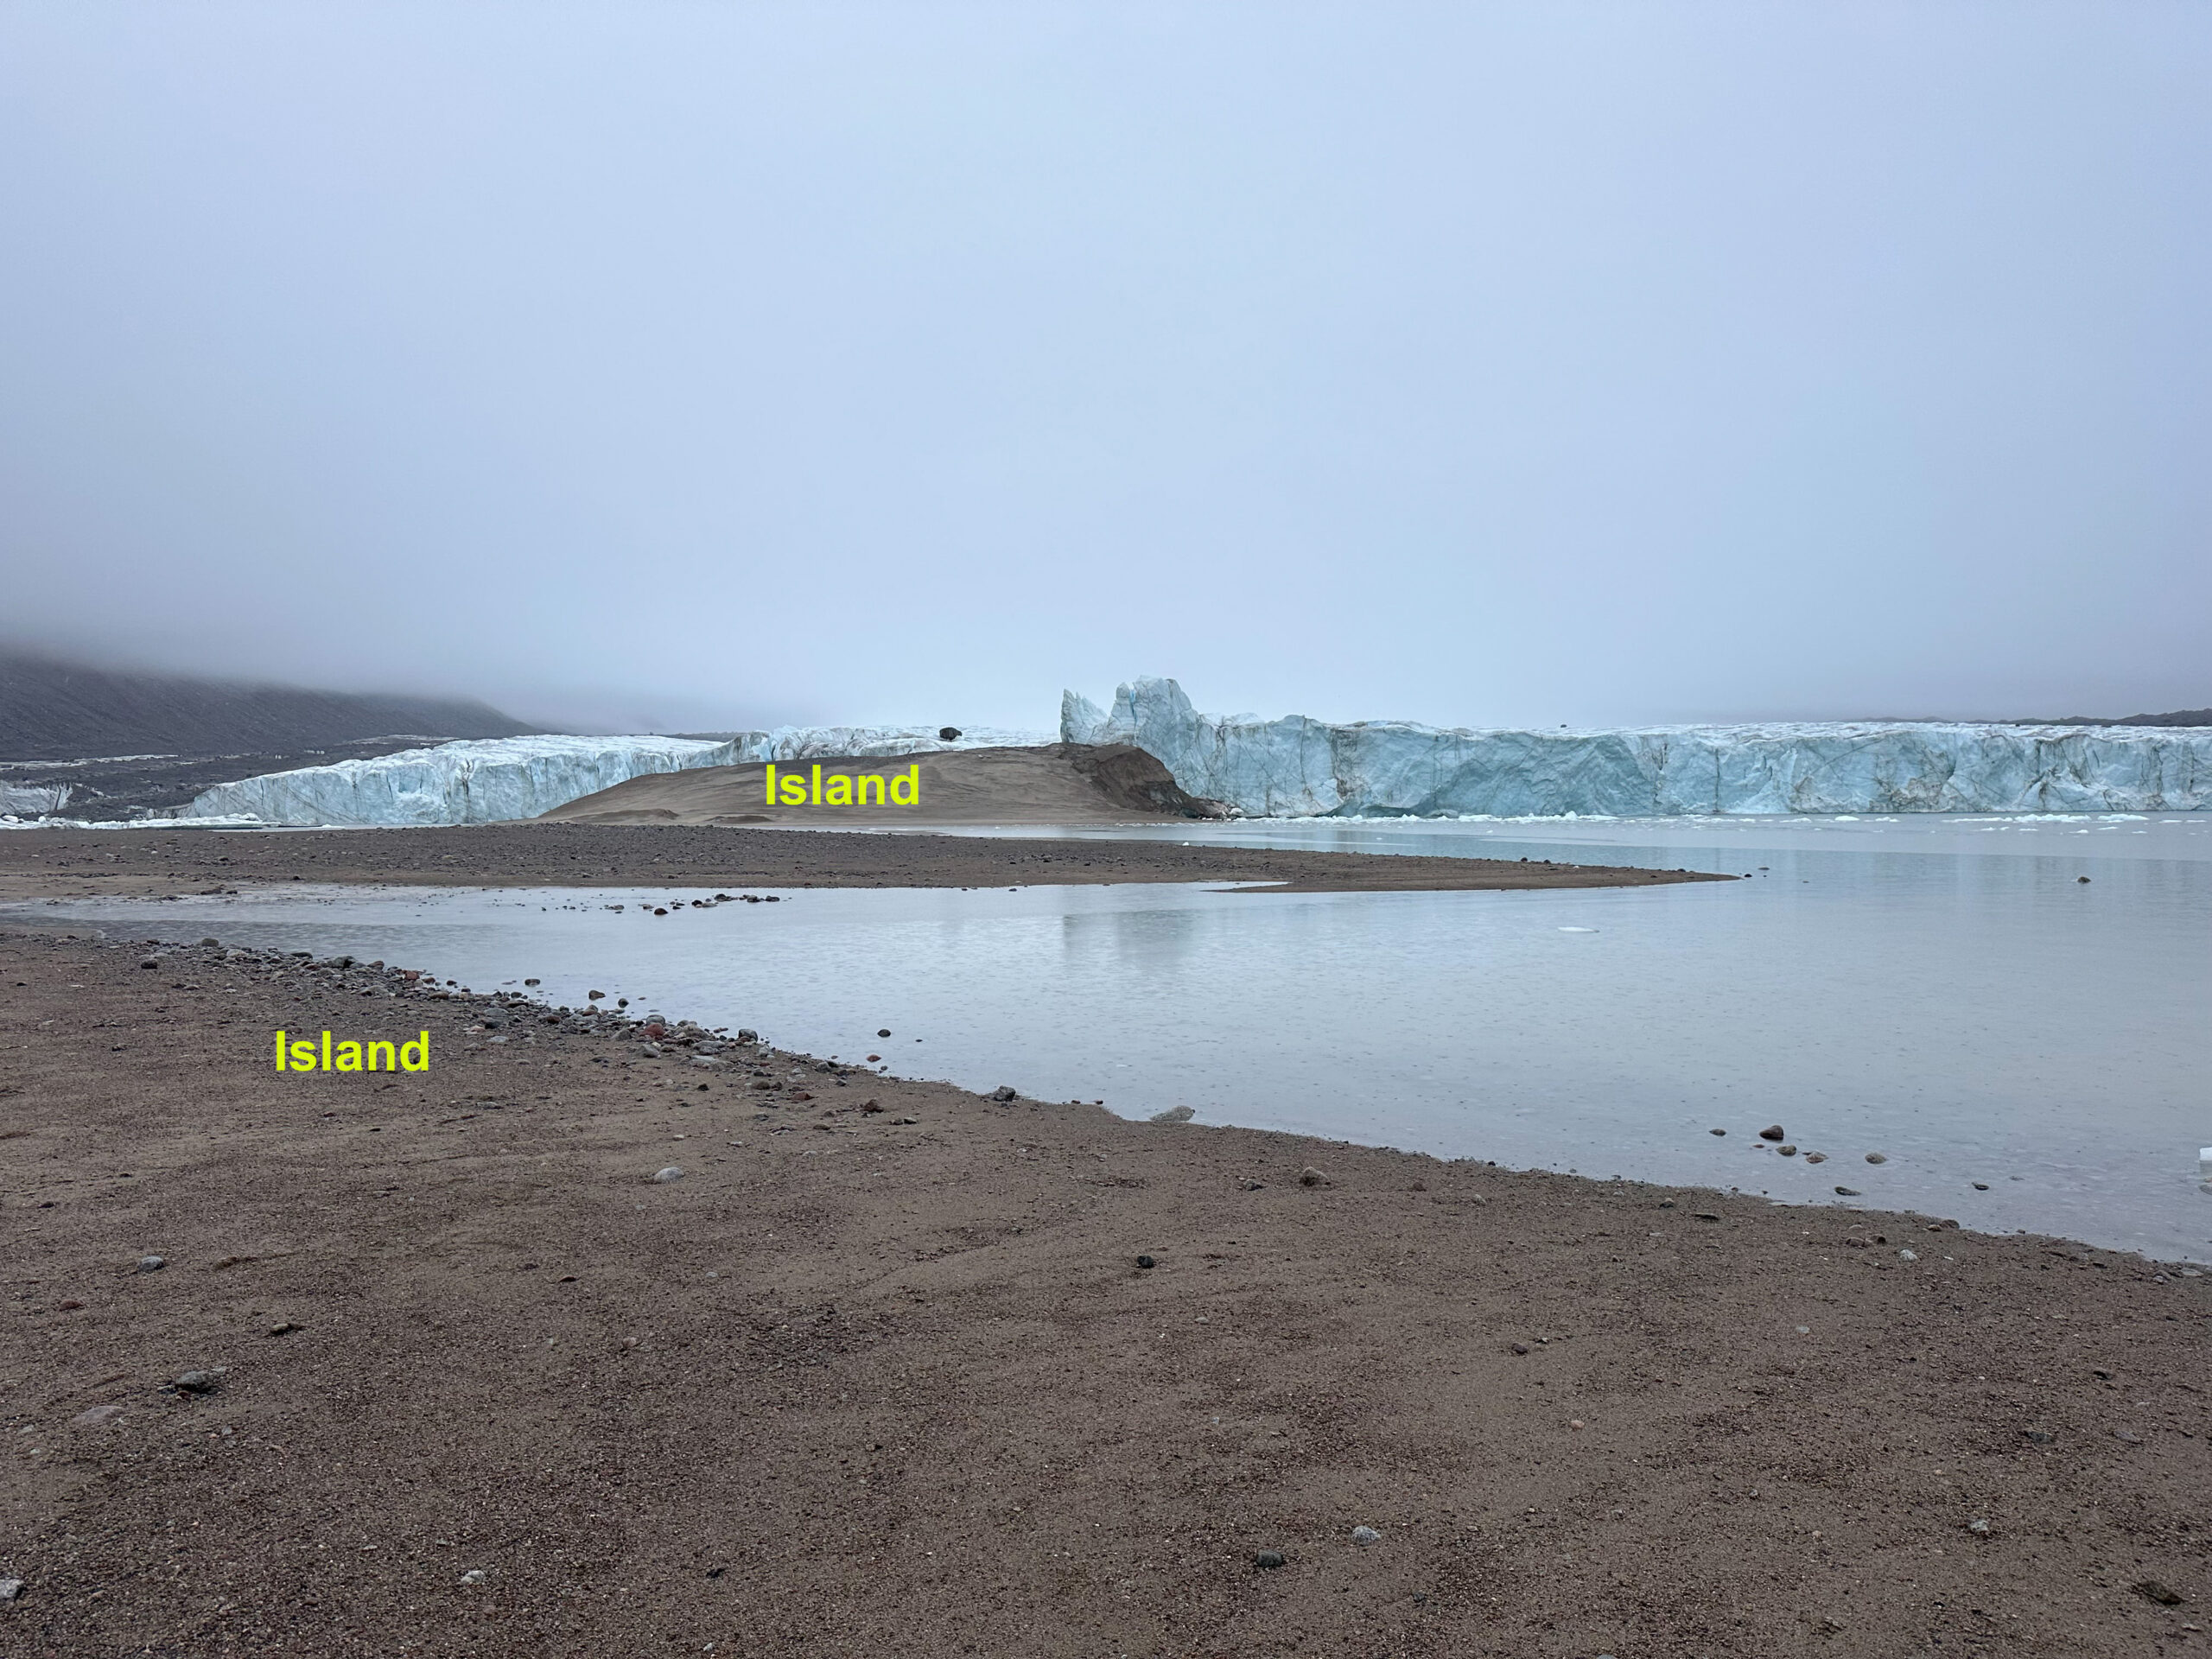
The climbing team visiting the oldest part of the island looking toward newest part (Bischke/Biner/Bessen/Klemmensen)

island-from-coronation-glacier-scaled

A view of the island from the north side of Coronation Glacier (Bischke/Biner/Bessen/Klemmensen)

island 2017-2023

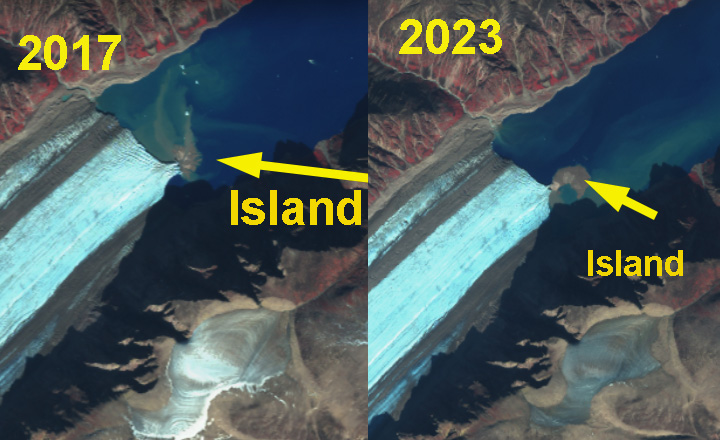
Sentinel image of the expanding island at the Coronation Glacier terminus in Sentinel images.

tributary 1c

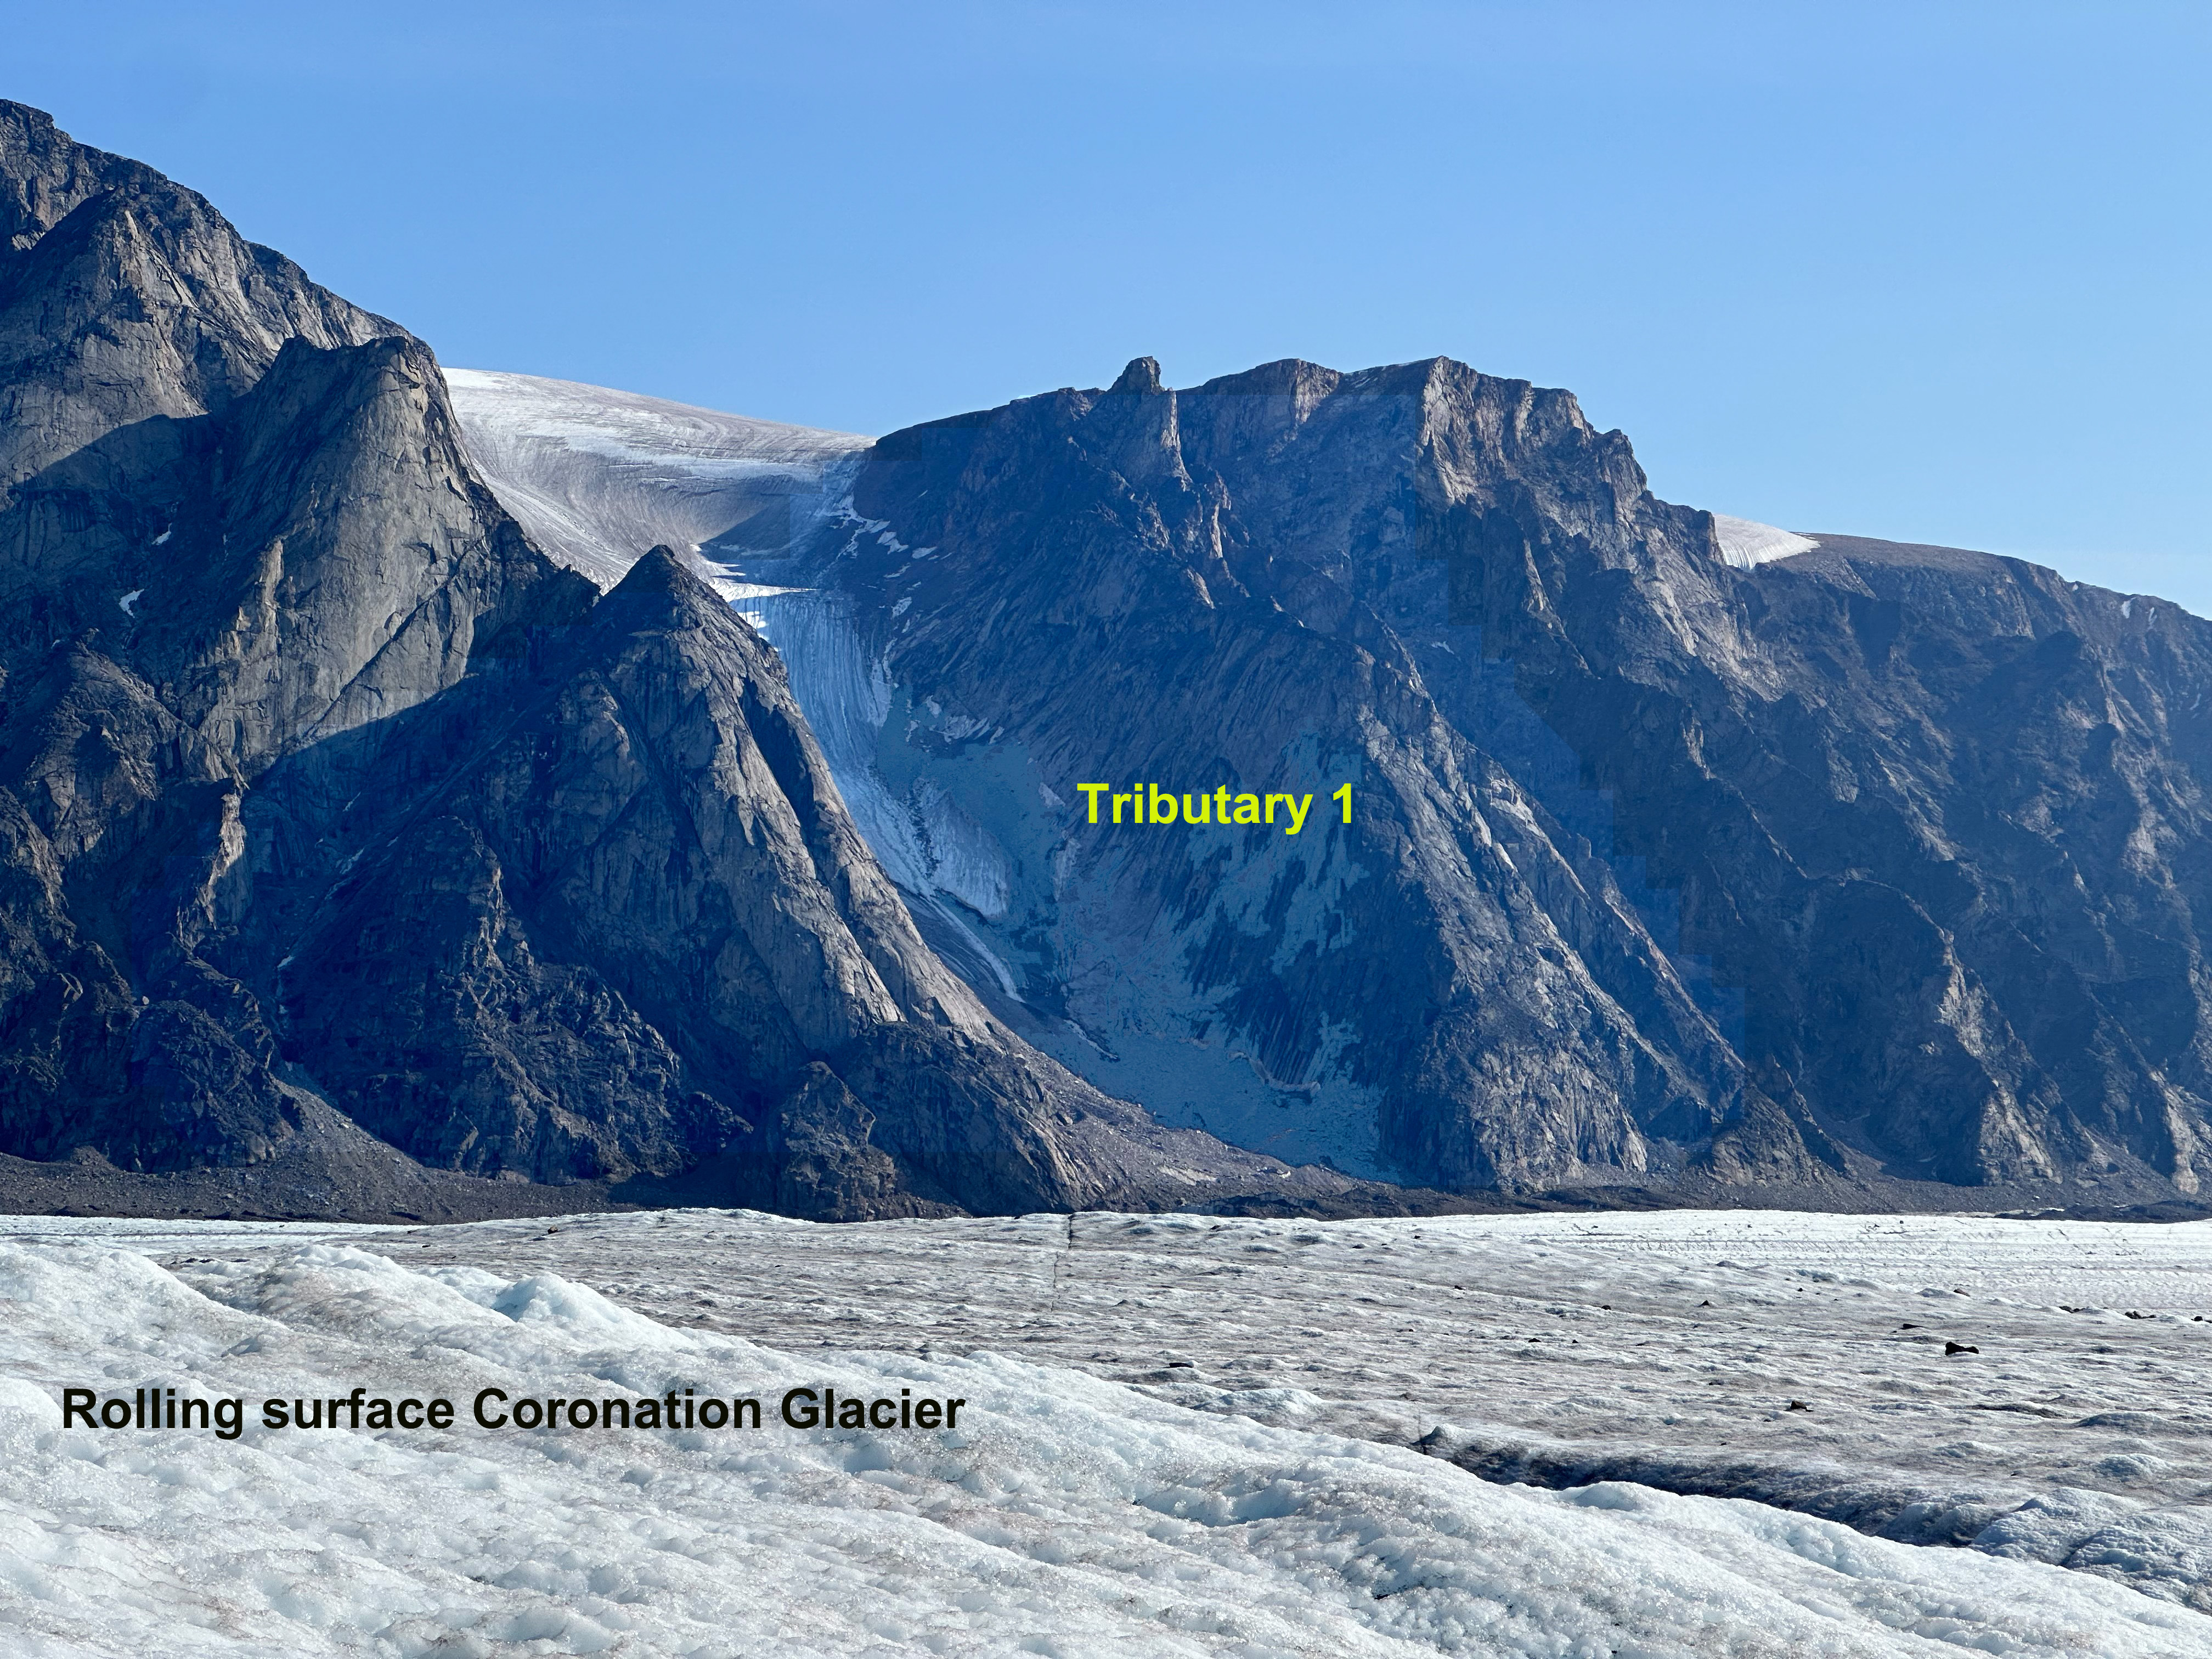
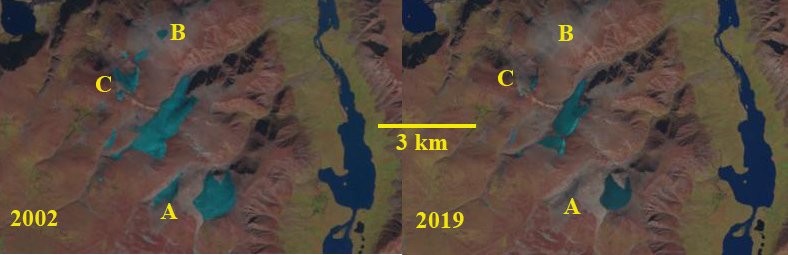
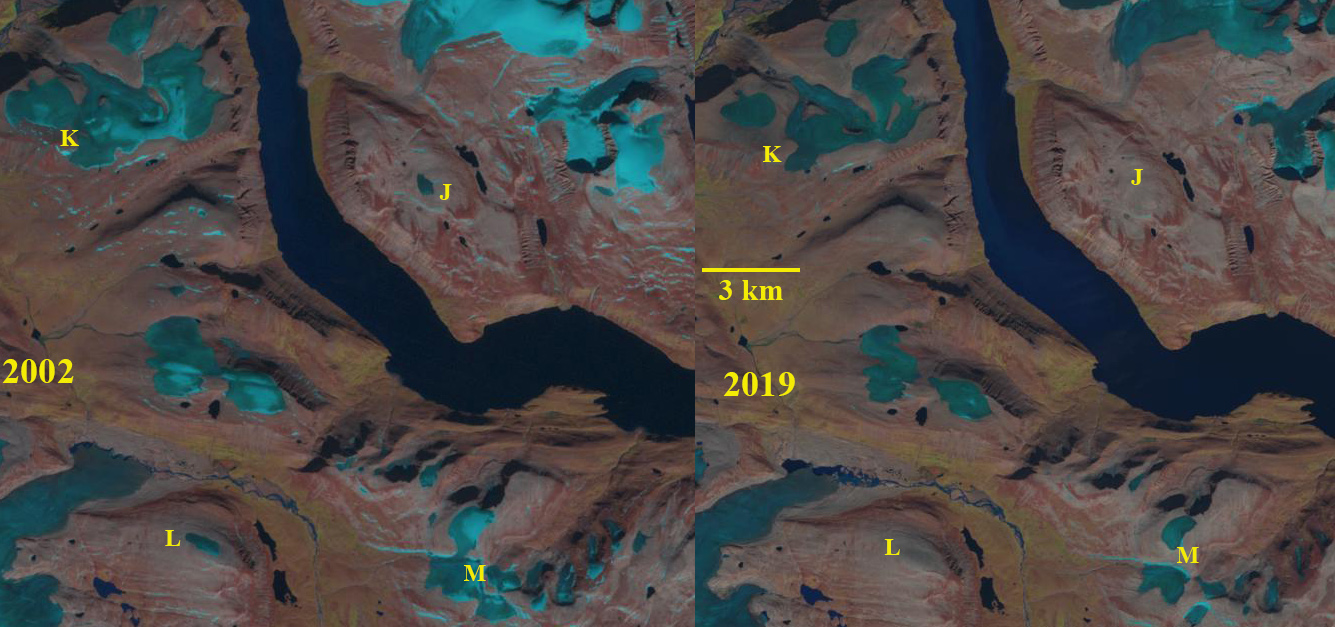
Tributary 1 detached from main glacier, note high snowline (Bischke/Biner/Bessen/Klemmensen)

tributary 2 and 3

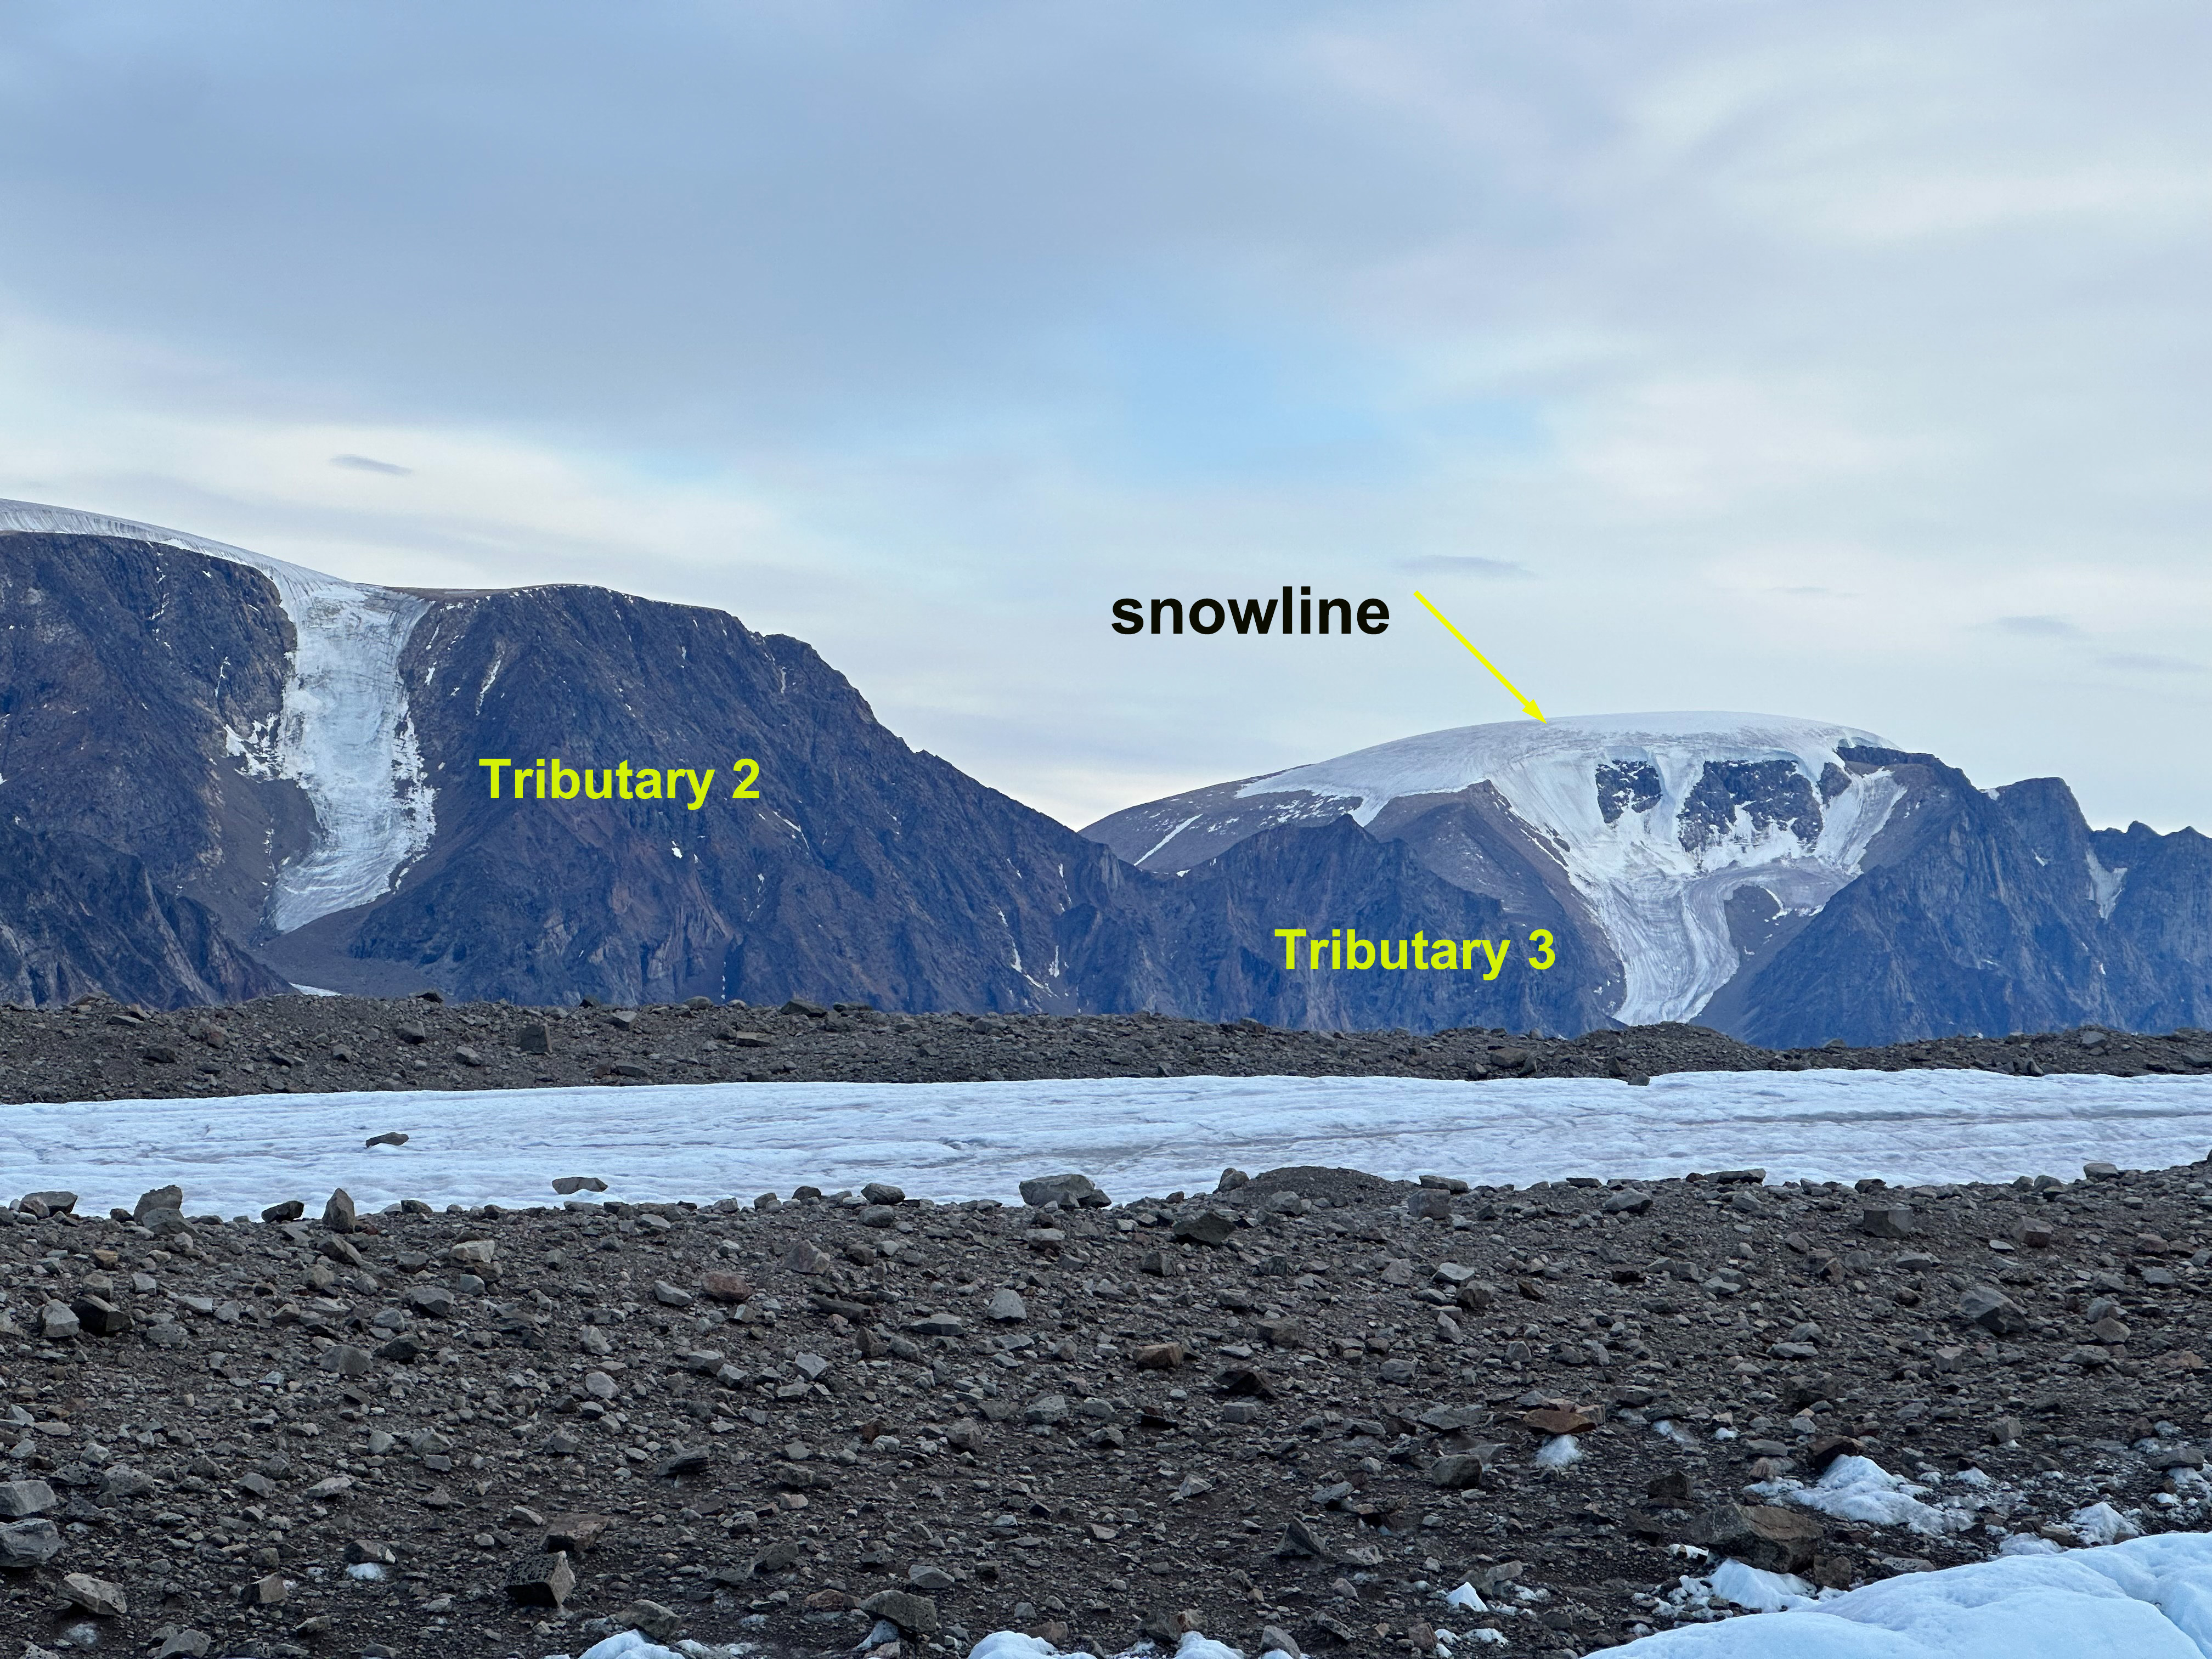
Tributary 2 has a detachment point before the main glacier, though relict ice below still connects.  Note snow is only retained at very top of ice cap with a month of melt season left. (Bischke/Biner/Bessen/Klemmensen)

tributary 6a

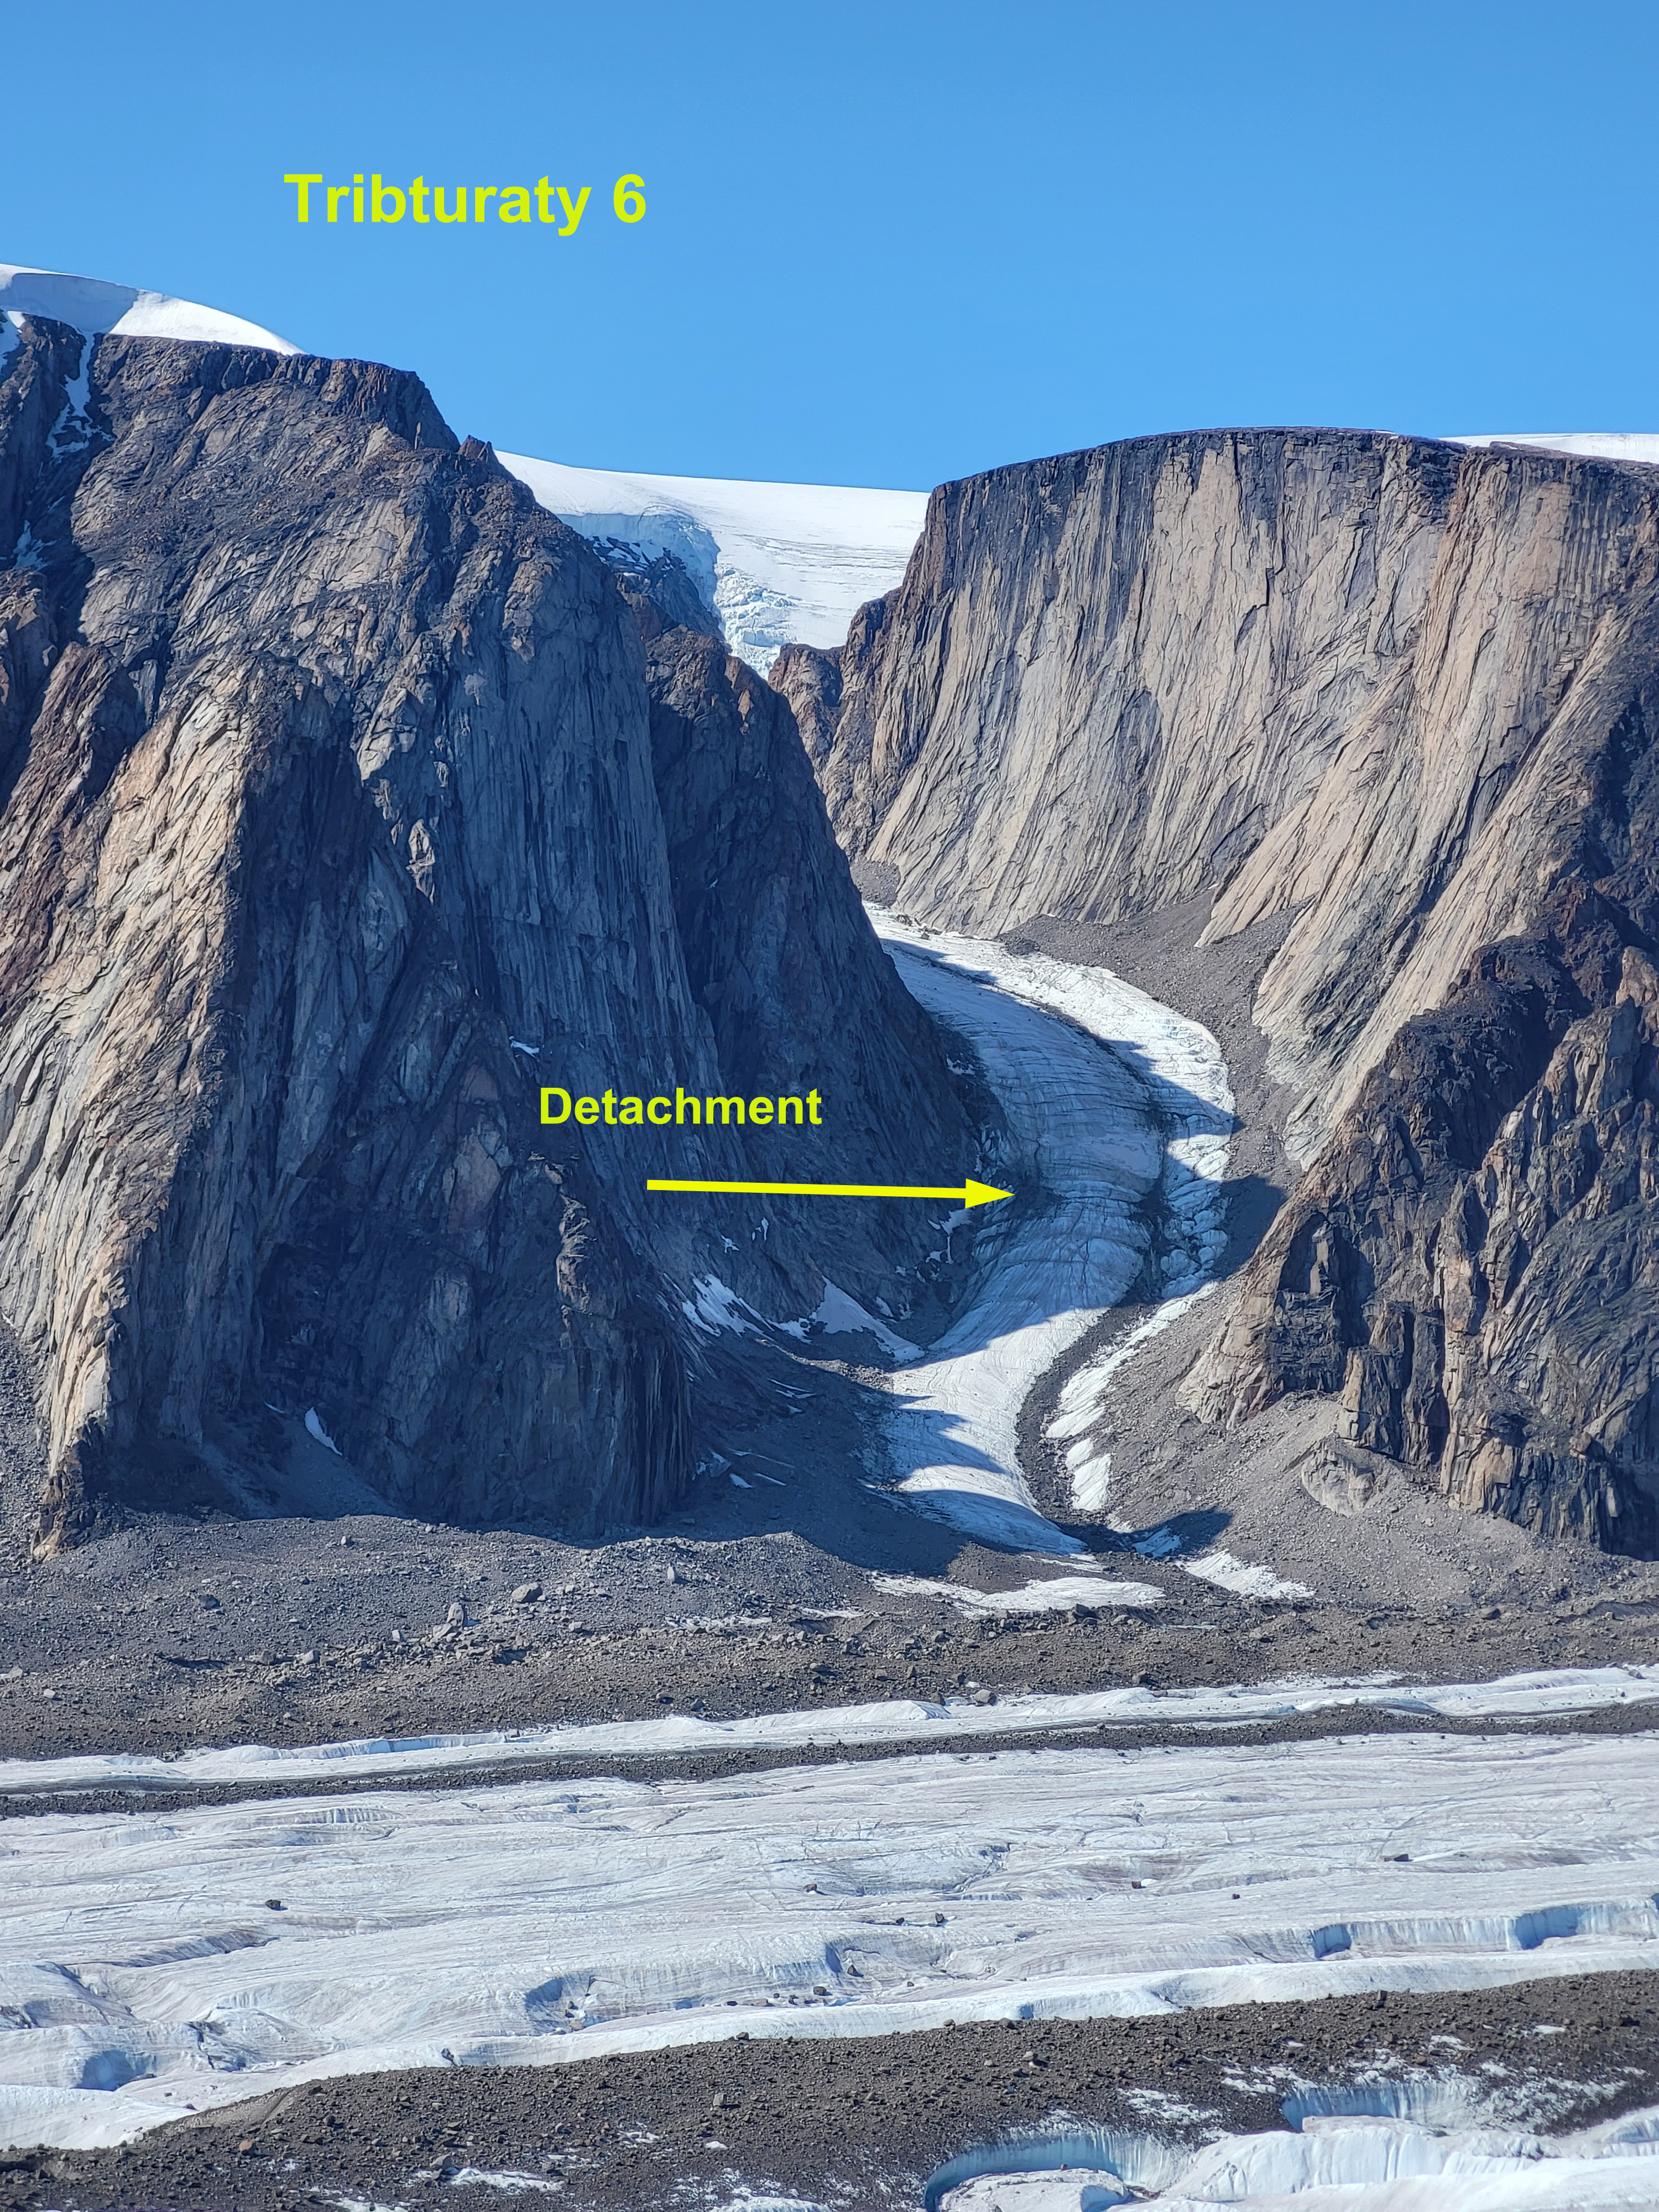
Tributary 6 is still connected all the a detachment is occurring halfway from ice cap to main glacier. (Bischke/Biner/Bessen/Klemmensen)

tributary 7 and 8b
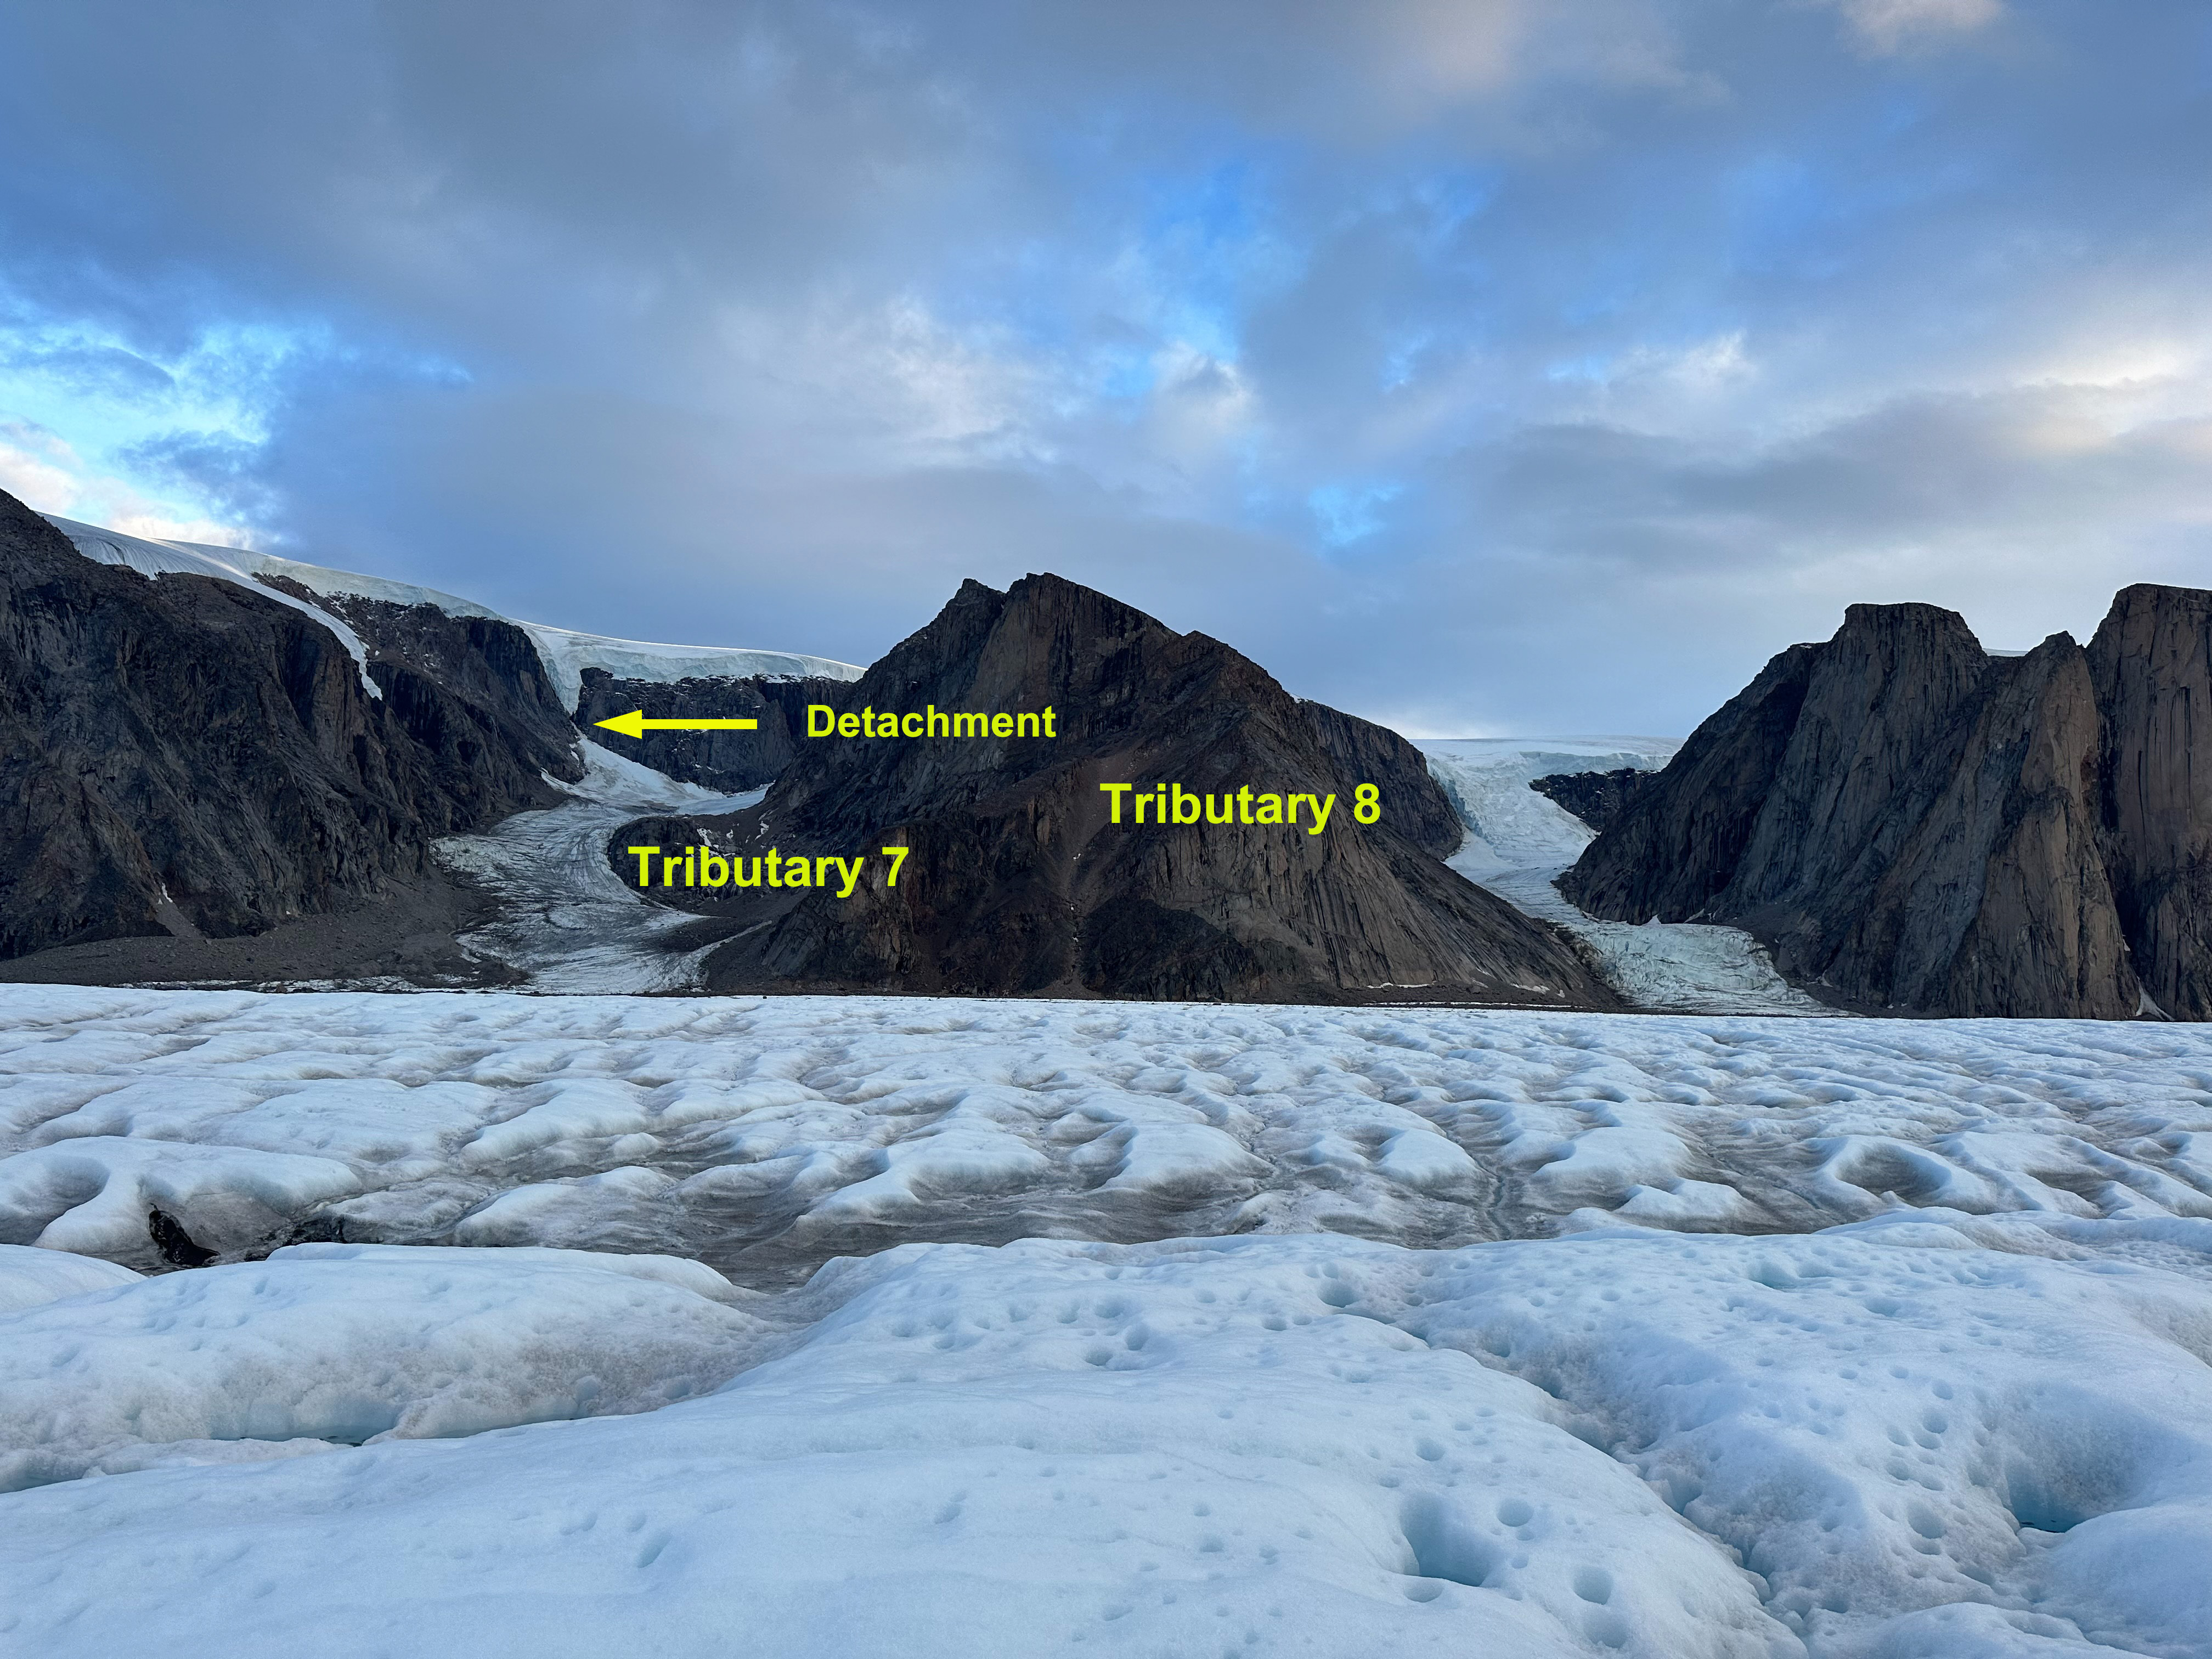
Tributary 7 and 8 are still connected, though 7 has a detachment now (Bischke/Biner/Bessen/Klemmensen)

Chasm Line

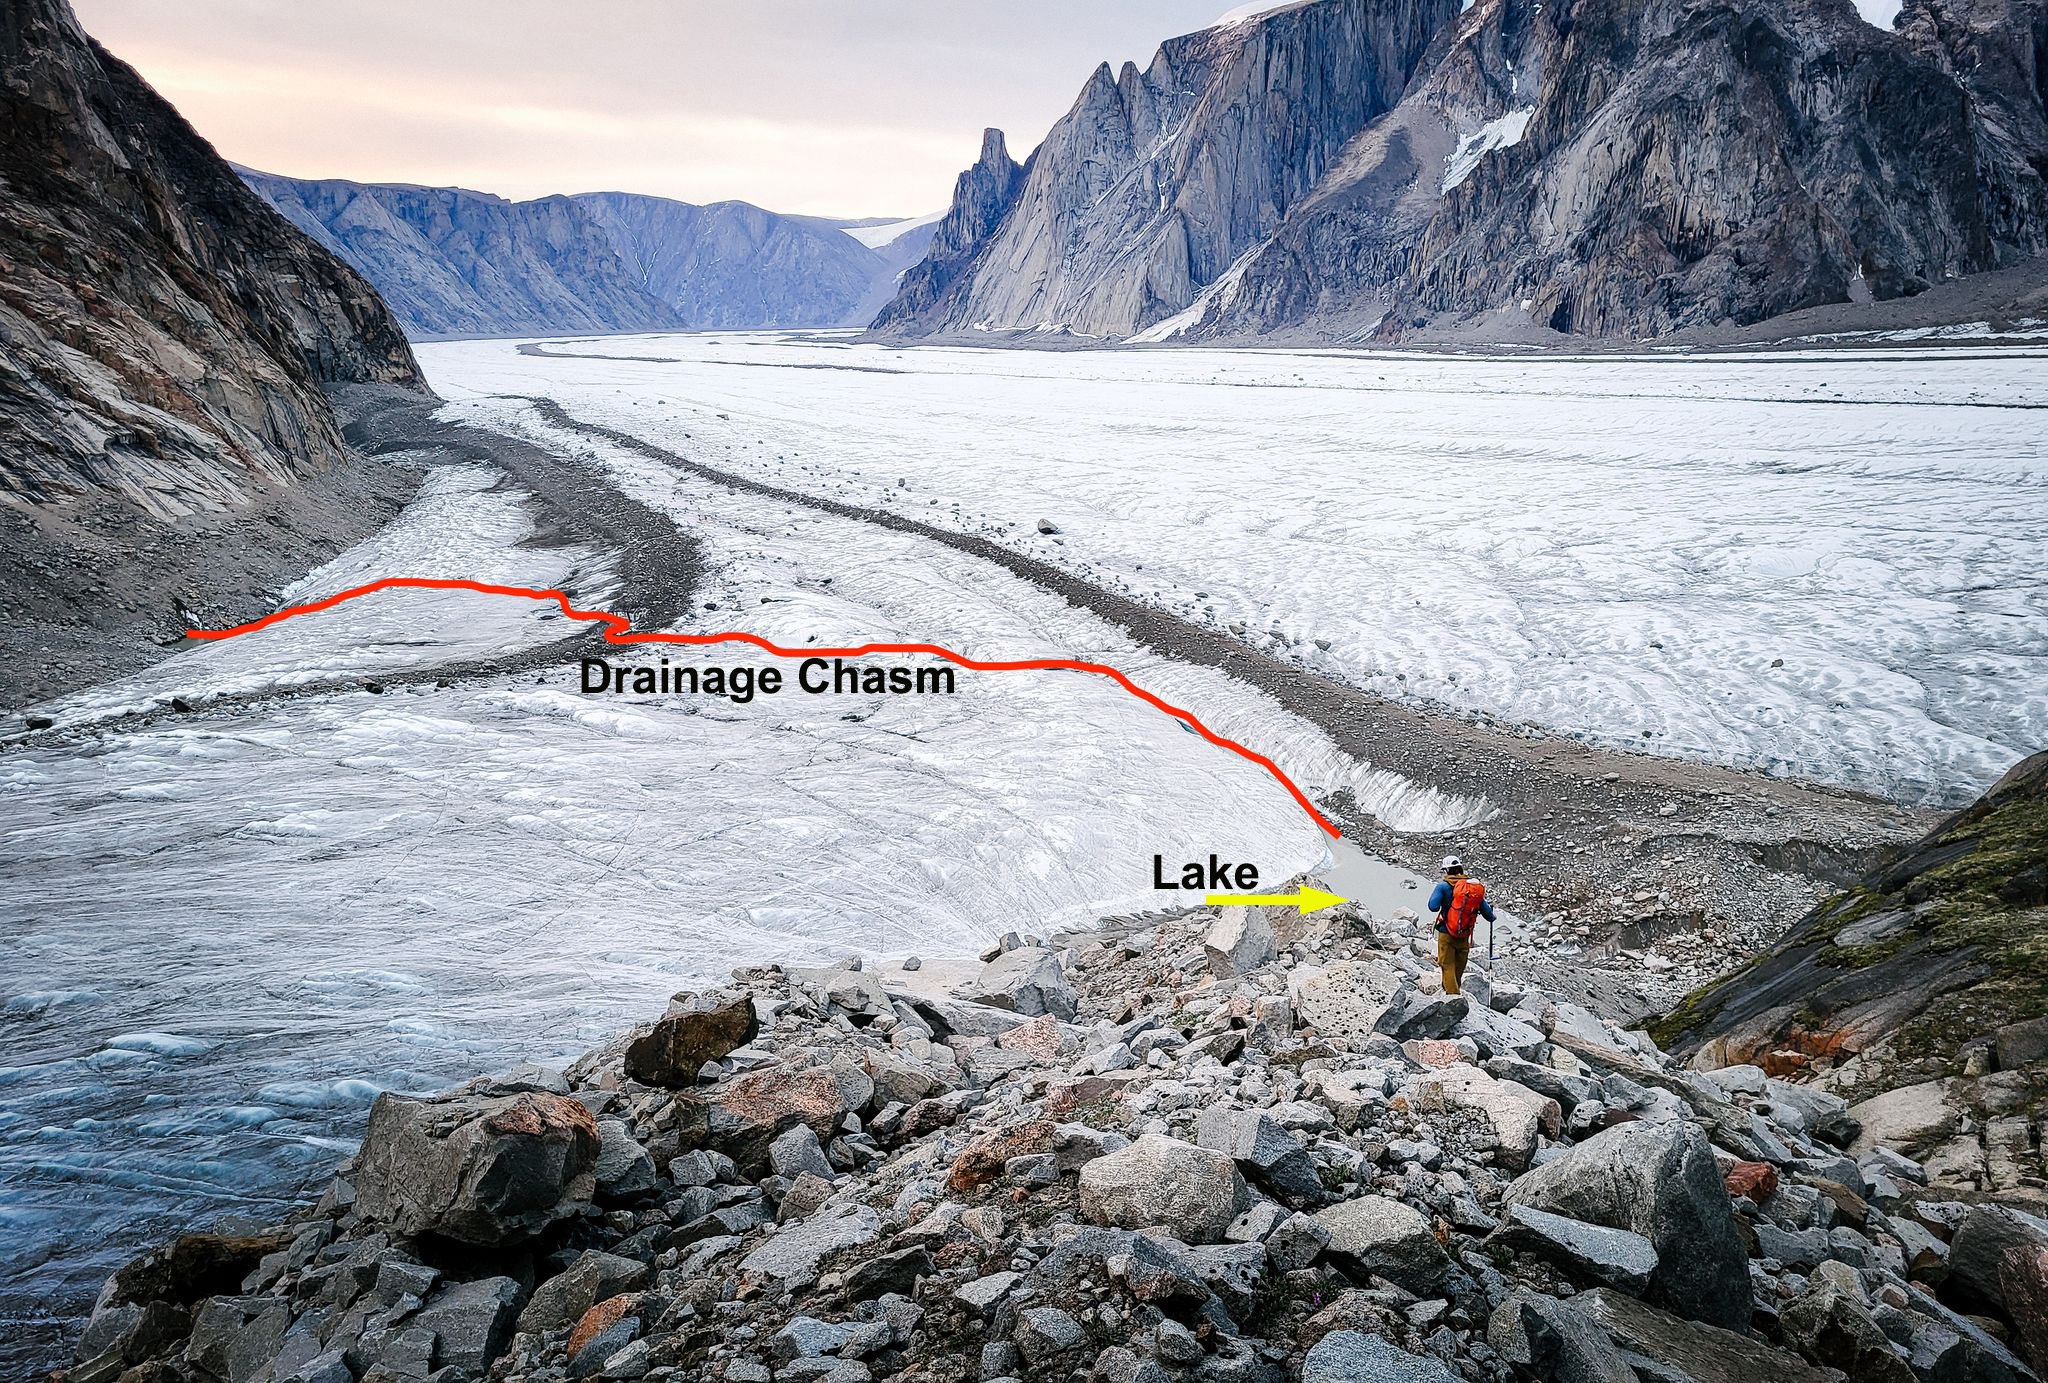
Triburary 9 had an interesting barrier to the climbers a deep chasm carved by an outlet stream draining meltwater, some of which had pooled in the lake shown. (Bischke/Biner/Bessen/Klemmensen)

Terra Nivea Ice Cap Expanding Bedrock Outcrops and Proglacial Lakes

Terra Nivea Ice Cap in Sentinel false color images from 2017 and 2022. Point A=bedrock outcrops expanding. Point L=expanding proglacial lakes. Red arrow=supraglacial stream chanels, yellow arrow=annual layers, green arrow=location where ice cap will separate.

Terra Nivea Ice Cap is the southern most Ice Cap in North America, on the Terra Incognita Peninsula of Baffin Island. Mercer (1956) noted that the ice cap accumulation during most years was via superimposed ice, though some years snow did endure at the top of the ice cap. Paspodoro et al (2015) observed a 34% reduction in ice cap area from 1958-2014 with an acceleration after 2007. Here we note a lack of retained snow, firn or superimposed ice on the northern portion of the ice cap in 2017 and 2022. The lack of retained accumulation as snow or ice results in rapid thinning that is leading to bedrock expansion within and at the margin of the ice cap and the expansion of peripheral proglacial lakes.

Point A marks specific locations where bedrock areas amidst the ice cap are expanding. This expansion will lead to separation of the ice cap at the green arrows soon. The ice cap was 1.9 km wide at this point in 2017 and 1.5 km in 2022. Point L marks locatsions of proglacial lake expansion. The yellow arrows indicate annual layers even at the summit area, which would not be visible if superimposed ice was forming. The red arrows indicate supraglacial stream channel that lead all the way to the summit region. For an ice cap retaiining firn or superimposed ice, the channels would begin below that margin. This illustrates that during the the 2017-2022 there was no retained accumulation on Terra Nivea Ice Cap. This is true of the rest of the ice cap as well. Here in order to better visualize change, the focus is just on the northern portion.

This same story is playing out on Grinnell Ice Cap.

Terra Nivea Ice Cap in Sentinel false color images from 2017 and 2022 illustraing separation region. Point A=bedrock outcrops expanding. Point L=expanding proglacial lakes.  Green arrow=location where ice cap will separate.


Swanson River Glaciers Retreat: Two Very Bad Summers in 2018 & 2019

Swanson River glaciers, British Columbia in Landsat images from 1984 and 2019. EM=East Meade Glacier, CG=Canning, red arrows=1984 terminus, yellow arrow=2019 terminus, purple dots=snowline. Points 1-8 are specific glacier locations with very limited to no retained snowcover.

The Swanson River feeds into Tagish Lake in NW British Columbia. The watershed is host to dozens of glaciers. Here we exaine the retreat of the two largest glaciers in the watershed from 1984-2019, referred to as “East Meade” and “Canning Glacier” in this post. We also look at the loss of snowcover on glaciers across the watershed in 2018 and 2019. These glaciers are in the northeast sector of the Juneau Icefield, sharing a divide with the retreating Meade Glacier, Alaska.  The Juneau Icefield Research Program focuses on glaciers to the south of these including  the retreating Llewellyn Glacier.

In 1984 the two glacier tongues terminated at 1000 m, red arrow and the snowline was at 1350 m, purple dots. This was a year of positive glacier mass balance on the Juneau Icefield, where I was working that summer. By 1998 there has ben modest retreat and the snowline is at 1400-1450 m. The retained snowpack at the end of the summer is limited to the upper reaches of the tributary glaciers. This year was a negative balance year on the Juneau Icefield where I was busy probing snowpack.

By 2018 Canning Glacier had retreated 1400 m since 1984 and terminated at 1100 m.  East Meade Glacier had retreated 1100 m since 1984 and terminated at 1100 m. In 2018 there is no retained snowpack on East Meade Glacier. There is limited snowpack at the top of some of the tributaries in wind deposition zones, but many ofthe small alpine glaciers in the area have no accumulation zone. This summer led to the highest snowline ever observed on the Taku Glacier (Pelto, 2019). In 2019 the snowlineis even higher and the glaciers of the Swanson River basin are laid bare. There is no snowpack on East Meade (1) or on the adjacent tributaries at Point 2 and 3. There is no snowpack retained on Canning Glacier (4) or on the alpine glaciers east of the Juneau Icefield at Point 6 and 8.  At Point 5 and 7 each has a small patch of retained snowpack at its upper margin close below a peak.

These back to back summers are the type of conditions that lead to the loss of alpine glaciers when they become frequent enough to remove any retained snowpack not just from that year, but from previous years. The retreat of East Meade and Canning Glacier is much less than Meade Glacier, 4 km 1986-2018, and similar to Warm Creek Glacier.

.

Swanson River glaciers, British Columbia in Landsat images from 1998 and 2018. EM=East Meade Glacier, CG=Canning, red arrows=1984 terminus, yellow arrow=2019 terminus, purple dots=snowline. 

Canadian Topographic map of the area EM=East Meade Glacier, CG=Canning Glacier and TL=Tagish Lake

Southeast Glacier #3, Devon Ice Cap, Canada Recent Retreat

Southeast #3 Glacier, Devon Ice Cap in July 9, 2016 and August 29, 2021 Sentinel 2 images of the lower 10 km  showing three supraglacial streams S1, S2 and S3 and the outlet plumes of each stream at Point 1-3. The yellow line is the 2016 margin.

The southeast sector of the Devon Ice Cap, Devon Island, Nunavut has three tidewater outlet glaciers Southeast Glacier #1, #2 and #3.  Van Wychen et al (2017) indicate the dynamic discharge of the three at .06-.07 Gt per year, all three glaciers have been retreating during this period.  Southeast #3 is between 0.01 and 0.02 Gt per year.  Sharp et al (2011) note that increasing summer temperatures has led to increased mass loss on Devon Ice Cap. Here we examine retreat and the supraglacial stream networks using Landsat and Sentinel 2 imagery.

In 2002 the calving front of Southeast #3  Glacier extended north from with five distinct peninsulas of ice. The retreat by 2016 was more pronounced on the north south oriented southern portion of the front than the northwestern part.  From 2016 to 2021 it is evident that the glacier front has receded, particularly at the prominent ice peninsulas evident in 2016. The retreat averages 600 m across the 5 km wide tidewater front seen above from 2016-2021. This is an addition to the  1200 m retreat from 2002-2016, while the northwestern section retreated ~500 m during the 2002-2021 period. S1, S2 and S3 indicates supraglacial stream drainages that exit the glaciers at Point 1-3 respectively.  The plumes of sediment from these streams is evident in the July 24, 2020 image below from each of these surface outlet streams. The plumes are evident in the July 2016 image, but no the late August image of 2021.  The lack of plumes on 8-29-2021 indicate the lower melt rates that are typical of late August. The stream network has become more prominent as melt rates have led to greater flow and more incising into the ice.

This retreat has occurred during the same period that was noted as generating three new islands in 2018 on the northeast margin of the Devon Ice Cap. Noel  et al (2018) observe that this is part of a trend seen across Canadian Arctic ice caps have been losing mass for decades and that mass loss accelerated in 1996.


July 24, 2020 Sentinel 2 image of the lower 10 km of Southeast #3 Glacier showing three supraglacial streams S1,S2 and S3 and the outlet plumes of each at Point 1-3.

Southeast #3 Glacier in 2002 and 2021 Landsat images. Yellow dots indicate the 2002 margin of the glacier.


Jacobsen Glacier, BC Separation Nearly Complete

Jacobsen Glacier in Landsat images from 1987 and 2019. Red arrow 1987 terminus location, yellow arrow 2019 terminus location and pink dots the snowline. Point A indciates ice marginal lake in 1987, Point C is the glacier junction, Point B an emerging rock rib and Point D a nunatak.

Jacobsen Glacier is part of the Monarch Icefield of the Coastal Range of British Columbia. VanLooy and Forster (2008) noted that the glacier retreated at a rate of 30 meters/year from 1974 to 1992 and 47 meters/year from 1992-2000. Menounos et al (2018) identified a mass loss for glaciers in this region of ~0.5 m year from 2000-2018 which is driving retreat. The glacier is at the headwaters of jacobsen Creek, which joins the Talchako River and then Bella Coola River.  The Bella Coola River is one of the most important salmon producing rivers on the British Columbia’s central coast. It supports the largest chinook and chum salmon populations, surveyed at 23k and 190k in surveys during the last decade (Pacific Salmon Foundation, 2021)  The sockeye and pink salmon runs have largely collapsed this century (Pacific Salmon Foundation, 2021). In this post we examine Landsat satellite imagery from 1987-2019 and Sentinel imagery from 2021 to illustrate the changes.

In 1987 the glacier terminated in a 1.8 km long proglacial lake at an altitude of ~1080 m .  The north margin had a separate terminus in the proglacial lake at Point A.  The terminus in the main proglacial lake 900 m wide. At Point B there is an icefall, but not exposed bedrock. The snowline was at 2050 m.  By 1995 the glacier had retreated 500 m.  The glacier was in contact with the proglacial lake at Point A.  The snowline was at 2100 m. By 2000 the glacier has retreated from the proglacial lake at Point A, due to thinning.  In 2016 the snowline is at 2150 m.  The glacier is now separated from the proglacial lake at Point A by ~500 m.  The southern tributary no longer reaches the expanding proglacial lake. In 2018 there is bedrock exposed at Point B.  The snowline is at 2100 m.  In 2019 the proglacial lake has expanded to a length of  3.3 km, a retreat of 1500 m from 1987-2019. The retreat and lake expansion has been 1500 m from 1987-2019, a rate of 47 m/year, only a slight change from the 1990-2000 reported rate. The snowline is at 2100 m. In May 2021 the Sentinel image indicates the medial moraine has widened to the point there is no interaction between the northern and southern tributary of Jacobsen Glacier.  The terminus in the expanding lake is now 400 m wide. The lake basin likely ends before Point C, based on surface slope changes of Jacobsen Glacier.

The retreat rate during this period is  less than the ~120-130 m/year at Bridge Glacier, Franklin Glacier or Klinaklini Glacier, and slightly more than at Bishop Glacier and Klippi Glacier. The combined loss in glacier area impacts glacier runoff particularly in late summer. Moore et al (2020) examining the Columbia River basin headwaters of Canada noted, “that glacier-melt contributions to August runoff have already have passed peak water, and that these reductions have exacerbated a regional climate-driven trend to decreased August streamflow contributions from unglacierized areas.”

Jacobsen Glacier in Landsat images from 1995 and 2018. Red arrow 1987 terminus location, yellow arrow 2019 terminus location and pink dots the snowline. Point A indciates ice marginal lake in 1987, Point C is the glacier junction, Point B an emerging rock rib and Point D a nunatak.

Jacobsen Glacier in Landsat images from 2000 and 2016. Red arrow 1987 terminus location, yellow arrow 2019 terminus location and pink dots the snowline. Point A indciates ice marginal lake in 1987, Point C is the glacier junction, Point B an emerging rock rib and Point D a nunatak.

Sentinel Image from May 2021