Jiangpu and Daoge Glacier Retreat and Lake Expansion, China

Daoge and Jiangpu Glacier retreat and proglacial lake expansion in Landsat images from 1988 and 2022. Yellow arrow is the 2022 terminus location, red arrow the 1988 terminus location and purple dots the snowline.

The Jiangpu Glacier and Daoge Glacier are the second and third largest glaciers in the Nyainqentanglha East Range. They flow south in adjacent valleys that feed the Yi’ong Tsangpo, which joins the Parlung Zangbo. Draining north from the same mountains is Jiongla Glacier, which retreated 3200 m from 1988-2015. Qin ji et al (2018) noted glacier recession of 1.24% per year from 1999-2015 in this range, in response to rising annual air temperature. Here we examine satellite imagery from 1988, 2000, 2015 and 2022 to identify the changes in these glaciers.

In 1988 Daoge Glacier terminates in a proglacial lake at ~4000 m that is 1.3 km long. Jiangpu Glacier terminates at a moraine complex at ~3250 m.  The snowline in 1988 is at 4600-4700 m. By 2000 there is limited retreat evident at both glaciers and the snowline is at 4500-4600 m. In 2015 the lake at the terminus of Daoge has expanded to 2.5 km, while there is still no lake at the terminus of Jiangpu, with the snowline at 4800 m. In 2022 the summer heat wave experienced by the region pushed the snowline up to 5100-5200 m on Aug. 11, 2022. The lake at the terminus of Daoge Glacier has expanded to 3.2 km in length. For Jiangpu Glaicer a 0.4 km² lake has formed at the terminus due to a landslide triggered by an earthquake swarm in 2020 (Sheth, 2020). Glacier retreat from 1988-2022 has been 1900 m at Daoge Glacier and 2050 m at Jiangpu Glacier.

The high snowline in recent years will continue the retreat of both glaciers, which both have stagnant terminus regions for ~3 km above the current terminus location. There is no slope change at Daoge Glacier indicating lake expansion is near and end. At Jiangpu Glacier the lake is not expanding upvalley, and appears likely to fill in with sediment. This is not surprising given this is not a erosional basin, but a shallow valley fill lake impounded by landslide sediments.

Daoge and Jiangpu Glacier retreat and proglacial lake expansion in Landsat images from 2000 and 2015.  Red arrows the 1988 terminus location and purple dots the snowline.

Zarilang Glacier, China Retreat and Lake Expansion

Zarilang Glacier in 1998 and 2021 Landsat images illustrating glacier retreat and lake expansion. Point A marks the junction of two tributaries.

Zarilang Glacier, China  flows north from the Bhutan border is in the Yarlung Zangbo River watershed draining the northwest flank of Kula Kangri. Yarlung Zangbo which becomes the Brahmaputra River supplies the Zangmu Dam (510 MW), online in 2015, that produces 2.5 billion kwh of electricity a year. Wang et al (2021) observe a significant increase in discharge of Yarlung Zangbo due to glacier melt and permafrost degradation.  Zhang et al (2020) observed glacier retreat leading to lake expansion averaging 20 m/year in the Himalaya for the 2008-2016 period, with Yarlung Zangbo basin having the highest average rate of lake expansion.

In 1998, Zarilang Glacier terminated in a proglacial lake that was 1.0 km long with an area of 0.24 km2, 1.8 km upglacier from the terminus was a significant junction at Point A, with a medial moraine marking the boundary extending to the terminus.  In 2001 the calving front is 400 m wide and has retreated ~100 m since 1998. By 2014 the glacier has retreated into a narrowing portion of the lake. By 2018 the medial moraine marks the eastern margin of the glacier, which means the eastern tributary is no longer reaching the lake. In 2021 the glacier has retreated 700 m and the lake is now 1.7 km long and has an area of 0.50 km2. In 2022 the calving front is 200 m wide and the glacier terminates 900 m from the junction at Point A, and the eastern tributary ends 100 m short of the lake. The lake area has doubled since 1998, which is a higher rate than the already high rate of 51% globally for glacial lakes noted by Shugar et al (2019) for glacial lakes 1990-2018.

Sun et al (2022) rated the hazard of a glacier lake outburst flood from this lake as low. The retreat is similar in scope to that of other glaciers retreating in expanding lakes in this region of China such as Sepu Kangri  and  Quiaqing Glacier. Examining glacier mass loss in the Himalaya King et al (2019) noted that lake terminating glaciers lost 30% more volume than other Himalayan glacier from.

Sentinel images in 2022 of Zarilang Glacier and the glacial lake. On May 31 there is some lake ice left. Note the medial moraine now is the eastern margin of the terminus.

Zarilang Glacier in 2001 and 2018 Landsat images illustrating glacier retreat and lake expansion. Point A marks the junction of two tributaries.

Drogpa Nagtsang Glacier, China 2021 Snow Line Positions Lake Expansion

Drogpa Nagtsang Glacier, China retreat and proglacial expansion in 1993 and 2021 Landsat images. Red arrow is the 1993 terminus, yellow arrow the 2021 terminus and yellow dots are the snowline.

Drogpa Nagtsang Glacier, China is 30 km west of Mount Everest terminating in an expanding proglacial lake. The glacier begins on the Nepal border at 6400 m, and its meltwater enters the Tamakoshi River that supplies the Upper Tamakoshi Hydropower project a 456 MW run of river  project that began operation in September 2021.  King et al (2017) observed the mass balance of 32 glaciers in the Mount Everest area including Drogpa Nagtsang and found a mean mass balance  was  -0.7 m/year for lake terminating glaciers. In this basin from 2000–2016, mass balance loss resulted in surface elevation to decline at a rate of −0.63 m a−1, which drove a velocity decline of ~25% (Zhong et al 2021). They also noted that the area of  proglacial lakes in glacier contact increased by ~204% . Pelto et al (2021) documented the exceptionally high winter snowline in the Mount Everest region from October 2020-January of 2021.  Here we examine changes in Drogpa Nagtsang Glacier since 1993 and the snowline variation from October 2020-November 2021.

In 1993 Drogpa Nagtsang Glacier had a substantial number of coalescing supraglacial ponds on its relatively flat stagnant debris covered terminus.  The snowline in 1993 was at ~5450 m.  At Point A there is extensive crevassing indicating vigourous flow. At Point B a tributary glacier joins the main glacier. At Point C the glacier is a 1.2 km wide glacier tongue.  Quincey et al (2009) observed flow of less than 10 m/a in lower 5 km of glacier in 1996 and peaking at 20-30 m/a 8 km from terminus. By 2015 a 2.7 km long lake has developed (Pelto, 2019).  In 2021 the lake has expanded to 3 km long. At Point A there is no longer significant crevassing indicating reduced flow. At Point B the tributary no longer connects to main glacier. At Point C the glacier tongue has lost 30% of its width and debris cover width has expanded.  The terminus area remains stagnant and the lake is poised to continue expansion.

Snowline variation from October 2020-November 2021, yellow dots. These are Landsat images except May 2021 is from Sentinel.

In October 2020 the snowline on Drogpa was at 5650-5700 m. By mid-January after the record winter heat wave of 2021 the snowline had risen to 5750-5800 m.  In May of 2021 as the summer monsoon began the snowline was below the terminus of the glacier (5000 m).  In June the snowline had risen to 5450 m. This is a summer acccumulation type of glacier, which means most of the accumulation snowfall occurs during the summer monsoon above the snowline simultaneous with high melt rates below the snowline.  The snowline is close to mean freezing level, which has risen to 5400 m in recent years for the summer monsoon period (Perry et al 2020)The snowline than rises in the post-monsoon period. By October 2020 in the post-monsoon period the snowline had rise to 5600 m.  A significant storm in late October lowered the snowline to 5250 m for November 2021. This suggests the snow free start to winter we saw last year will not occur this year.

Mena Kang West Glacier retreat and lake expansion, Tibet, China


Mena Kang West Glacier in 2002, 2020 and 2021 Landsat images.  Red arrow is the 2000 terminus location, yellow arrow the 2021 terminus location and pink dots the snowline.

“Mena Kang West” Glacier is an unnamed glacier that is to the west of Mena Kang (6140 m) at 28 N, 91.6 W in Tibet, China. The glacier drains into the Nyamjang Chu, which flows south in Arunachal Pradesh, India.  This region has seen the rapid expansion of many proglacial lakes due to glacier retreat. Allen et al (2019) mapped 1291 glacial lakes with an area greater than 0.1 km2, of these 204 posed a glacial lake outburst (GLOF) threat. Nyamjang Chu is not a basin that has experienced a significant GLOF.  This basin does have a proposed hydropower project downstream in Arunachal Pradesh, but the project has not yet begun.  Glacier retreat led to a 20% increase in the number of glacier lakes in the Pumqu region, the adjacent basin to the west (Che et al, 2014).

In 2000 the glacier terminates, at ~4820 m, in a 400 m long glacial lake with an area of 1.6 km2. The snowline is near the top of an icefall at 5300 m. In late October 2002, the snowline is at 5100 m, the lake area is 1.7 km2. By 2016 the glacial lake has expanded to 1000 m in length, the terminus is just below a crevassed area (C), indicating the calving front is leading to an acceleration of the glacier near its terminus. The snowline is at the top of the icefall at ~5300 m. In October 2020 a snowstorm has lowered the snowline to 5000 m.  A warm dry early winter and particularly January throughout the region (NASA, 2021), has led to the snowline have risen and remained high at 5300-5400 m from January 16 -January 28, 2021. This is a summer accumulation glacier receiving the bulk of its snowfall in summer, but winter is supposed to be a period with some snowcover and limited ablation.  That was not the case in the snow free winter to the end of January in 2020/21 (Pelto, 2021). By 2020 the glacier has retreated 600 m since 2000 and the lake area has expanded to 0.3 km2. The high snowlines in recent years have been driving further retreat as noted at other glaciers in the area; Shie Glacier and Bailang Glacier.

Digital Globe imagery  from 2018 of Mena Kang West Glacier illustrating the Icefall (I) at ~5300 m, the terminus crevasse zone (C), flow directions (blue arrows), snowline (pink dots) and recessional moraines (M). 

Mena Kang West Glacier in 2000 and 2018 Landsat images and a 2021 Sentinel image.  Red arrow is the 2000 terminus location, yellow arrow the 2021 terminus location and pink dots the snowline.


Bailang and Angge Glacier, China Retreat and Lake Expansion 1995-2020

Bailang (B) and Angge Glacier (A) in 1995 and 2020 Landsat images indicating retreat and lake expansion. Red arrow is the 1995 terminus location, yellow arrow the 2020 terminus location, purple arrow rock ridges that expand separating tributaries. Chubda Glacier (C) to the south and an unnamed glacier Point D between Angge and Bailang.

Bailang Glacier and Angge Glacier, China are adjacent to the Chubda Glacier, Bhutan, They drain north from Chura Kang and are summer accumulation type glaciers that end in proglacial lakes. The glacier runoff feeds the Xung Qu River a tributary of the Kuri Chhu in Bhutan that powers the Kurichhu Hydropower plant a 60 mw run of river plant in Eastern Bhutan. Both lakes are impounded by broad moraines that show no sign of instability for glacier lake outburst flood. The number of glacier lakes in the adjacent Pumqu Basin to the west has increased from 199 to 254 since the 1970’s with less than 10% deemed dangerous (Che et al, 2014).  In the Yi’ong Zangbo basin to the east  Hongyu et al (2020) observed that from 1970 to 2016 total area of glaciers in the basin  decreased by 35%, whereas the number of glacial lakes increased by 86. Here we compare Landsat images from 1995 and 2020 to identify their response to climate change.

Bailang Glacier in 1995 terminated in a proglacial lake that was 2.1 km long at an elevation of ~5170 m, red arrow. Angge Glacier terminated in a lake that was 1 km long at an elevation of ~5020 m. Between the two is an unnamed glacier labeled “D” here that does not end in a proglacial lake.  By 2001 both glaciers experienced minor retreat of less than 250 m.  By 2014  Bailang Glacier had retreated  800-900 m and the lake was now 3 km long and had no change in water level.  A key tributary on the west side near the purple arrow had also detached. Angge Glacier retreat from 1995 to 2015 was 700 to 800 m, with the glacier retreating to a westward bend in the lake basin.  The glacier has an icefall just above the current terminus suggesting the lake basin will soon end, which should slow retreat.  The D Glacier between them has developed a proglacial lake as well. By 2020 the Bailang Glacier has retreated 1300 m since 1985 and has lost connection with tributaries on either side of the ridge on the west side of the glacier noted by the purple arrow. Angge Glacier has retreated 1100 m since 1995 and has a very narrow connection to the lake, which is now ~2 km long. The glacier in between Bailang and Angge, D Glacier, has developed a 900 m long proglacial lake which also matches the retreat during the last 25 years. This glacier has lost contact with its western tributary as well at western purple arrow.

The reduced lake contact at Angge Glacier is similar to that seen at Shie Glacier, while the lake expansion at Bailang Glacier is similar to that at Daishapu Glacier and Drogpa Nagtsang Glacier.

Bailang (B) and Angge Glacier (A) in 2001 and 2014 Landsat images indicating retreat and lake expansion. Red arrow is the 1995 terminus location, yellow arrow the 2020 terminus location, purple arrow rock ridges that expand separating tributaries. Chubda Glacier (C) to the south and an unnamed glacier Point D between Angge and Bailang.

Jiemayangzong Glacier, Tibet Retreat, Separation and Lake Expansion 1991-2020

Jiemayangzong Glacier in 1991 and 2020 Landsat images.  The red arrow is the 1991 terminus location, yellow arrow is the 2020 terminus location and purple dots mark the snowline. Point A indicates a tributary that has disconnected, while bedrock expanded at Point B. 

Jiemayangzong Glacier drains east from 6200 m peaks along the Nepal-China border. The glacier ends in a lake- Jiemayangzong Tso. Ren et al (2016)  identify this as the headwaters of  the Yarlung Tsangpo (Zangbo), which becomes the Brahmaputra River. The Zangmu hydropower project was completed on the river in 2015, it is a 510 MW project. Here we examine Landsat and Google Earth imagery from the 1991-2014 period. This is a region where Li et al (2011) noted that increasing temperature during the 1961-2008 period, especially at altitude, led to the retreat of glaciers and expansion of glacial lakes in this region. Liu et al (2011) noted that this glacier’s area has decreased 5%, retreating 768m ( 21 m/year), leading to lake expansion of ~64% during the 1974-2010 period.

In 1991 the lake was 1.1 km long, the snowline was at 5500 m near the elevation where the northern tributary joined at Point A.  In 1998 the snowline was at 5600 m, the glacier had not retreated appreciably.  In 2017 tributary A no longer is connected to the main glacier, the snowline is at 5600 m and the lake has expanded to a length of 1.9 km.  In 2020 the snowline in mid-September, with the melt season still going, is at  5700 m. The glacier has retreated 1000 m from 1991-202o a rate of  ~33 m/year. The lake is now 2.1 km long and has an area of  1.3 km2.  The glacier has a wide stable moraine belt (M) and does not pose a GLOF threat. Immediately downstream of the lake is a 10 km2 braided valley/wetland area (W) as well that would mitigate any potential flood hazard. This glaciers retreat is similar to many others draining north into Tibet from the Himalayan crest, Chako Glacier, West Ganglung Glacierand Asejiaguo Glacier

Jiemayangzong Glacier in 1998 and 2017 Landsat images.  The red arrow is the 1991 terminus location, yellow arrow is the 2020 terminus location and purple dots mark the snowline. Point A indicates a tributary that has disconnected, while bedrock expanded at Point B. 

Jieayangzong Glacier (JG) in 2015 Digital Globe image indicating the expanding proglacial lake (JL), moraine belt (M) and large wetland (W)

Reqiang and Jicongpu Glacier Retreat, Lake Expansion and Moraine Stability Increase

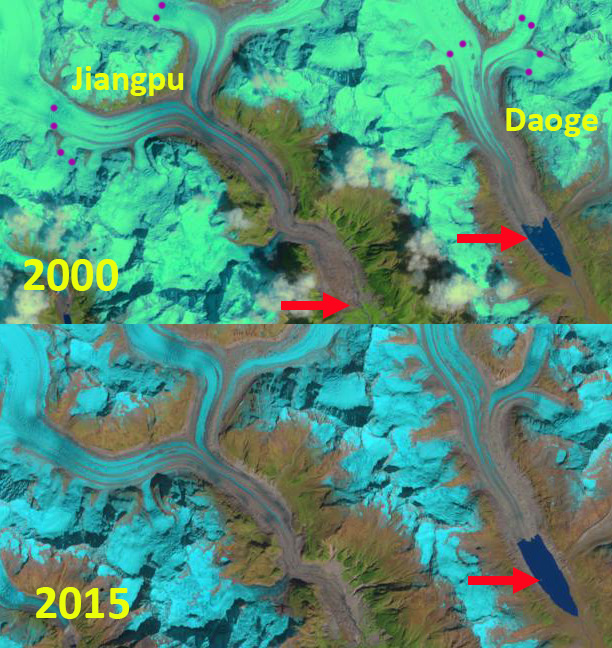
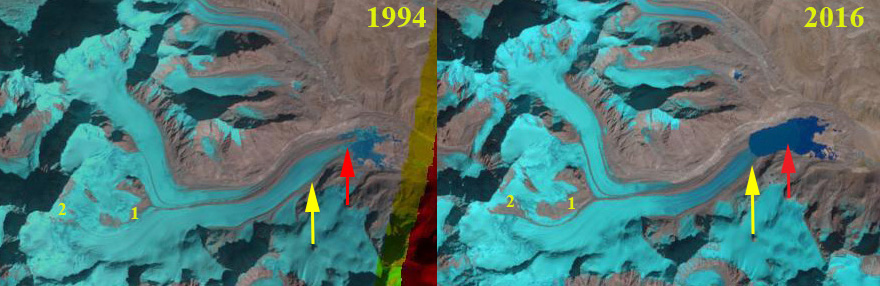
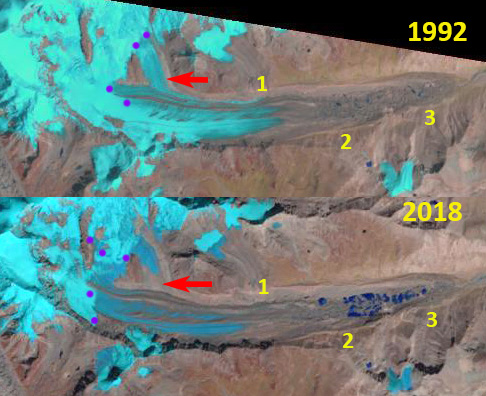
Reqiang Glacier (R) and Jicongpu Glacier (J) in 1993 and 2019 Landsat images.  M=Moraine, red arrow is the 1993 terminus location, yellow arrow the 2019 terminus location and purple dots the snowline.

Requiang Glacier, Tibet is just east of Shishapangma Mountain one of planets 14 peaks that exceed 8000 m and terminates in the rapidly expanding proglacial lake Gangxico at 5200 m. Jicongpu Glacier drains south from Shishapangma terminating in the proglacial lake Galongco at 5100 m. Both glaciers are fed by avalanching from the high slopes of  Shishapangma. Reqiang Glacier has been undergoing a rapid retreat since 1976, Li et al (2011) noted the retreat of 65.7 m/year from 1976-2006.  The retreat of this glacier fit the pattern of all 32 reported and was due to that increasing temperature. Zhang et al (2019)  observed that from 1974-2014 Galongco and Gangxico lakes expanded by ~500% (0.45 km2 /year) and ~107% (0.34 km/year.  As the lakes have expanded the wide moraines impounding the lakes have not experienced visible change. Here we examine the retreat of Reqiang and Jicongpu Glacier from 1993-2019 using Landsat imagery and the GLOF risk of Galongco and Gangxico.

Glacier lake outburst floods (GLOF) are a significant hazard in glaciated mountain ranges. The principal causes of GLOF are ice dam failure, moraine dam failure and/or avalanching into a lake.  Harrison et al (2018) noted there has been a decline in recent decades of GLOF events globally and in the Himalaya due to moraine dam failure.  In the Himalaya the main cause of moraine dam failure is ice avalanches into the lake. This decline has occurred during a period of rapid glacier retreat and the formation of many more alpine lakes. Hence, the number of locations where a potential GLOF could occur has increased, but the actual risk of any particular location generating a GLOF has declined even more.  Carrivick and Tweed (2016) observed that the number of GLOF’s due to all causes globally has declined since the mid 1990’s, and that this decline is not a reporting issue, since reporting has gotten better.  The main cause of the 1348 GLOF’s that they archived had been ice dam failure at 70%.  How has the retreat of Reqiang and Jicongpu Glacier impacted the risk of a GLOF?

In 1993 Reqiang Glacier terminated in a 3.1 km long Gangxico, which had an area of 2.9 km2.  The lowest 2.5 km of the glacier had a low slope and the snowline was above this at 5500 m.  Jicongpu Glacier terminated in a 2.8 km long Galongco with an area of 2.6 km2 and had a 3.5 km low slope debris covered terminus zone. By 2000 Reqiang Glacier had retreated 400 m and the low slope terminus tongue had a significant expansion of debris cover. Jicongpu Glacier had retreated 300-400 m.  By 2018 Reqiang Glacier had retreated 1900 m, the glacier snowline is only 1 km from the calving front at ~5500 m.  Jicongpu Glacier has retreated 2100 m on the east side and 1400 m on the western margin of the lake.  The debris covered area has been reduced to ~1 km2. From 1993-2019 Reqiang Glacier has retreated at a rate of ~95 m/year.  Gangxico  has expanded to an area of 4.6 km2 and is 5.0 km long. The snowline on Reqiang Glacier has been consistent in location in each of the years.  Jicongpu Glacier has retreated at an average rate of ~70 m/year.  Galongco has expanded to an area of 5.5 km2.

At Reqiang Glacier the moraine band impounding Gangxico is 1950 m wide and does not have visible signs of change.  With time since emplacement and retreat of the glacier into the lake the moraine will stabilize more.  Given the continued even if slow increased  moraine stability and the large moraines width the risk of dam failure is limited. At Jicongpu Glacier the moraine band is 1200 m wide impounding Galongco, again considerable.  These two glacier indicate the competing factors for GLOF risk, the size and stability of the moraine, versus the expanding volume of the lake.  Similarly a retreating glacier can reduce the ice avalanche hazard as the lake expands and ice slope diminish or the retreating glacier can provide access to steeper ice slope depending on the specific topography.  Zhang et al (2019) suggest both lakes have limited room to expand as they near a glacier surface slope increase.The retreat of these two glaciers follows that of many alpine glaciers in the region where lakes exist at the terminus which has enhanced retreat such as at Yanong Glacier and Drogpa Nagtsang Glacier.

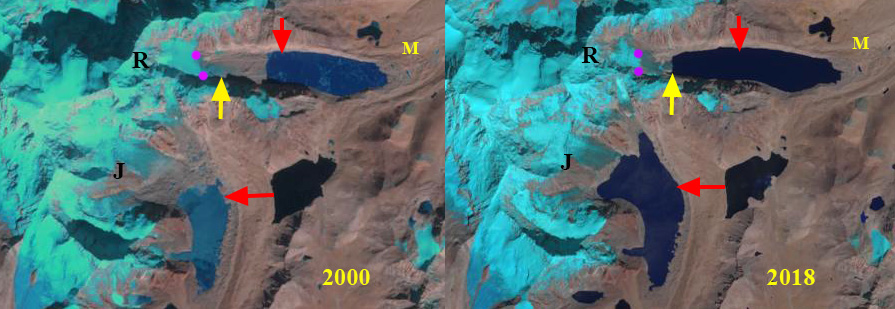
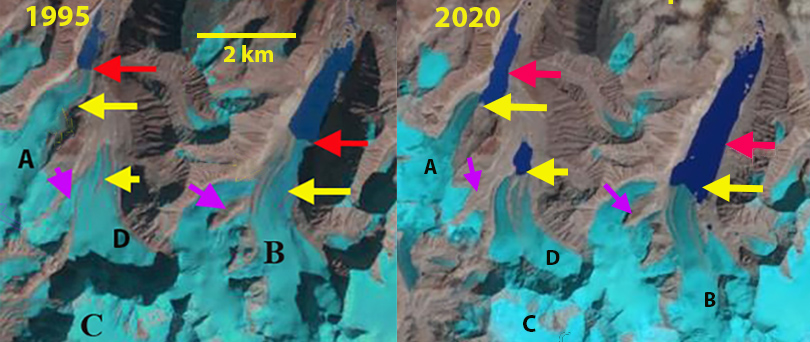
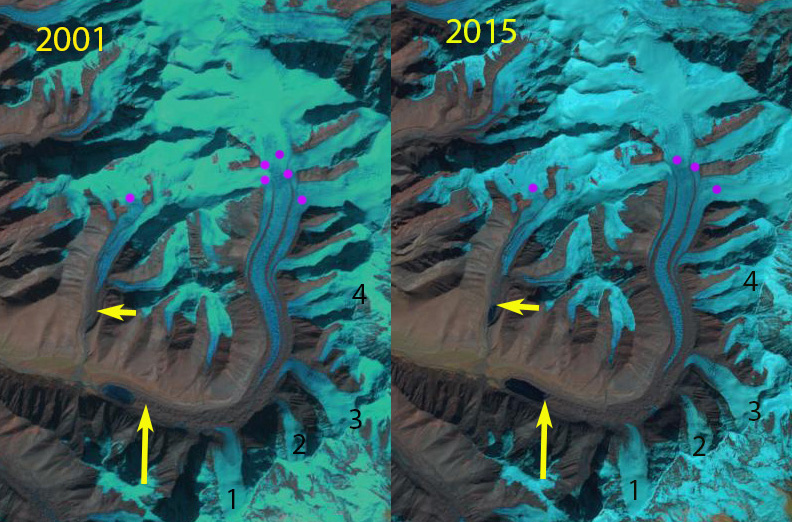
Reqiang Glacier (R) and Jicongpu Glacier (J) in 2000 and 2018 Landsat images.  M=Moraine, red arrow is the 1993 terminus location, yellow arrow the 2019 terminus location and purple dots the snowline.

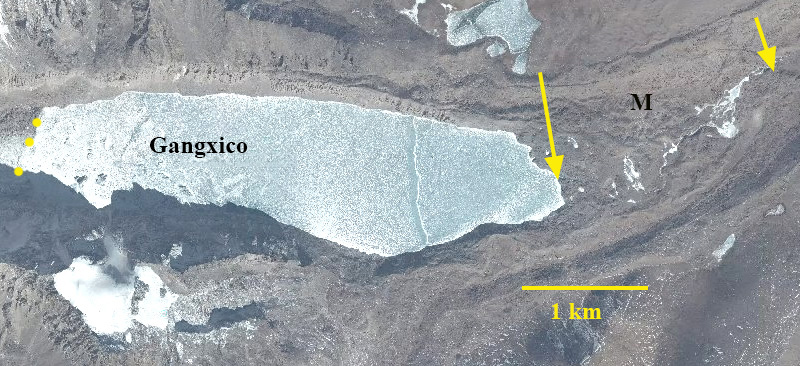
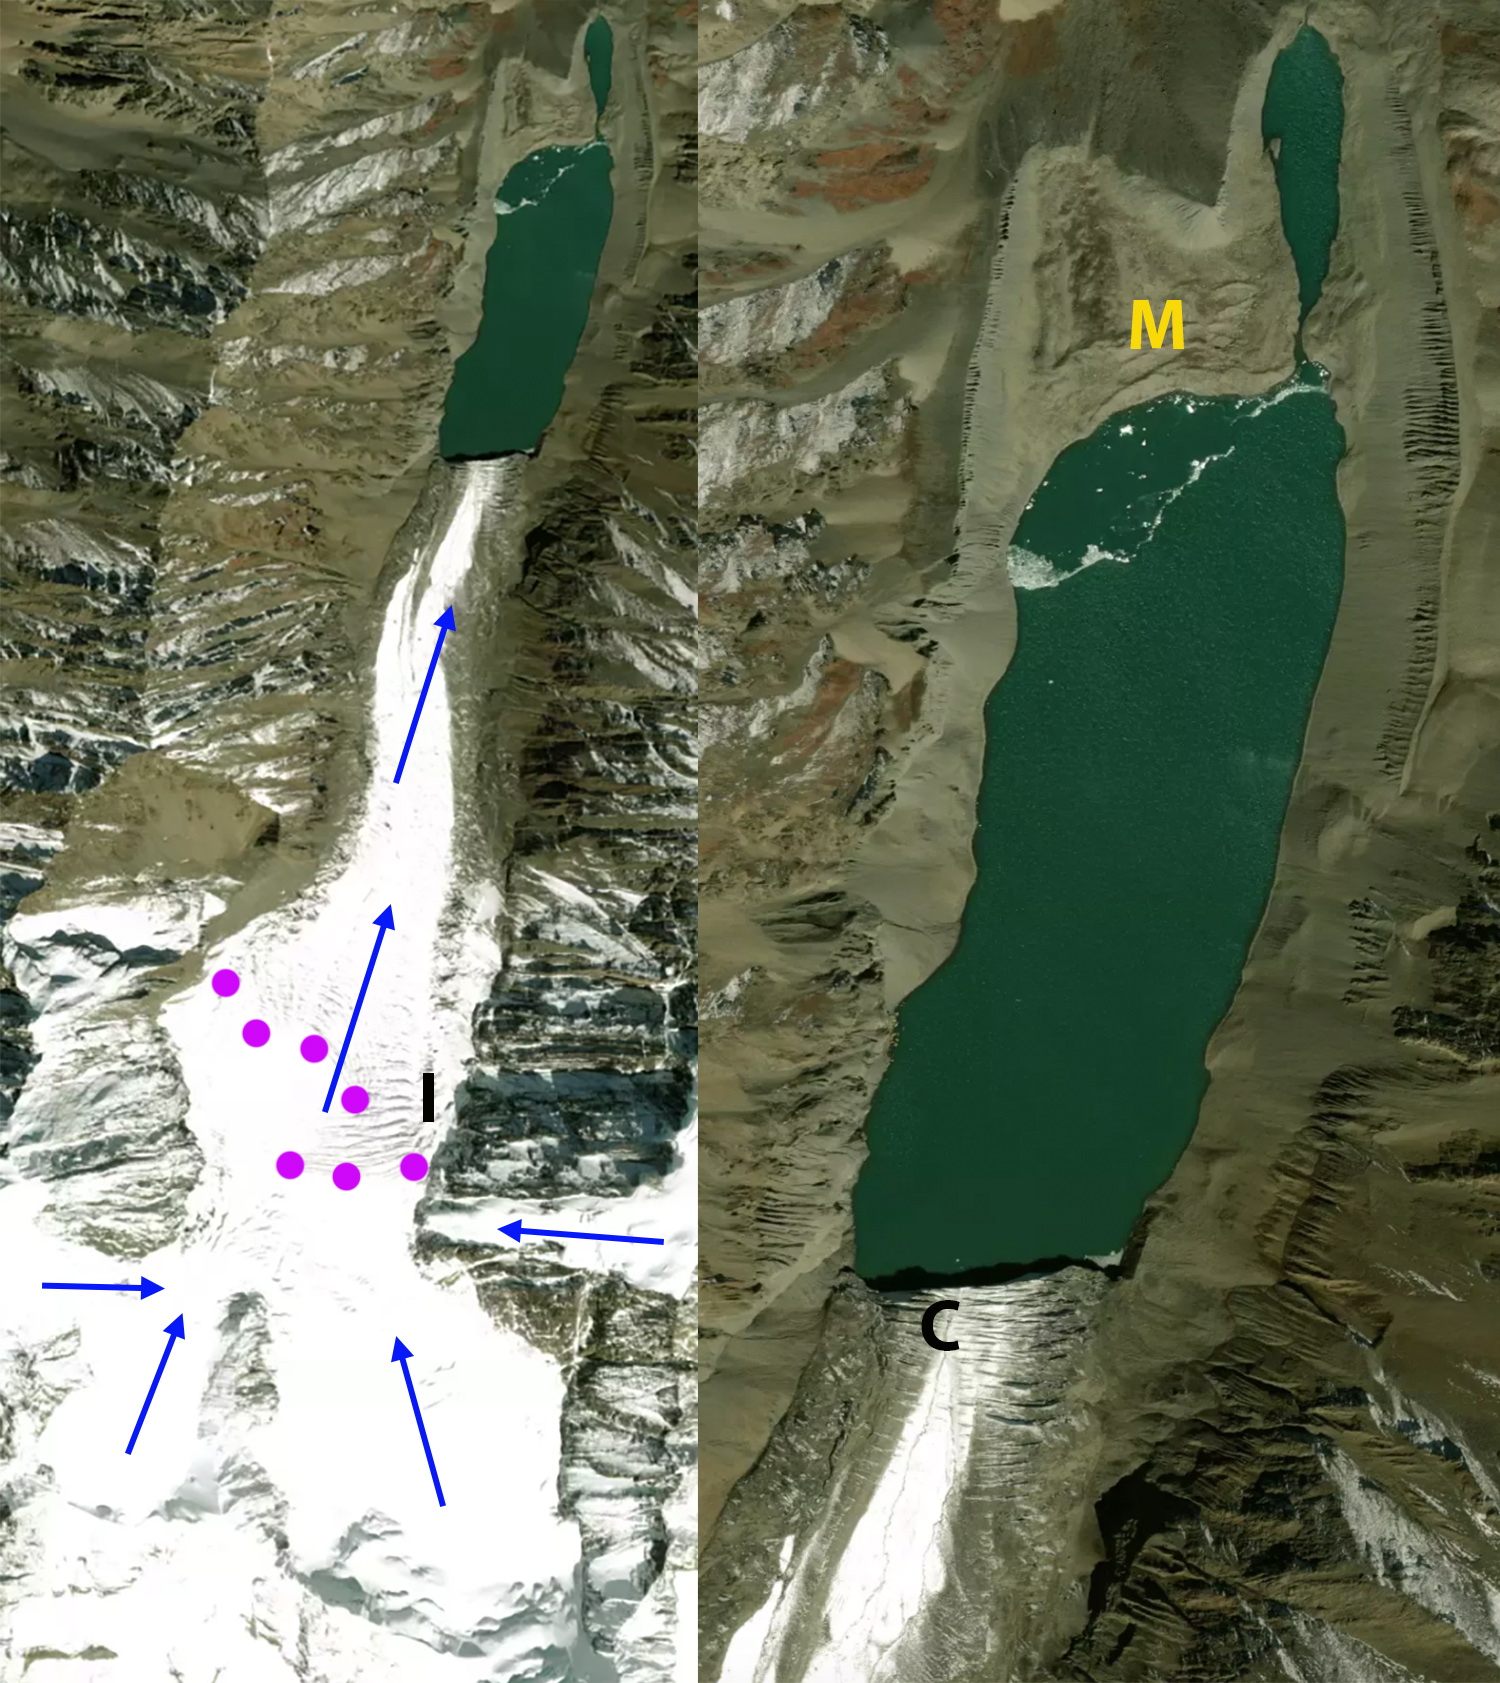
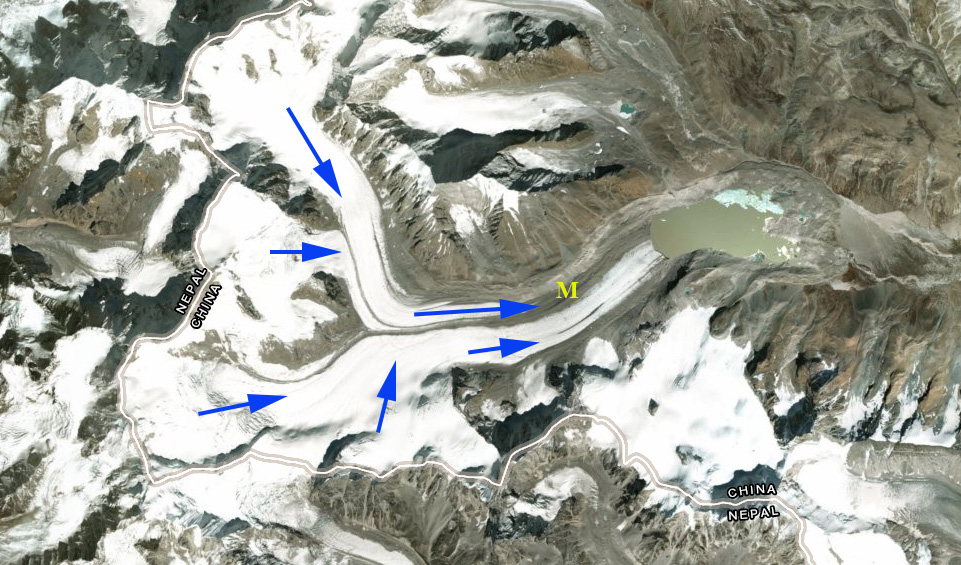
Gangxico Lake fed by Reqiang Glacier in Digital Globe image from 2015 indicating the moraine that impounds the lake with yellow arrows.

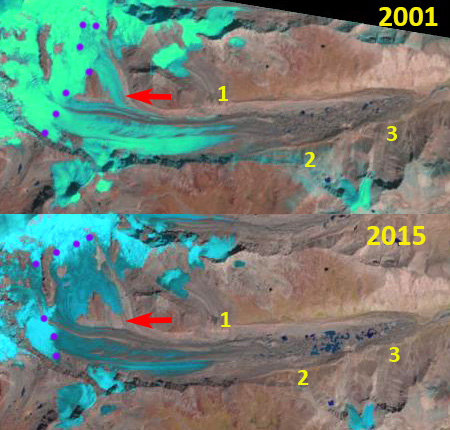
Galongco Lake fed by Jicongpu Glacier in Digital Globe image from 2015 indicating the moraine that impounds the lake with yellow arrows.


Shie Glacier, Bhutan-China Retreat Reduces Lake Contact

Shie Glacier Bhutan-China in Landsat images from 1996 and 2019.  Red arrow is the southern terminus location in 1996, yellow arrow the 2019 terminus location and red dots the margin of the eastern terminus in contact with the lake in 1996.

Shie Glacier terminates in a lake on the northern flank of the Bhutan Himalaya draining north from Kangphu Kang, in a region that is claimed by both China and Bhutan.  Here we examine 1996-2019 Landsat imagery to identify glacier change. Bajracharya et al (2014) reported a 23% loss in glacier area from 1980-2010.  This retreat led to a 20% increase in the number of glacier lakes in the region  (Che et al, 2014)

In 1996 the glacier had two prominent termini ending the lake. The eastern terminus had a 1300 m wide front in the lake and the southern terminus a 400 m wide front.  The southern are terminated 800 m up a narrow inlet.  In 2000 there was a minor retreat of less than 100 m of both terminus locations since 1996.   in 2011 both glaciers had an active calving front in the lake, with the eastern terminus, between Point A and B, reduced to 800 m of front in contact with the lake. The southern terminus between Point C and D has retreated 350-400 m since 1996.

By 2018 the southern terminus had retreated 600 m further up the inlet. In 2018 the eastern glacier front reached the lake on a front less than 100 m wide. In 2019 the eastern terminus does not reach the lake on a measurable front.  The eastern terminus has retreated 400 m on the northern margin, 350 m in the glacier center and 800 m on the southern margin. The southern terminus has retreated 700-800 m since 1996.  The reduced connection of the glacier to this lake will alter the nutrient flux to the lake.  The lake has had a consistent water level during the entire period and the terminal moraine that helps impound the lake is deeply incised.  The combination along with reduced frontal suggests the GLOF threat is low

High snowlines in recent years will continue to drive retreat here and on adjacent Theri Kang and Lugge Glacier.

2011 Digital Globe image of Shie Glacier terminus, eastern terminus between Point A and B, southern terminus between Point C and D.

Shie Glacier Bhutan-China in Landsat images from 2000 and 2018.  Red arrow is the southern terminus location in 1996, yellow arrow the 2019 terminus location and red dots the margin of the eastern terminus in contact with the lake in 1996.

Asejiaguo Glacier, China Retreat and Lake Expansion

Asejiaguo Glacier in Landsat images from 1993 and 2018.  The yellow arrow indicates the 2018 terminus and the red arrow the 1993 terminus location.  Point 1 and 2 are areas of expanding bedrock in the 5400-5600 m.

Asejiaguo Glacier drains east from the China-Nepal Border and is at the headwaters of the Yarlung Tsangpo, which becomes the Brahmaputra River.  The Yarlung Tsangpo powers the 510 MW Zangmu Hydropower Station.  Gardelle et al, (2013) identified this glacier as part of the West Nepal region, which experienced mass loss averaging -0.32 m/year from 1999-2011. The changes of the Asejaguo Glacier are examined for the 1993 to 2018 period using Landsat imagery. Neckel et al (2014) examined changes in surface elevation of the glaciers and found this region lost 0.37 m/year from 2003 to 2009.

In 1993 the glacier terminated in a small proglacial lake that is ~1 km long at 4900 m. At Point 1-2 there is limited exposed bedrock at 5400-5600 m, which is near the snowline,  the head of the glacier is at 6000 m.  There is a prominent medial moraine that begins at 5300 where the north and south tributaries join.  The greater width of the southern tributary indicates this is the large contributor.  In 1994 the snowline is higher at 5500 m, but there is still only a small outcrop of bedrock at Point 2.  By 2016 the proglacial lake has expanded to a length of over 2 km.  At Point 1 and 2 there is a greatly expanded area of bedrock, and the separation of a former tributary near Point 1 from the main glacier. In November 2018 there is fresh snowfall obscuring the exposed bedrock at Point 1 and 2. The retreat from 1993-2018 is 1.5 km, and the expanding proglacial lake is over 2.5 km long. The expanding bedrock areas in the 5400-5600 m range indicate the reason rise in snowline that has generated mass loss and ongoing retreat.

The behavior of this glacier matches that of other glaciers in the regions such as Chako Glacier and Ribuktse Glacier

Asejiaguo Glacier in Landsat images from 1994 and 2016.  The yellow arrow indicates the 2018 terminus and the red arrow the 1993 terminus location.  Point 1 and 2 are areas of expanding bedrock in the 5400-5600 m.

Asejiaguo Glacier, blue arrow indicate flow direction, M indicates the medial moraine, the China-Nepal border is also noted.

Daishapu Glacier, China Retreat Lake Expansion

Daishapu Glacier (D) and Ruorangqubu Glacier (R) in 1993 and 2018 Landsat images.  The yellow arrows indicate the 2018 terminus location of both glaciers and the purple dots the snowline. Notice the lake expansion at the terminus of both glaciers. Locations 1-4 are tributaries.

Daishapu Glacier and Ruorangqubu Glacier are in the eastern Himalaya located just north of the Himalayan divide and draining north into the Yarlung Zangbo. This is a remote area with little development downstream for 100+ km.  Li et al (2010) examined glacier change over the last several decades in China and found ubiquitous glacier retreat and commonly lake formation as glaciers retreated.

In 1993 Daishapu Glacier has a debris covered terminus ending in a 1 km long proglacial lake at 5000 m.  Tributaries 1-4 all reach the main Daishapu trunk. The snowline in 1993 is at 5600 m in December.  Rurorangqubu Glacier had a low slope debris covered terminus without a proglacial lake at 5300 m.  A tributary from the east joins the glacier 1 km above the terminus.  By 2001 Daishapu has retreated several hundred meters, while tributaries 1-4 all still connect. The snowline is at 5800 m in December. Rurorangqubu still has no proglacial lake. In 2015 both glaciers have proglacial lakes at the terminus. Tributary #2 no longer reaches the main Daishapu.  The eastern tributary no longer reaches the main trunk of Rurorangqubu Glacier.  In 2018 the proglacial lake at the end of the Daishapu Glacier is 1800 m long, with a retreat of 700-800 m since 1993.  Tributary #4 has now begun to detach. Rurorangqubu Glacier has a 600 m long proglacial  that has formed which represents the retreat of the glacier since 1993.  The snowline in 2018 is at 6000 m in December.  The high snowline persisting into December is a trend in the area that is not positive for glacier mass balance, this has been observed around Mount Everest  and on the China-Bhutan border. These two glaciers at the crest of the Eastern Himalaya are both retreating, have expanding proglacial lakes and separating tributaries.  This is a common story in the region as seen at Thong Wuk Glacier and Jiongla Glacier.

Daishapu Glacier (D) and Ruorangqubu Glacier (R) in 2001 and 2015 Landsat images.  The yellow arrows indicate the 2018 terminus location of both glaciers and the purple dots the snowline. Notice the lake expansion at the terminus of both glaciers. Locations 1-4 are tributaries.

Lapche Glacier, China Supraglacial Ponds Transitioning to Lake

Lapche Glacier (Tibet 1), China in 1992 and 2018 Landsat images.  The expansion of supraglacial ponds is evident between Point 2 and 3. A tributary that detaches between 1992 and 2018 is indicated by red arrow.  The end of the clean ice and start of debris cover ice is just below Point 1 in 1992 and well above this Point in 2018. 

Lapche Glacier (Tibet 1), China flows east from Lapche Kang (Lobuche Kang) in the Bum Chu River Basin. King et al (2017) examined the mass balance of 32 glaciers in the Everest region for the 2000-2015 period including the Lapche, which they called Tibet 1, and found a mass loss of ~0.5 m/year, with the loss of lake terminating glaciers at ~-0.7 m/year.  King et al (2017) also observed that a number of these glaciers had nearly stagnant tongues with coalescing and expanding supraglacial ponds. Here we examine the expansion of the supraglacial ponds from 1992 to 2018 using Landsat images.

The lower four kilometers of Lapche Glacier in 1992 is relatively flat with the terminus at 5100 m and four kilometers upglacier at just 5200 m. In this stretch there are several small isolated supraglacial ponds between Point 2 and 3.  At Point 1 is the end of the clean ice section of the glacier, with debris cover obscuring the underlying ice below this point. There is a tributary joining the glacier at the red arrow. In 2001 the snowline is at 5600 m, and there are a few more supraglacial ponds, but with a total surface area under 0.1 square kilometers.  In 2015 the tributary at the red arrow has detached and the area covered by ponds has expanded and now cover ~0.5 square kilometers.  The snowline in 2015  is at 5650-5750 m. In 2018 the supraglacial ponds have largely coalesced, and have an area of ~1.0 square kilometers.  These lakes are on the verge of creating one larger lake as has happened on Rongbuk Glacier .  The debris covered portion of the glacier now begins above Point 1, 1 km upglacier of its 1992 location.  The snowline in 2018 is at 5650-5750 m.

King et al (2018) indicate a velocity of less than 10 m/year in the lower 5 km of the glacier, essentially stagnant.  Point 1 is just over 6 km above the 1992 terminus. The retreat here is difficult to discern, but with the proglacial lake development it will soon be identifiable and in line with that of other glaciers in the area Duiya and Yanong.   Zhang et al (2010) observed the loss of glacier area and lake expansion in the region from 1976-2006 driven by warming.

Lapche Glacier (Tibet 1), China in map view.  Point 1-3 same as in images, ice flow indicated by blue arrows, elevation contours labelled at 51oo and 5200 m. Debris cover beginning noted at DC.

Lapche Glacier (Tibet 1), China in 2001 and 2015 Landsat images.  The expansion of supraglacial ponds is evident between Point 2 and 3. A tributary that detaches between 2001 and 2015 is indicated by red arrow.  

High Glacier Snow Line Post-Monsoon 2018 on Bhutan-China Border

Angge Glacier (A) and Bailang Glacier (B) in China and Chubda Glacier (C) in Bhutan in Post Monsoon 1995 and 2018 Landsat images indicating the snowline purple dots is exceptionally high in 2018.  Red arrow is the 1995 terminus location and yellow arrows the 2018 terminus location. Point 1-3 are glacier passes from China into Bhutan.

The end of the monsoon season leads to finally some clear satellite images of snowlines and glaciers in the Himalaya.  A Landsat image from September 12, 2018 along the China-Bhutan  indicates high snowlines (5500 m) that reach the top of some glaciers and the glacier divide between nations on other glaciers.

Bailang Glacier and Angge Glacier, China are adjacent to the Chubda Glacier, Bhutan.  A These glaciers drain north and south from near Chura Kang on the Bhutan/China border.  Despite being in different nations on different flanks of the Himalaya, the retreat and resultant lake expansion is the same. These are all summer accumulation type glaciers that end in proglacial lakes.  All three lakes are impounded by broad moraines that show no sign of instability for a potential glacier lake outburst flood.  The number of glacier lakes in the region has increased 20%  (Che et al, 2014)   The Chubda Glacier terminates in Chubda Tsho, a glacier moraine dammed lake, Komori (2011) notes that the moraine is still stable and the lake is shallow near the moraine, suggesting it is not a threat for a glacier lake outburst flood.  Jain et al., (2015) noted that in the last decade the expansion rate of this lake has doubled. The glacier feeds the Chamkhar Chu Basin.

Here we examine 1995-2018 Landsat images from the post monsoon period to identify both retreat and the anomalously high snowlines in 2018.  In 1995 the highest observed snowline is at 5300 m, purple dots, Point 1 -3 are glacier passes from China into Bhutan that are snowcovered.  The glaciers terminate at the red arrows.  In 2000 the highest observed snowline is 5250-5300 m. There is limited retreat since 1990. In 2017 the highest observed snowline is at 5300-5350 m.  In 2018 the highest observed snowline is at 5500-5550 m.  The glacier passes at Point 1 and 2 lack any snowcover.  The glaciers at Point 3 have no retained snowcover despite top elevation above 5400 m.  Bailang Glacier has retreated 900 m from 1995 to 2018 that has led to lake expansion.   A retreat 1995-2018 retreat of 800 m of Angge Glacier has led to lake expansion.  A retreat of Chubda Glacier of 800 m  has led to lake expansion from 1995-2018 has led to lake expansion. 

2000 Landsat image from the post monsoon indicating the snowline purple dots.  Red arrow is the 1995 terminus location  Point 1-3 are glacier passes from China into Bhutan.

2017 Landsat image from the post monsoon indicating the snowline purple dots.  Red arrow is the 1995 terminus location  Point 1-3 are glacier passes from China into Bhutan.

Sept. 12 2018 Landsat image indicating the snowline purple dots is exceptionally high in 2018.  Red arrow is the 1995 terminus location and yellow arrows the 2018 terminus location. Point 1-3 are glacier passes from China into Bhutan.