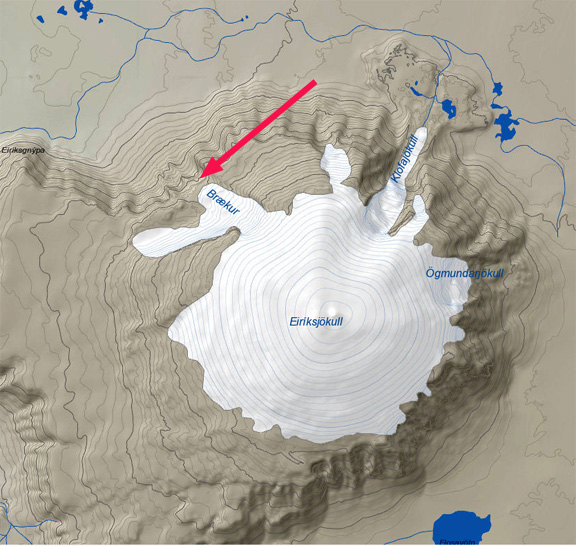
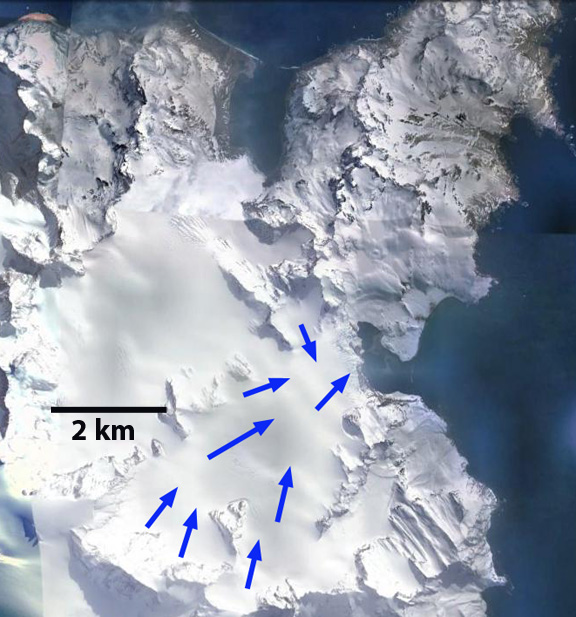
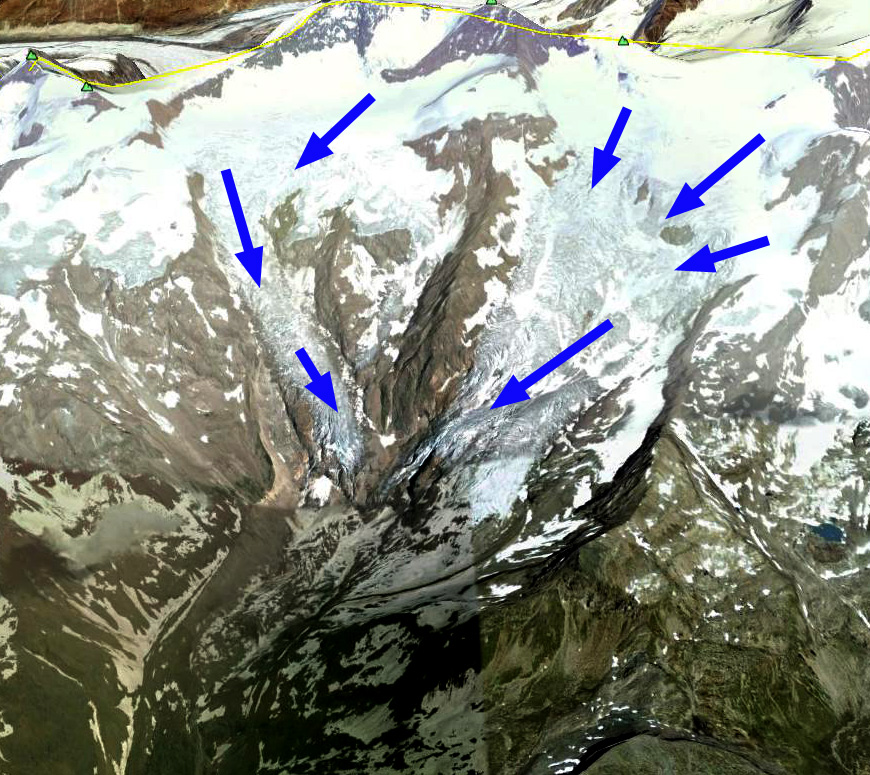
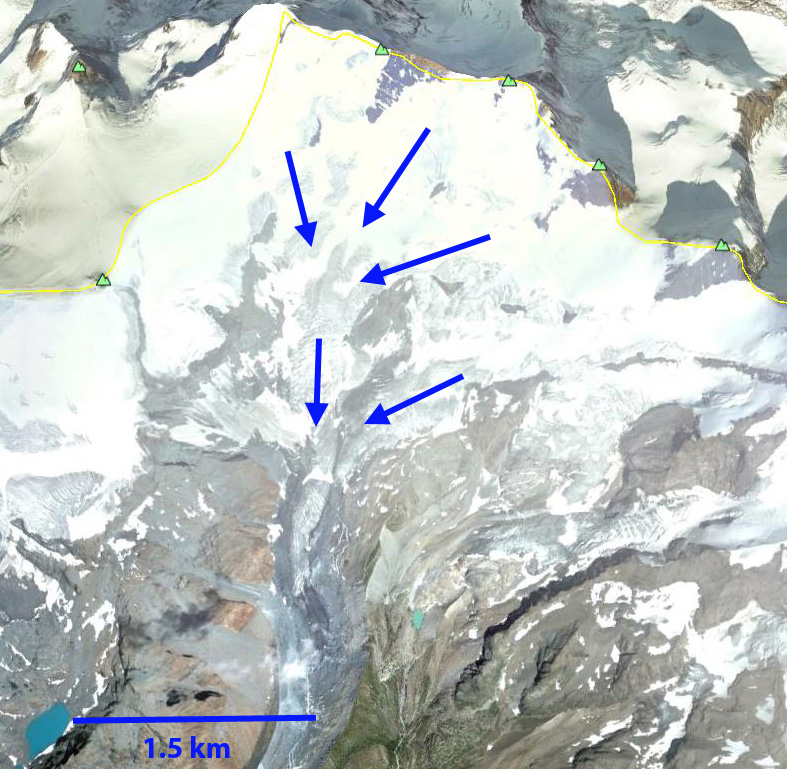
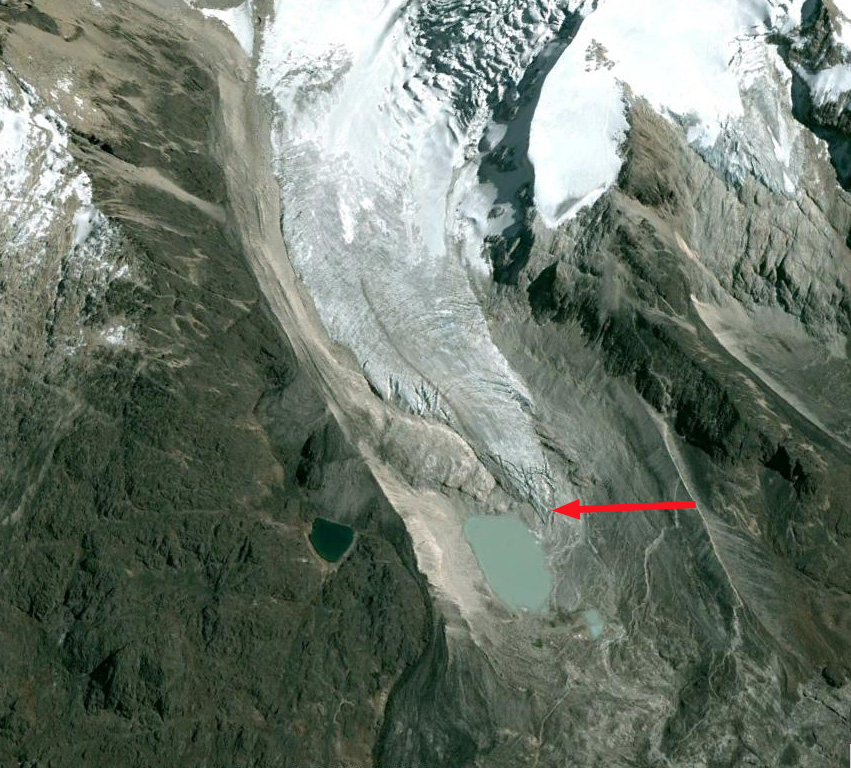
Zongo Glacier, Bolivia extends 2.9 km down the south side of Huayna Potosi from 6000 m to 4900 m. Zongo Glacier is a small valley glacier located 30 km north-east of La Paz, and its runoff is directed to an important hydraulic power station which supplies La Paz. Note Laguna Milluni in foreground of the first image. The dam is visible as is the power station to the right and below the lake. The glacier has considerable snowcover on its upper section and crevassing. This indicates a persistent accumulation zone. In 1991 a glaciological research program was established on Zongo Glacier to monitor mass balance, understand its hydrology and energy balance. The long term director of this research Bernard Francou has been called the glacier guardian. The cumlative mass balance of the glacier from 1991-2013 has been -6.5 m water equivalent. The typical Alpine glaciers undergoes a long accumulation period in winter and a short ablation season in summer. The glaciers of the tropical Andes experience snow accumulation during the wet season, austral summer on their upper regions and maximum ablation during the same season low on the glacier. In the dry season winter there is a period of low ablation over the whole glacier. Mean annual air temperature at the long term snowline at 5250 m is -1.5 °C. Mean precipitation is about 0.9 m/year. 
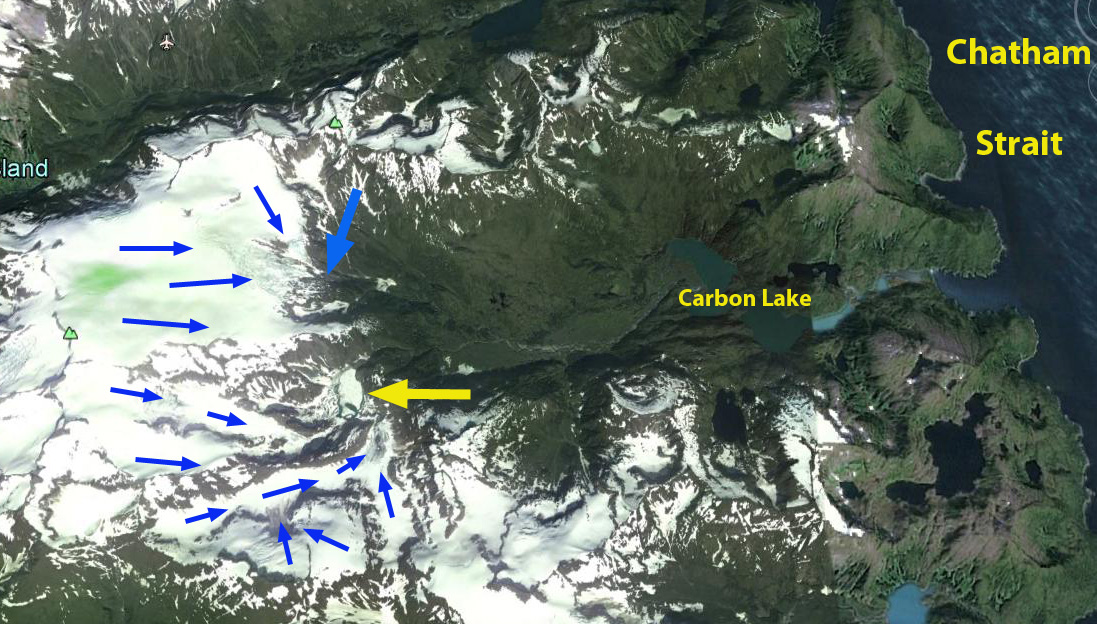
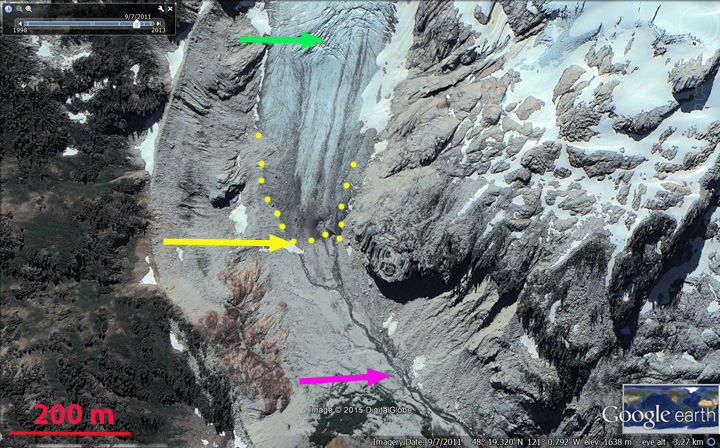
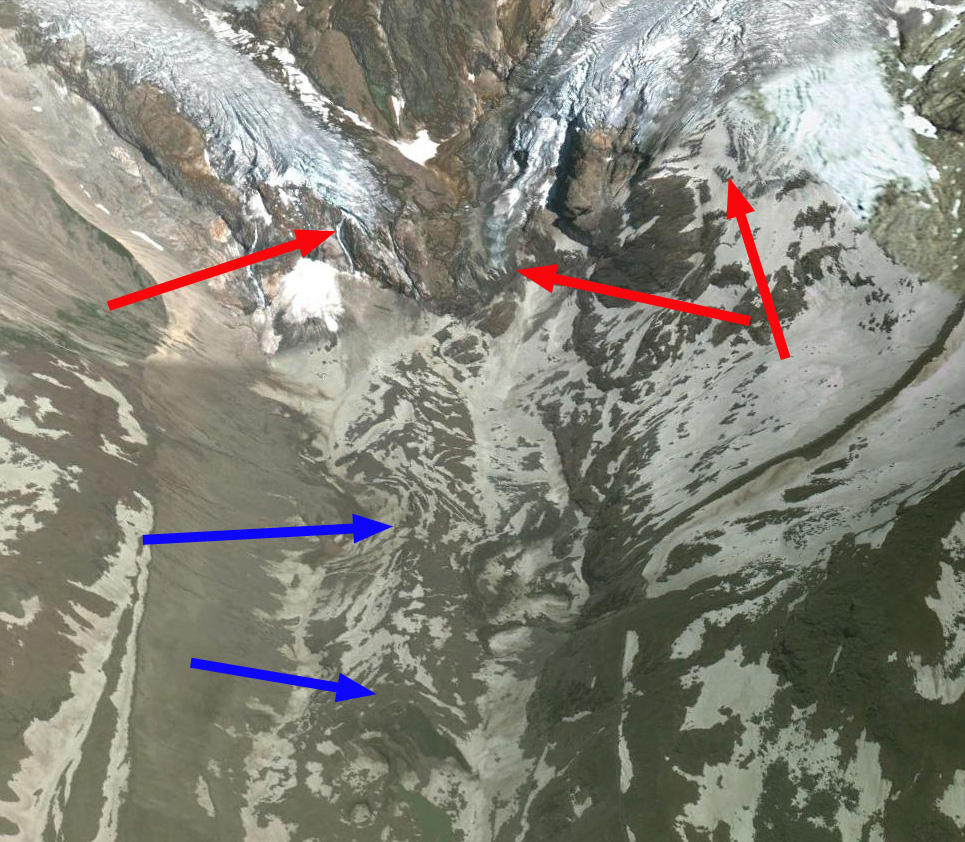
Google Earth image-Huayna Potosi and Zongo Glacier
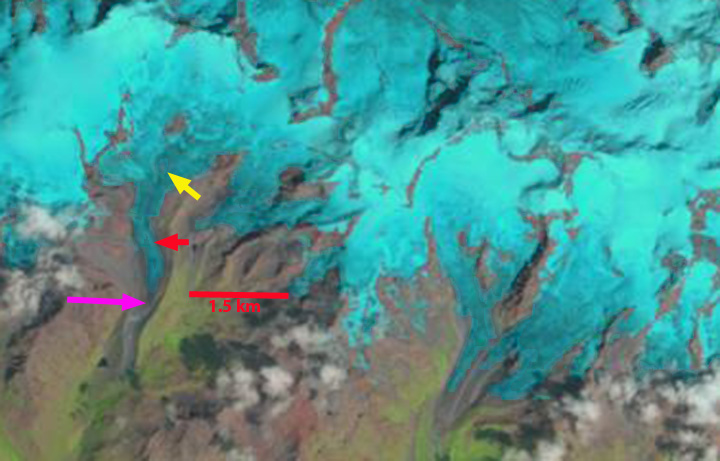
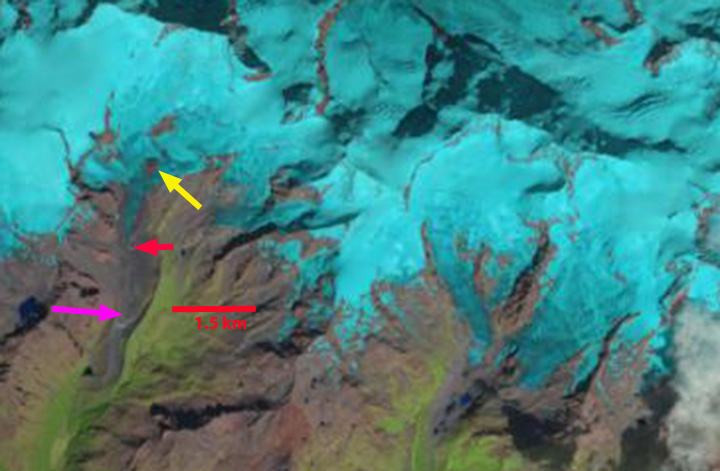
Since 1991 the glacier has lost more than 7 m of thickness and has retreated significantly. The mass balance loss has been most pronounced during El Nino periods. La Nina’s are associated with positive or only slightly negative mass balance. Here we examine Landsat imagery and Google Earth imagery form 1994 to 2014.
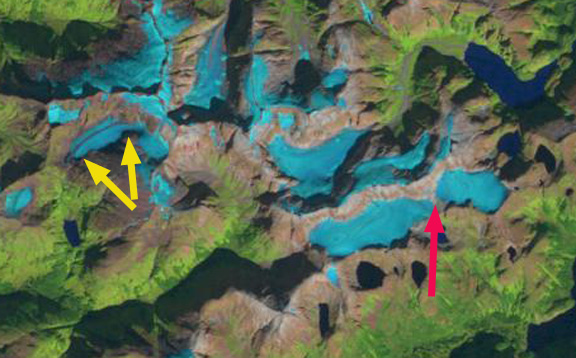
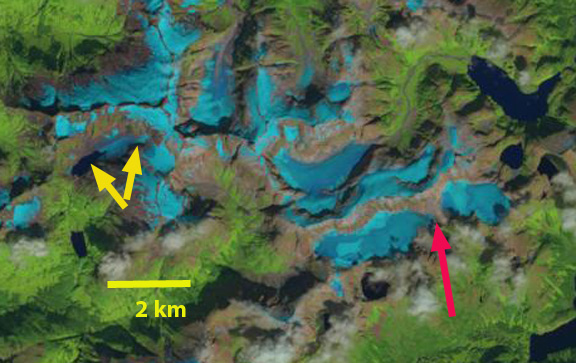
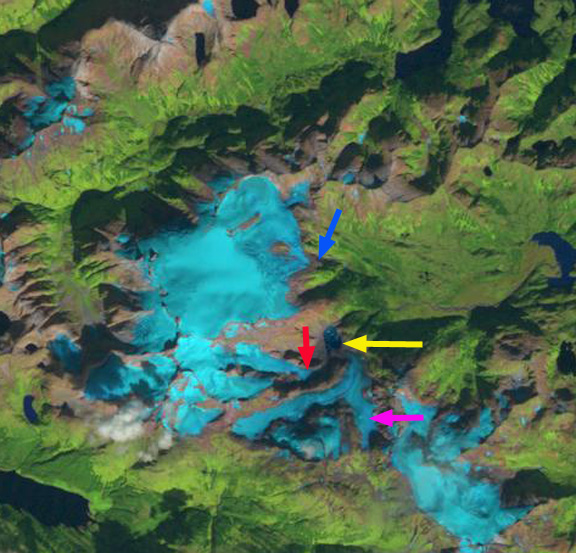
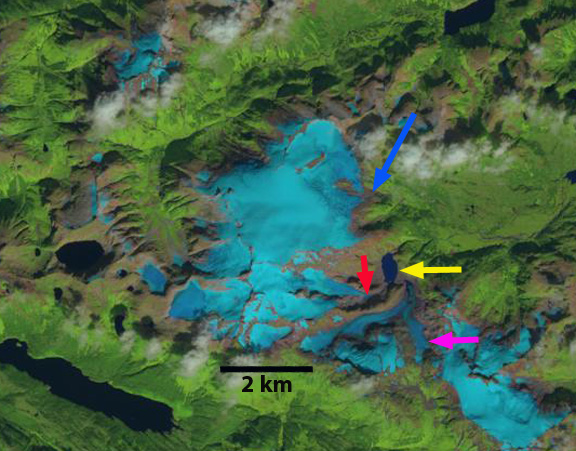
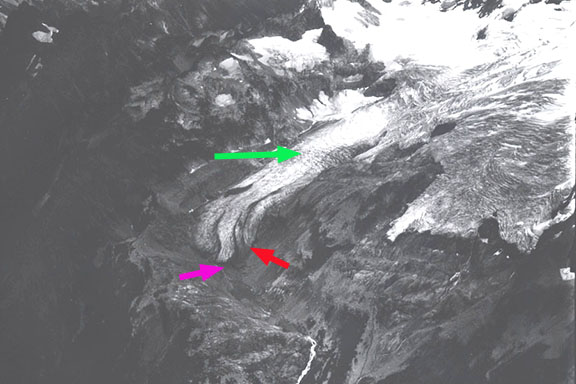
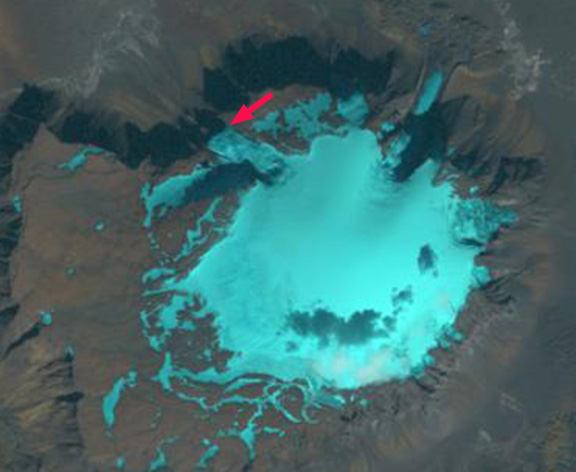
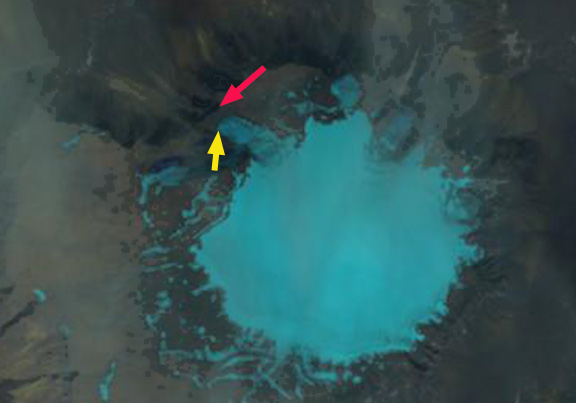
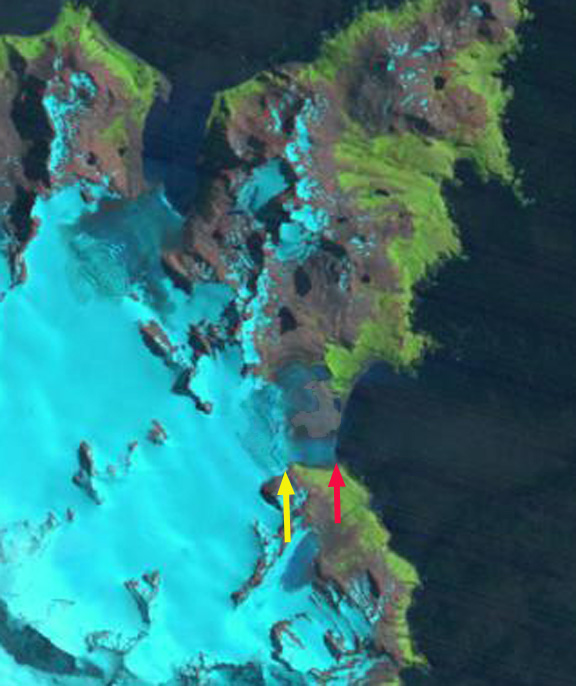
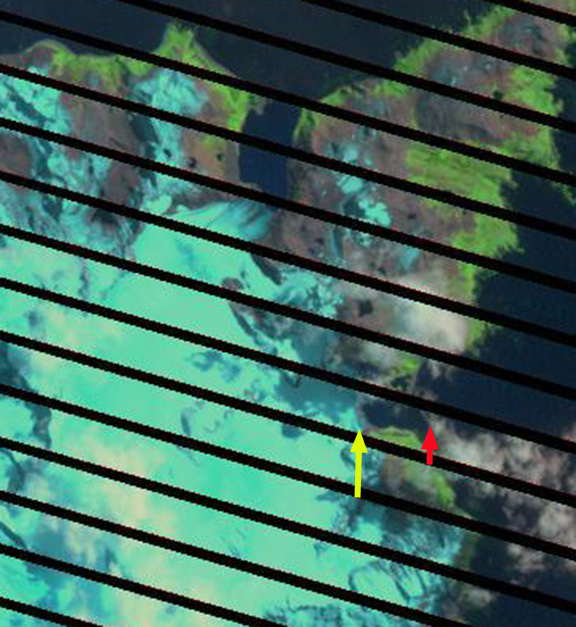
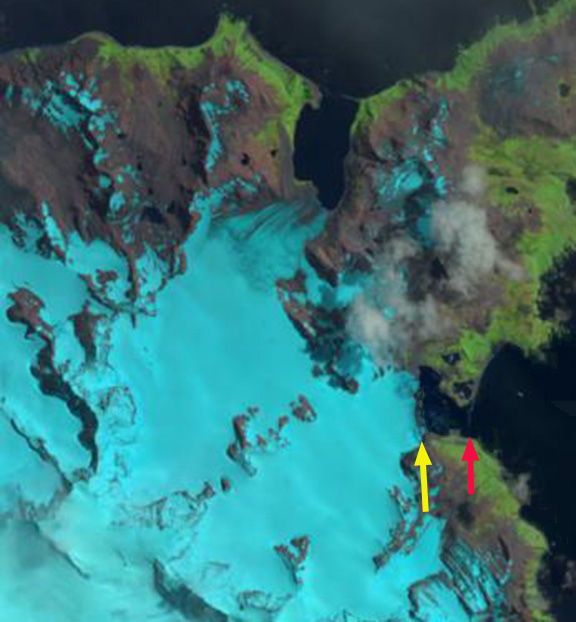
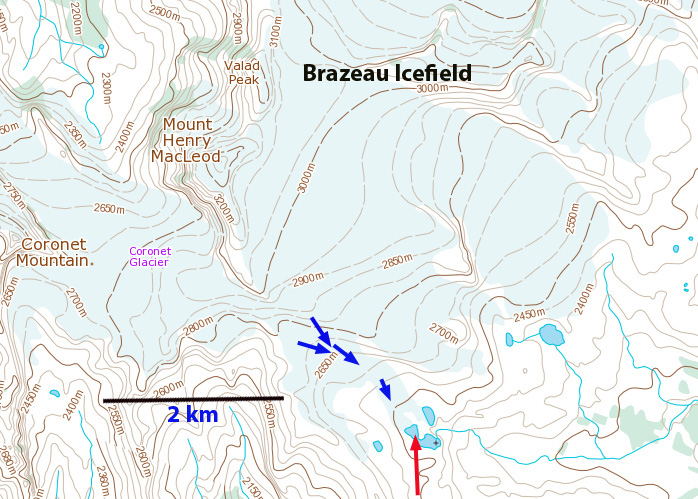
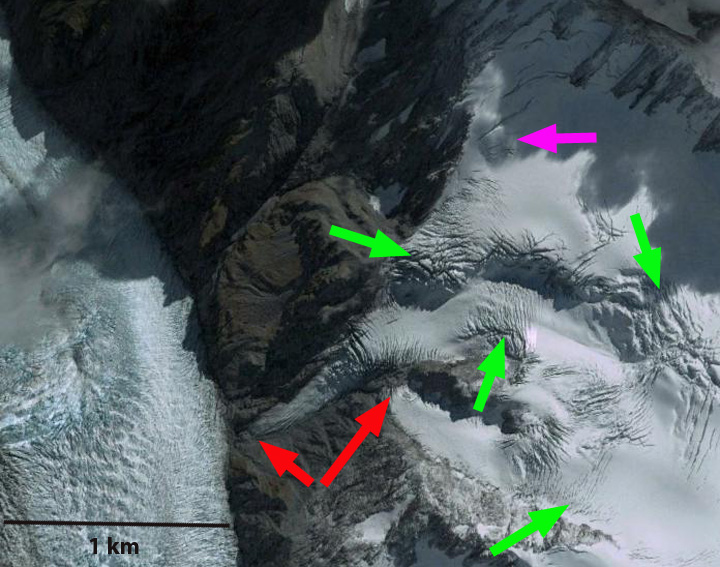
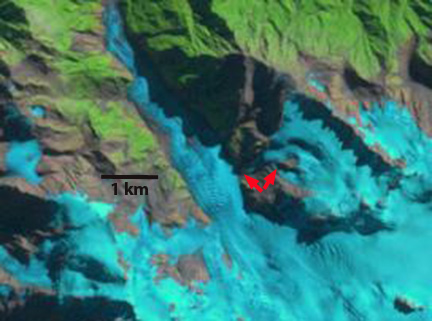
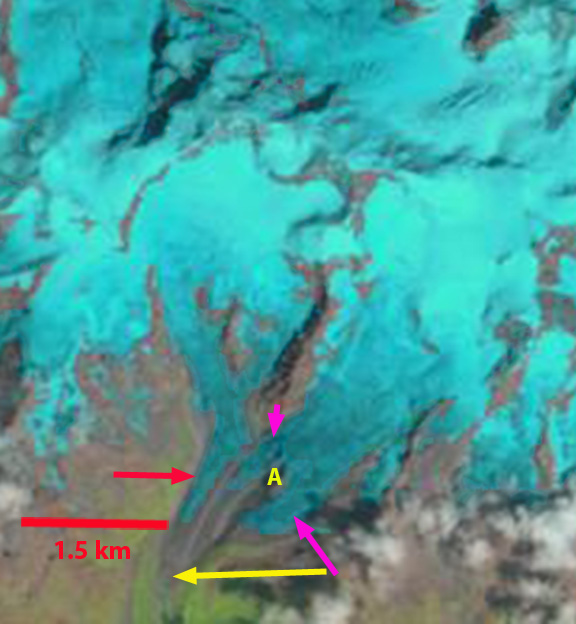
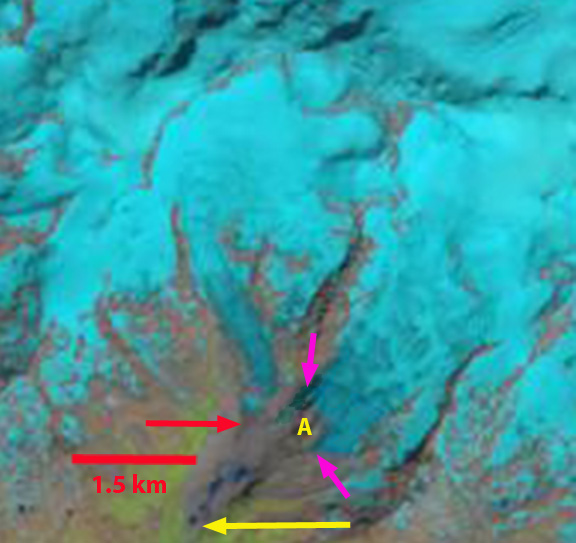
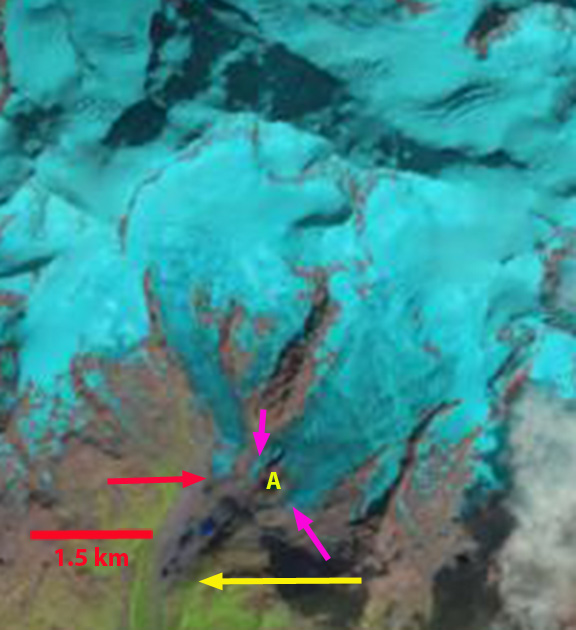
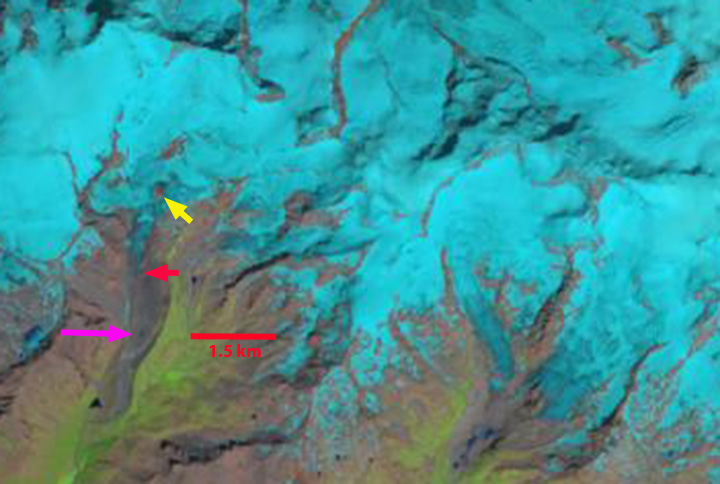
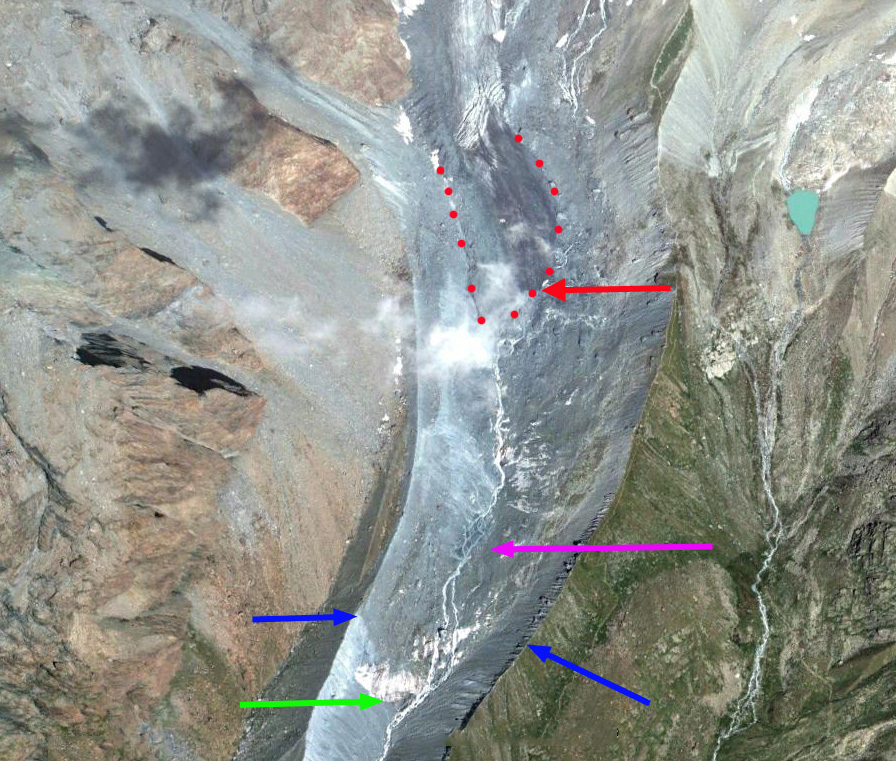
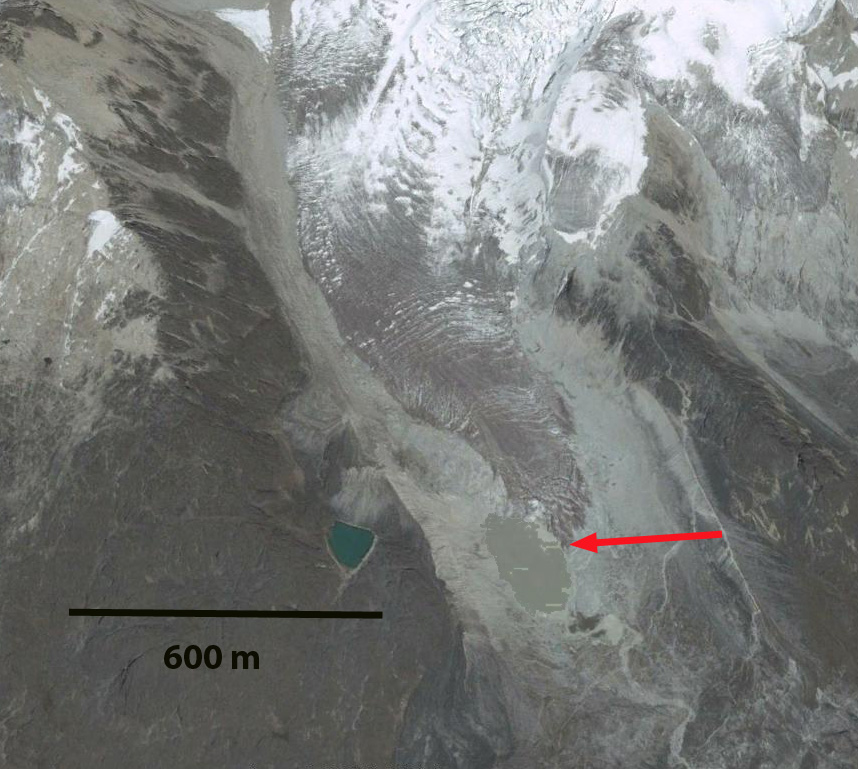
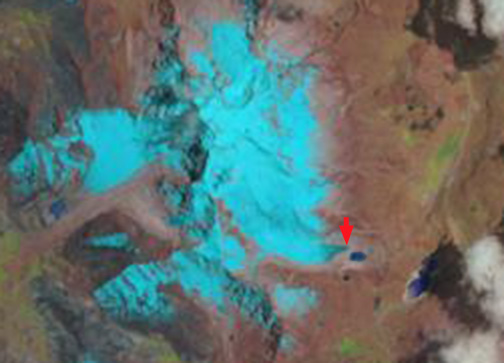
In 1994 there is no lake at the terminus of the glacier, red arrow. By 2004 the Google Earth image indicates the glacier terminating along the northeast shore of the lake, a 90 m retreat in a decade. By 2008 the glacier no longer reaches the edge of the lake, but the front is still crevassed. In 2014 the glacier terminates 100 meters from the lake. Total retreat during the 20 year period is 220 m. The current terminus in 2014 is dirtier and less crevassed than in 2004, and less crevassed than in 2008. The lower 200 m of the glacier is thin, narrow and lacks active crevassing. This relatively stagnant area will melt away in the next decade.
Zongo Glacier continues to have an accumulation zone, a necessary essential for glacier survival, and unlike the nearby Chacaltaya Glacier which disappeared in 2009, it will exist for sometime. The Chacaltaya Glacier is a small glacier, like 80% of the glaciers in this region of the Cordillera Real, and its disappearance puts more pressure on the water resources provided by the larger remaining glaciers such as Zongo Glacier. Rabatel et al (2013) note the striking rise in the freezing levels in the region due both to higher temperatures and more convective activity that is a particular threat to glacier survival.
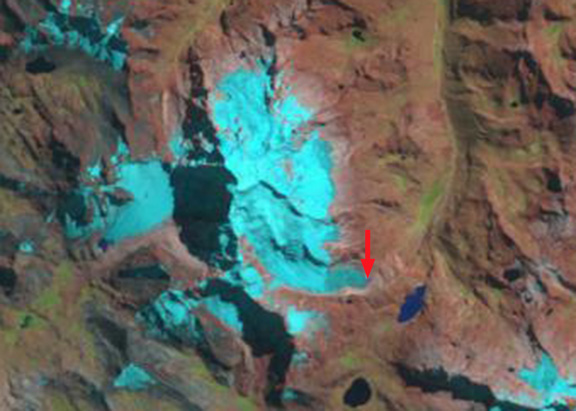
1994 Landsat image
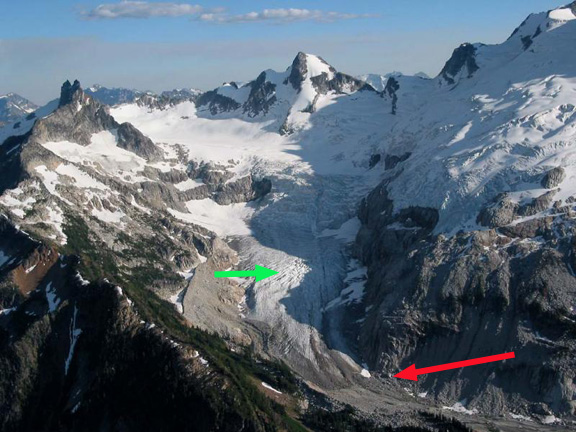
2004 Google Earth image
2008 Google earth image

2014 Google Earth image
2014 Landsat image