Spørteggbreen is a small ice cap just east of Jostdalsbreen, Norway’s largest ice cap. The Norway Glacier atlas chronicles the area of the 10 glaciers that comprise the ice cap at 23.8 square kilometers in 2006 (Andreassen and Winsvold, 2012). The Norwegian Water Resources and Energy Directorate (NVE) has an excellent glacier monitoring program that monitors 10 glaciers that drain Jostedalsbreen from 2008-2013 the net change was retreat on all 10. This is exemplified by Tunsbergdalsbreen. In 2014, 33 of 38 glaciers observed in Norway retreated and 5 did not change. Laumann and Nesje (2014) examined Spørteggbreen during the Holocene. They noted the glacier disappeared from 7300 years before present and reformed approximately 5400 years before present. Their model simulates minor changes from 2011 to 2050. Here we focus on changes to the southwest side of this ice cap using Landsat imagery from 1988-2014 and implications for the near future.
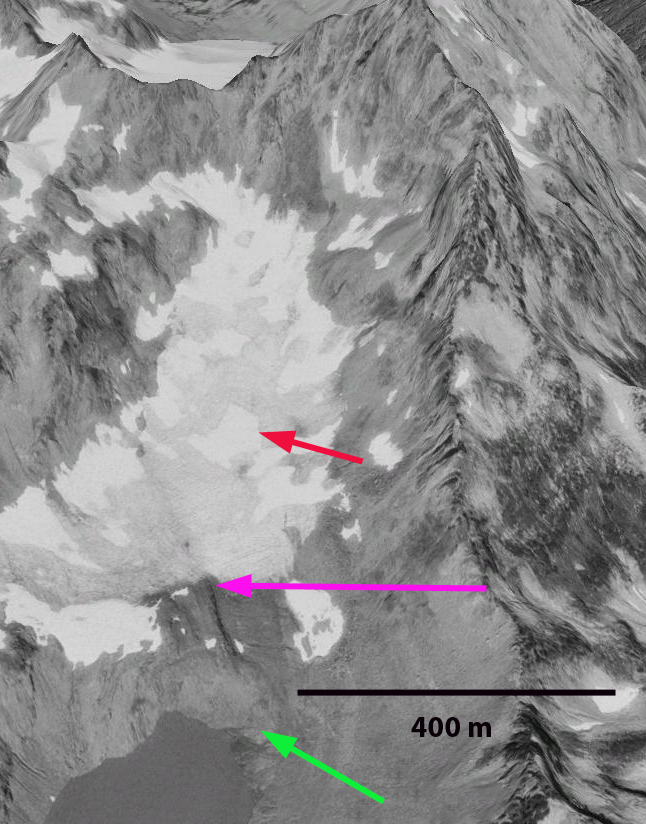
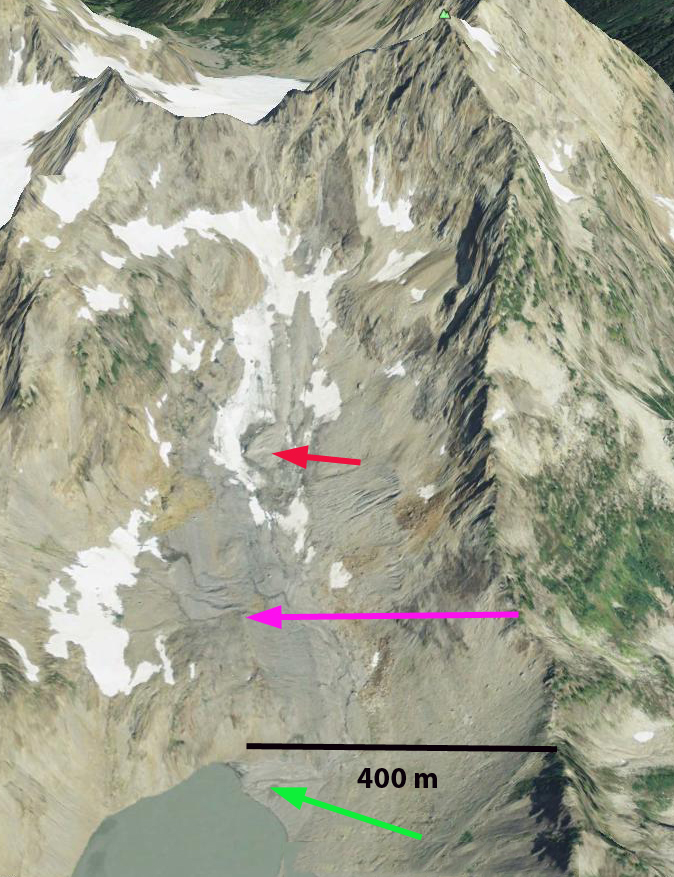
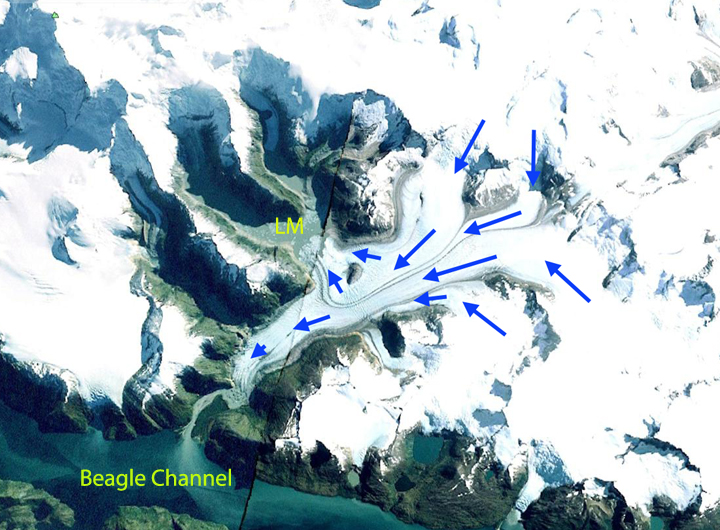
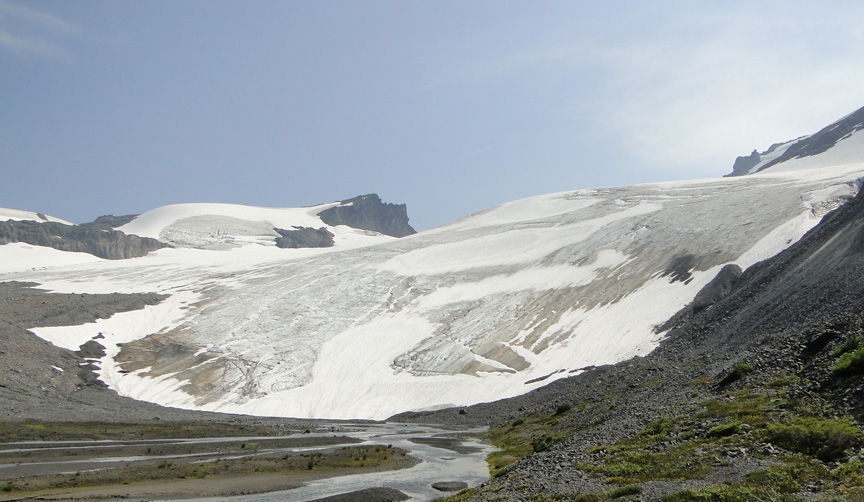
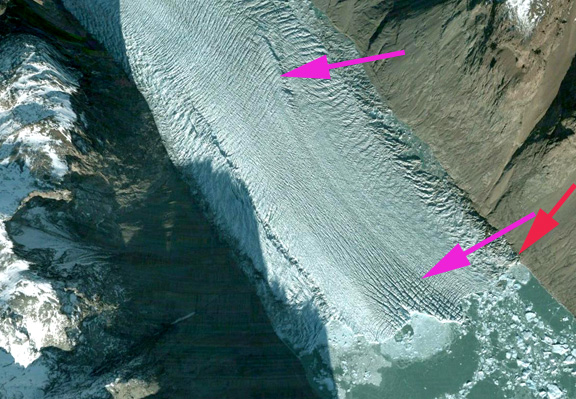
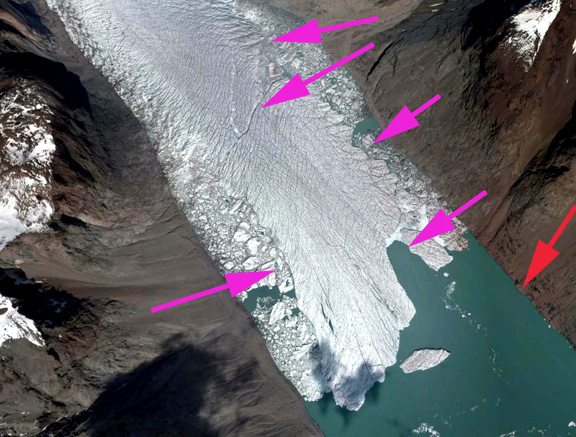
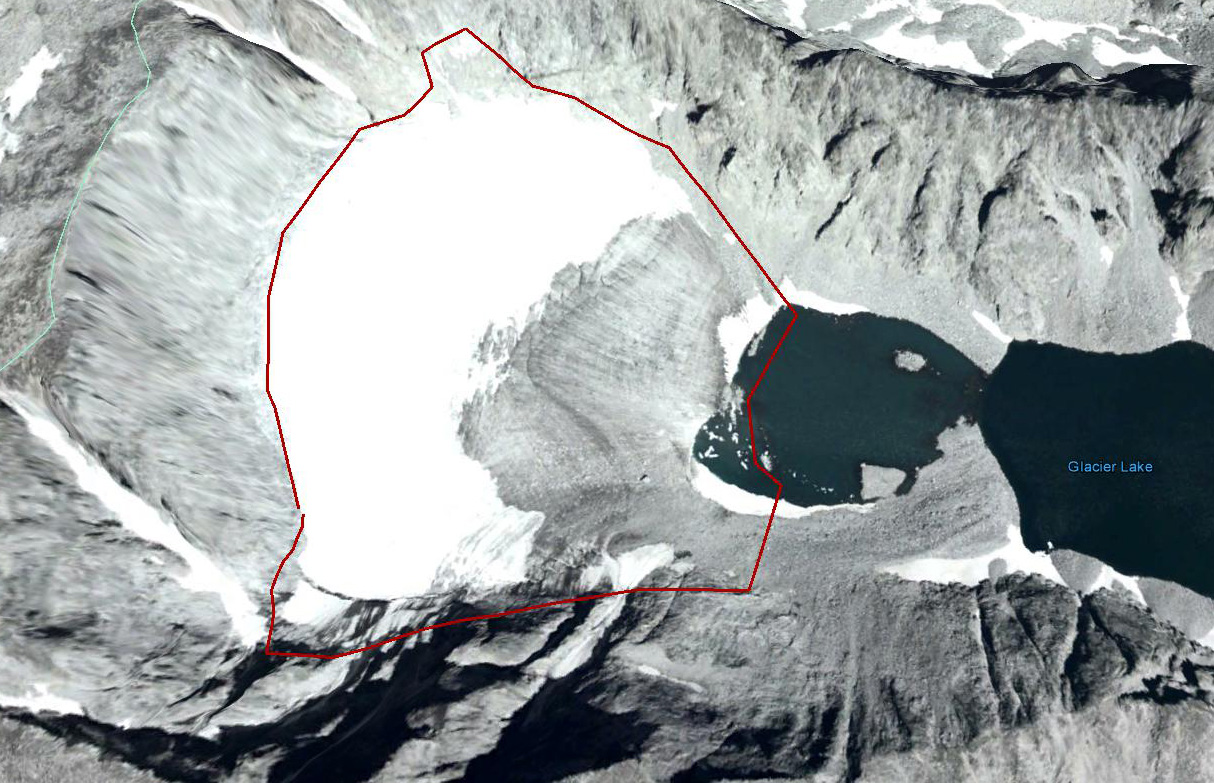
 Norway Glacier atlas image looking southwest toward Jostdalsbreen. The foreground is the main Sporteggbreen, the new lake is in midground and then the separated southwest extension. There is no retained snowcover evident on the southwest extension and it is thin.
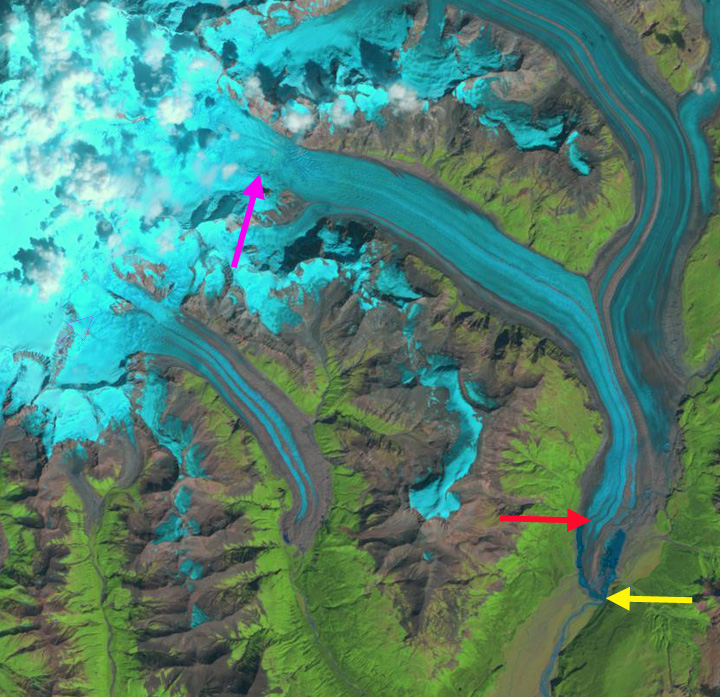
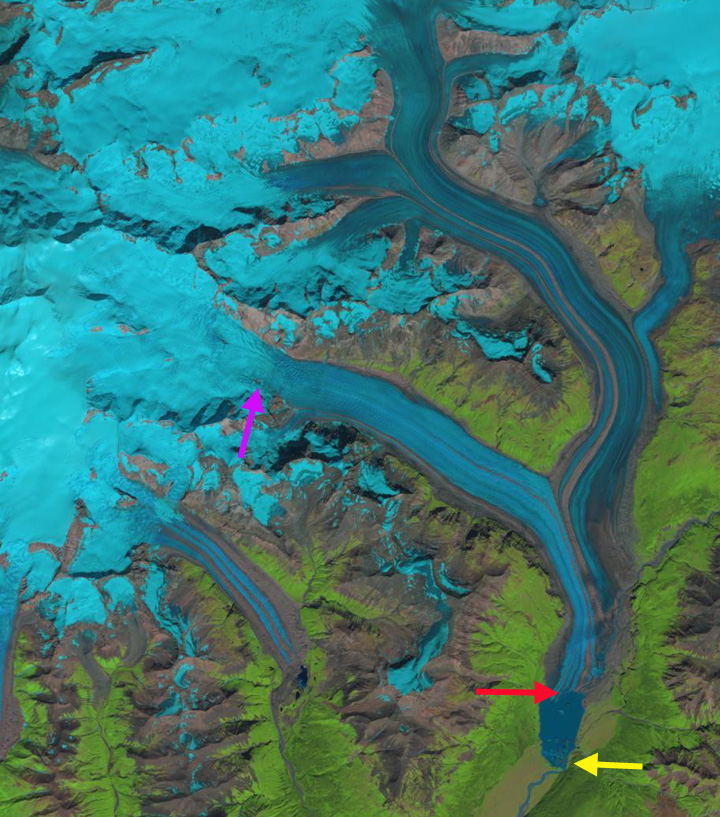
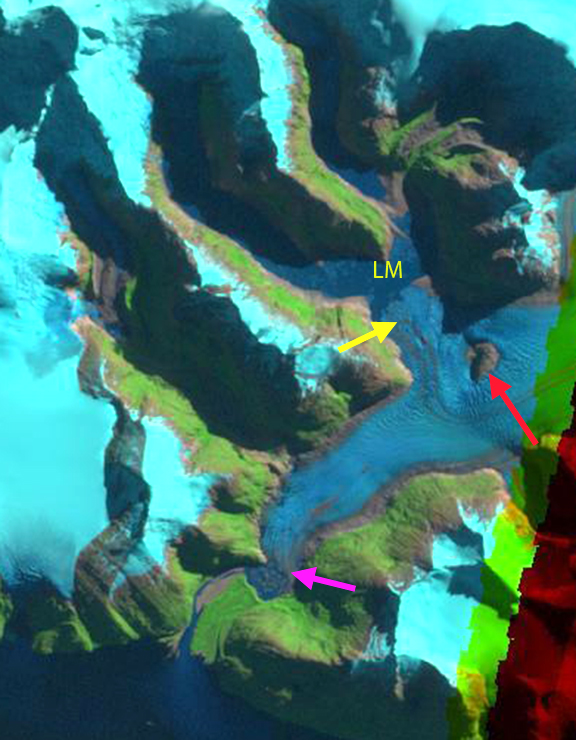
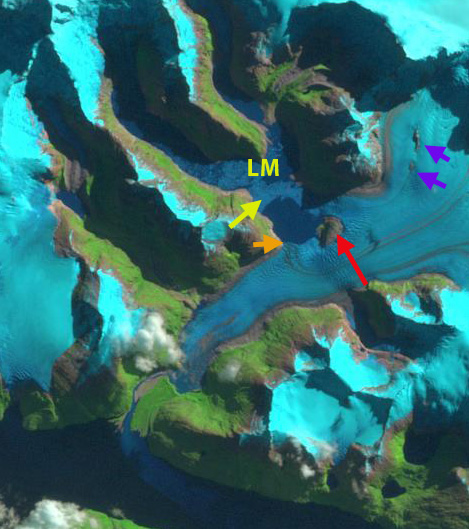
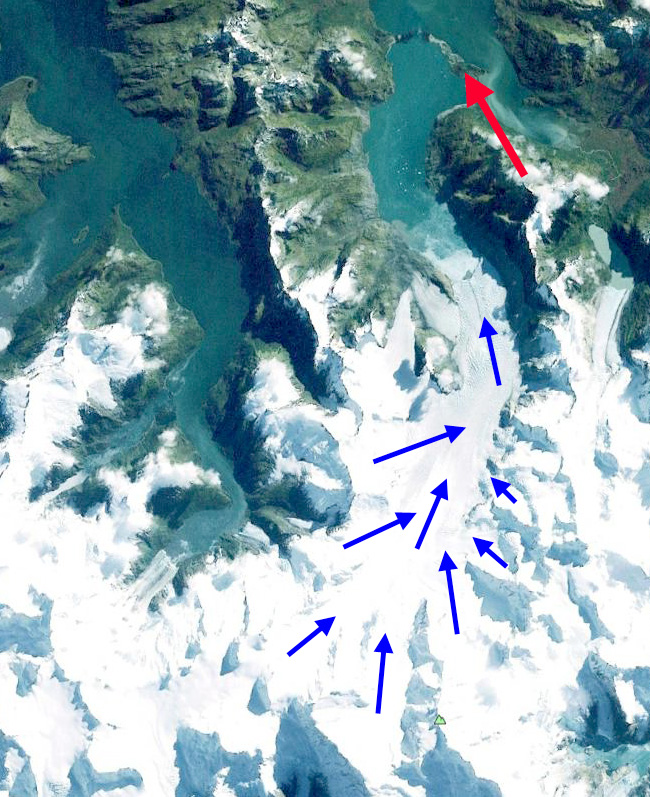
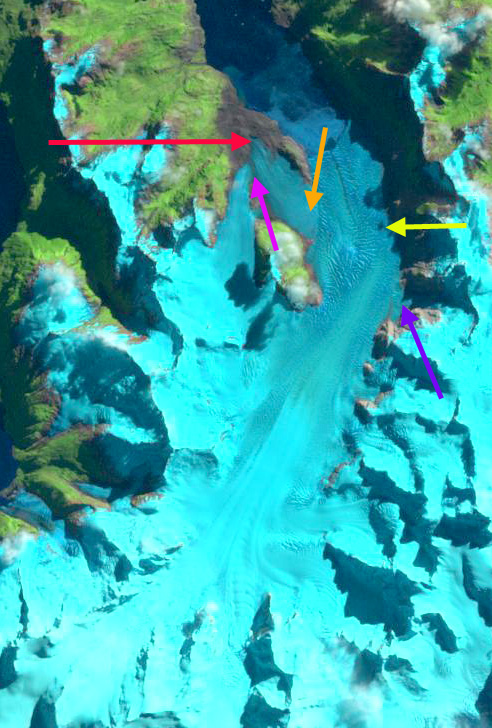
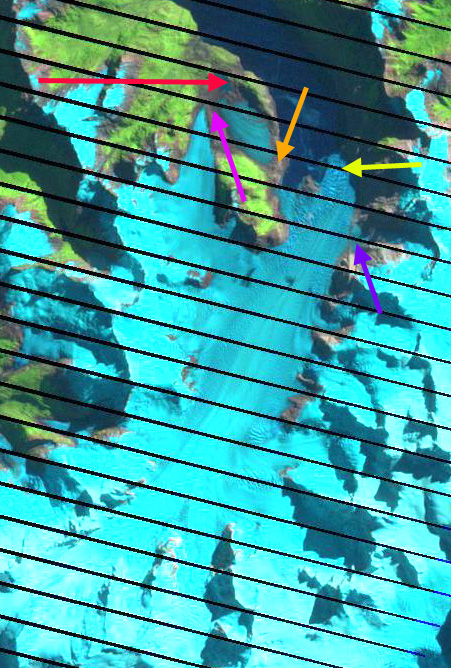
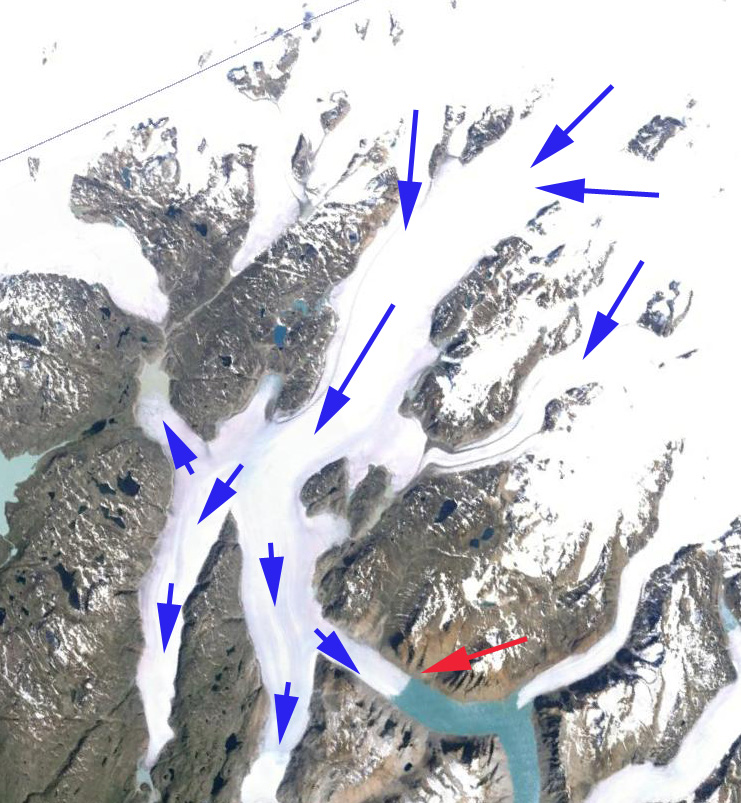
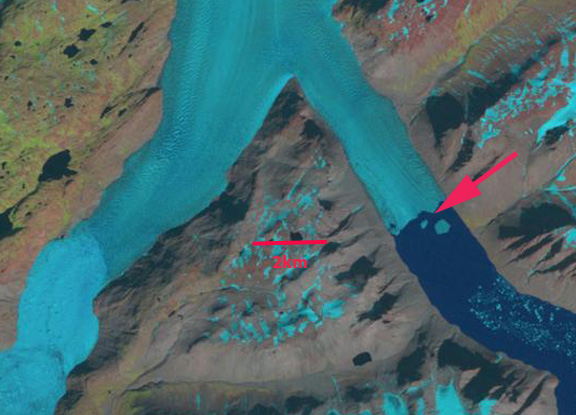
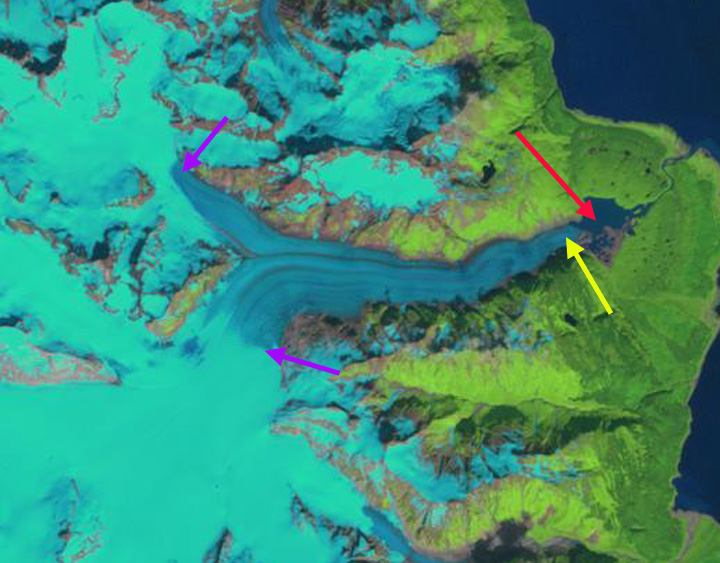
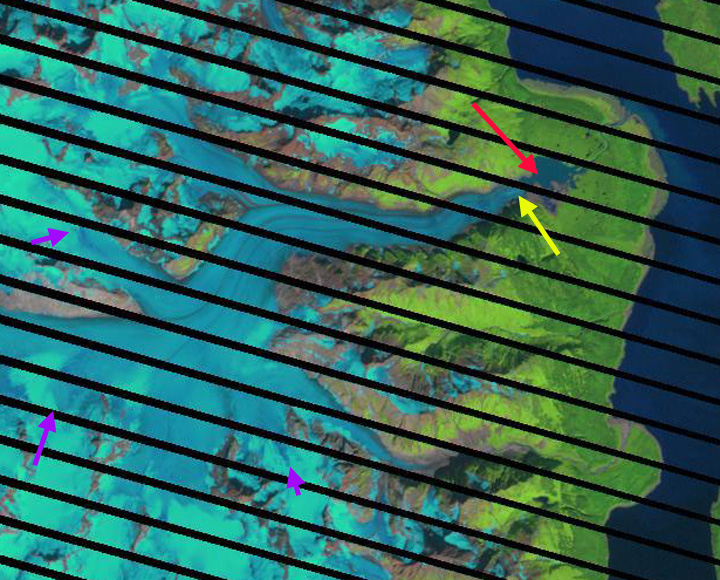
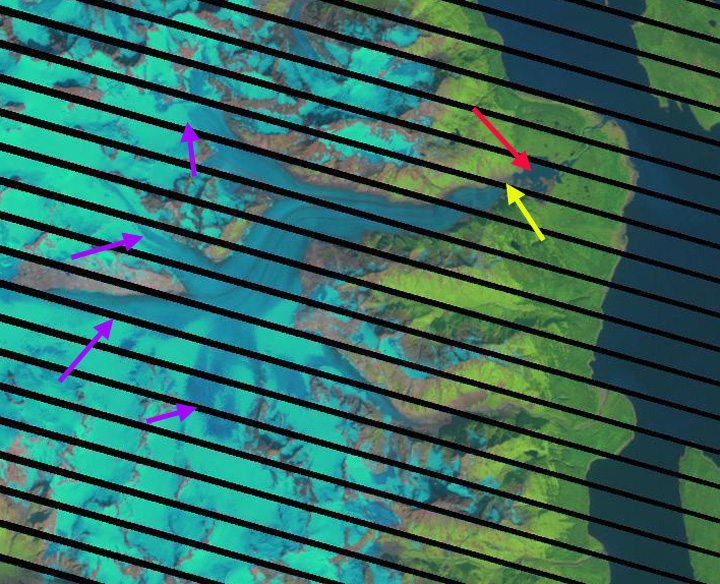
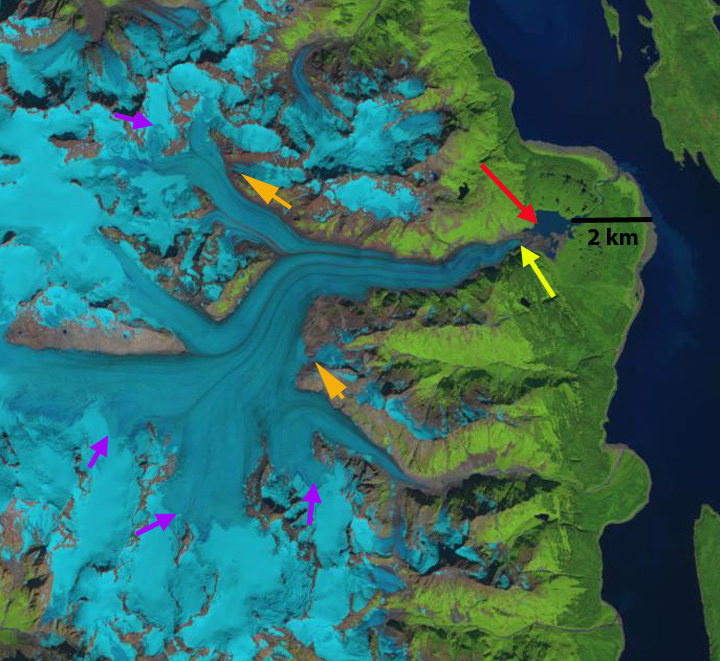
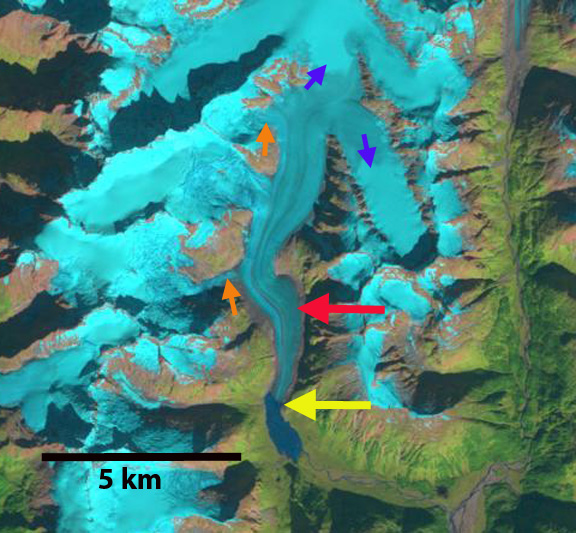
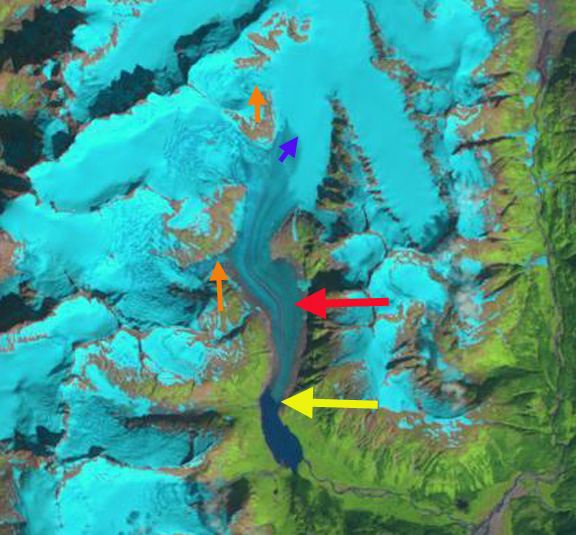
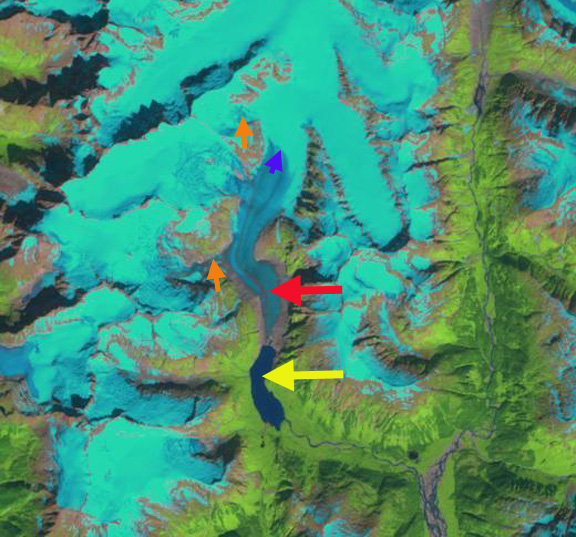
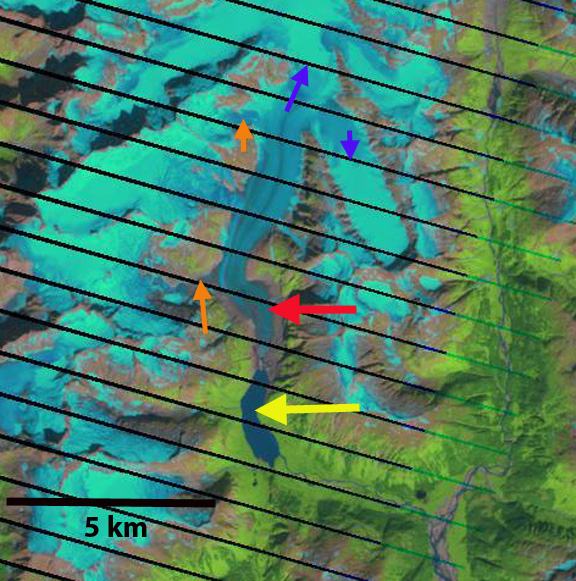
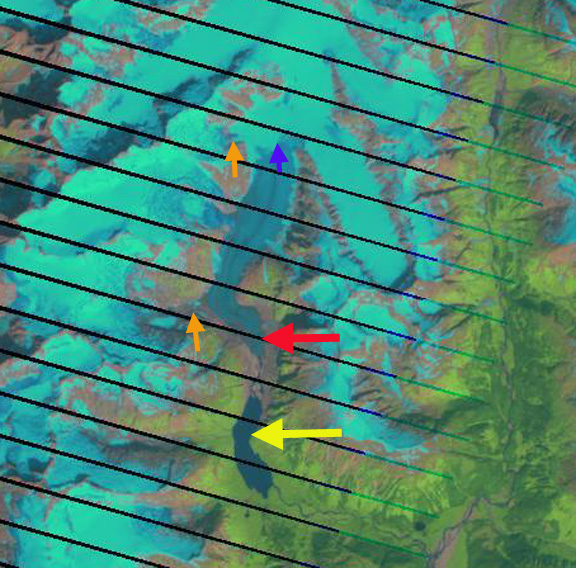
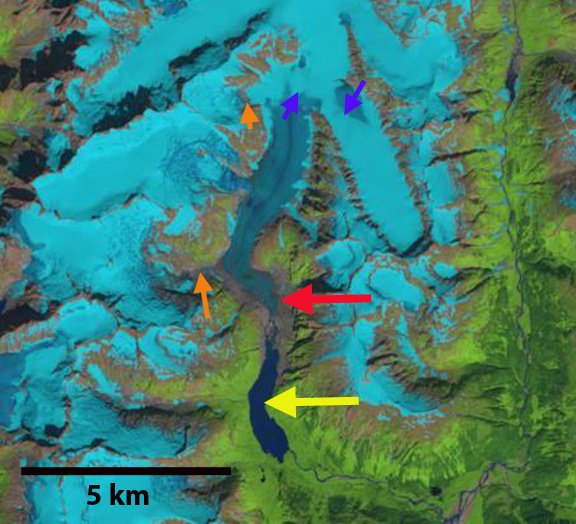
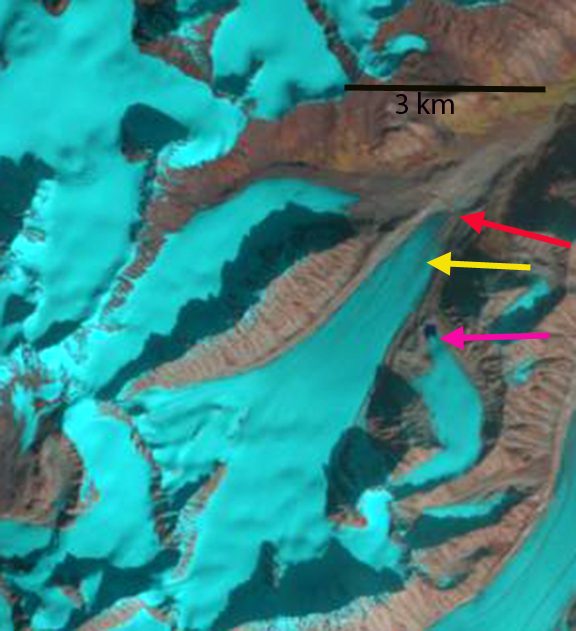
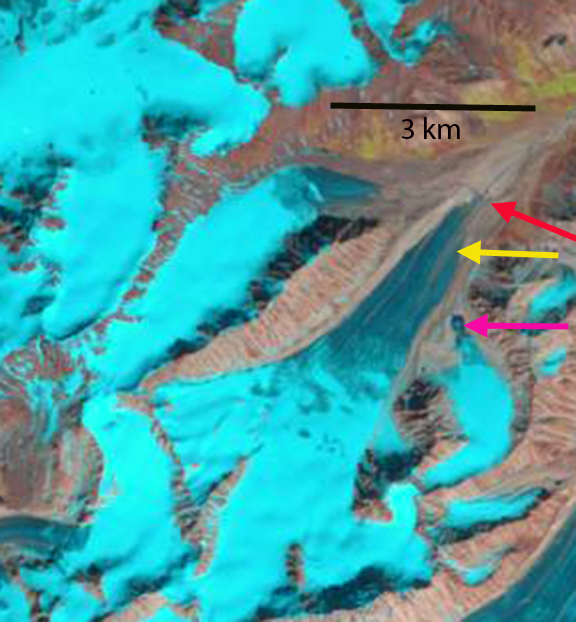
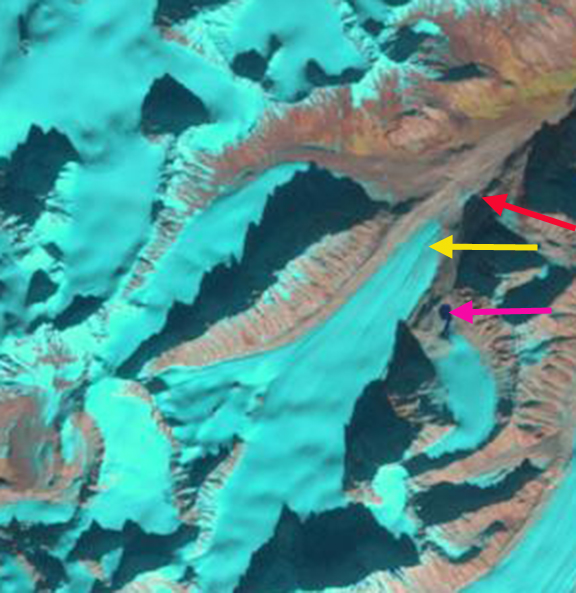
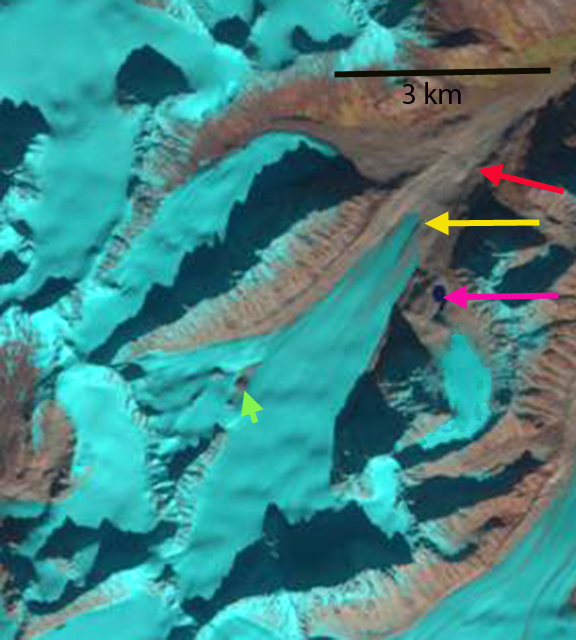
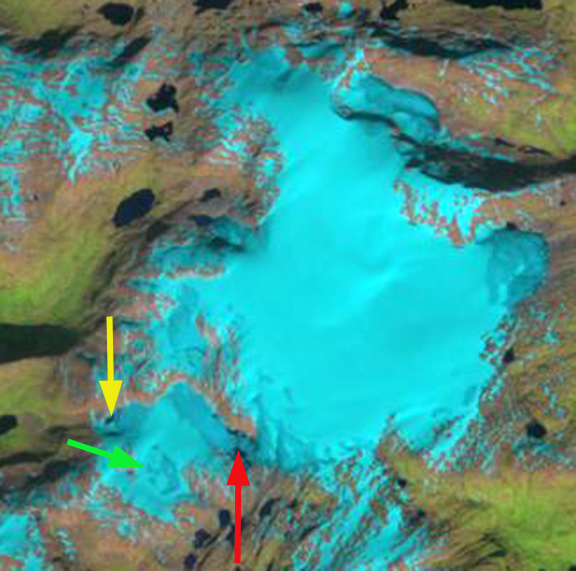
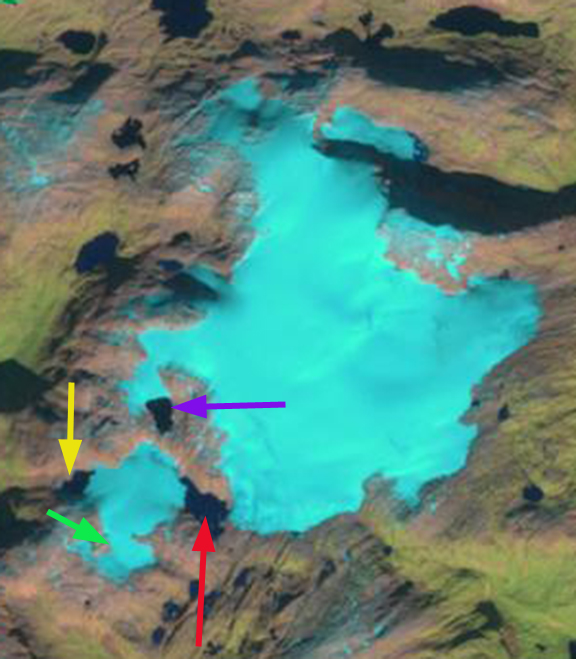
In 1988 at the southwest side of Spørteggbreen the main ice cap joins the southwest extension of the ice cap in a small lake at the red arrow. At the purple and yellow arrow are small peripheral proglacial lakes. The green arrow indicates a narrow section in the southwest extension. In August 1998 there is substantially more snow and lake ice, which makes identification of change difficult. In 2010 the southwest extension is well separated by a lake from the main ice cap, red arrow. This lake is m across, with the glaciers reaching the shore at both ends. The lakes at the purple and yellow arrow have also expanded. The width of the narrow section of the southwest extension has narrowed from 600 m to 300 m. In 2014 the main Spørteggbreen Ice Cap no longer reaches the eastern shore of the lake, red arrow. The lake is 750 m across. The lake at the purple arrow is now equivalent to the glacier that ends in the lake and is m long. The width of the glacier at the narrow section is down to 200 m. The most noteworthy item is that in this mid-September image the ice cap has 25% of its area still covered in snowpack, note the areas marked with pink letter A. The other areas are either firn from previous years or bare glacier ice. By the end of the melt season at the end of the month this will likely be closer to 20% . Remember a glacier typically needs 55-65 % snowcover to be have an equilibrium balance. This will lead to a large negative balance and thinning right to the top of the ice cap. This was the case in 2013 as well. Hence, the Spørteggbreen Ice Cap is currently experiencing significant volume and area losses. The retreat is not as large in terms of distance as on nearby Tunsbergdalsbreen.

1988 Landsat image.
1998 Landsat image
2010 Landsat image

2014 Landsat image