The Wakhan Corridor in Afghanistan is quite remote. A look at maps or Google Earth will indicate the lack of even place names except in the main river valleys. The Secret Compass uses this fact to advantage for expeditions in the region. Here we examine three glaciers north of Sarhad two draining into the Tchap Dara Valley. Haritashiya et al (2009) examined fluctuations of 30 Wakhan Cooridor glaciers from 1976-2003. They found that 28 of the glaciers had retreated.
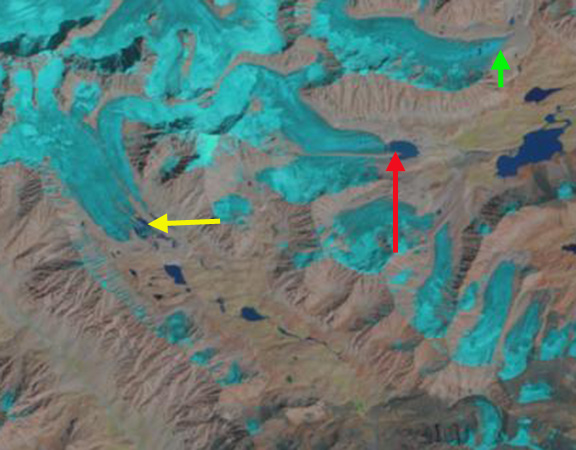
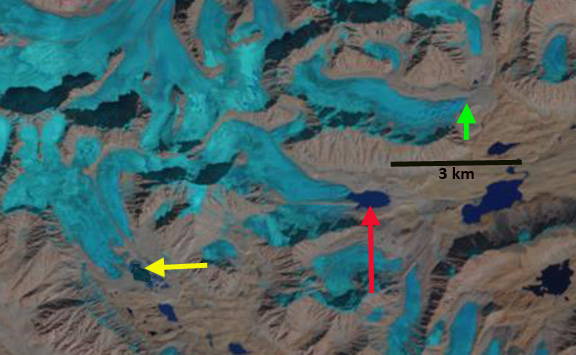
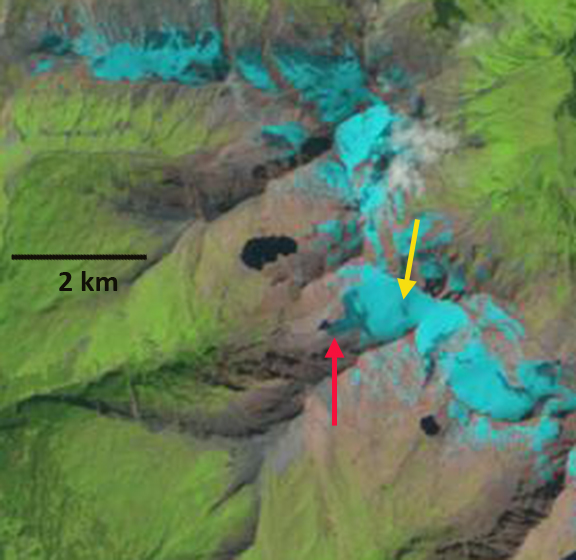
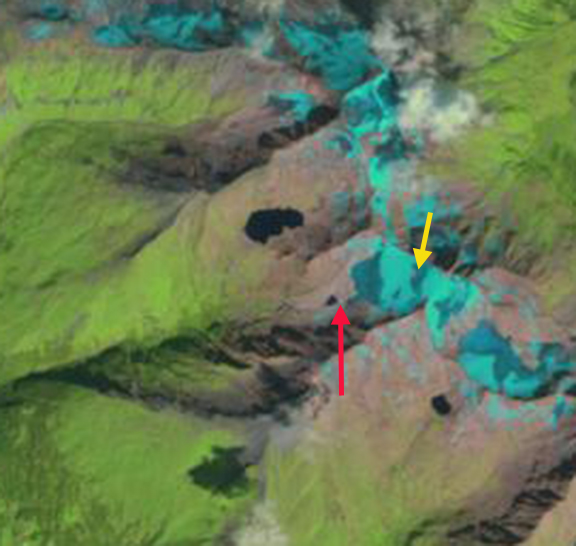
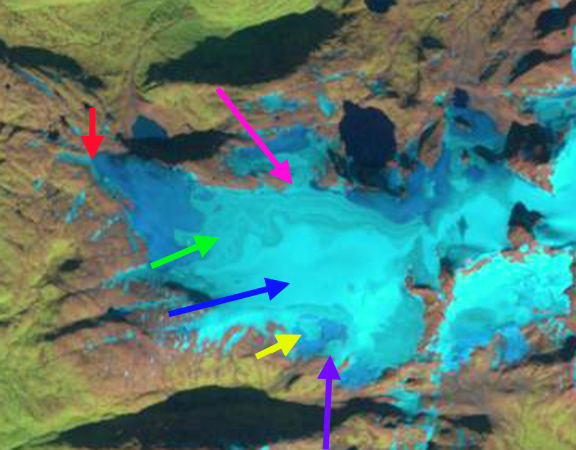
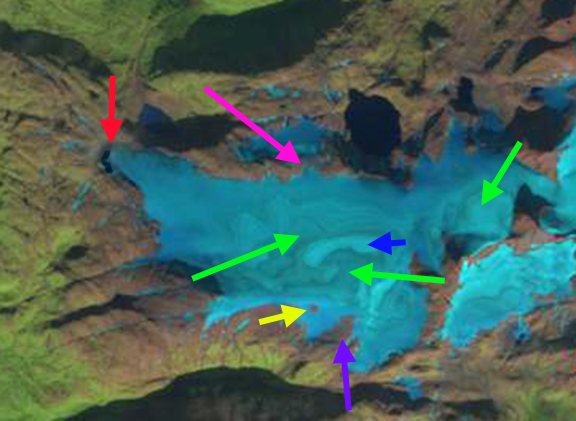
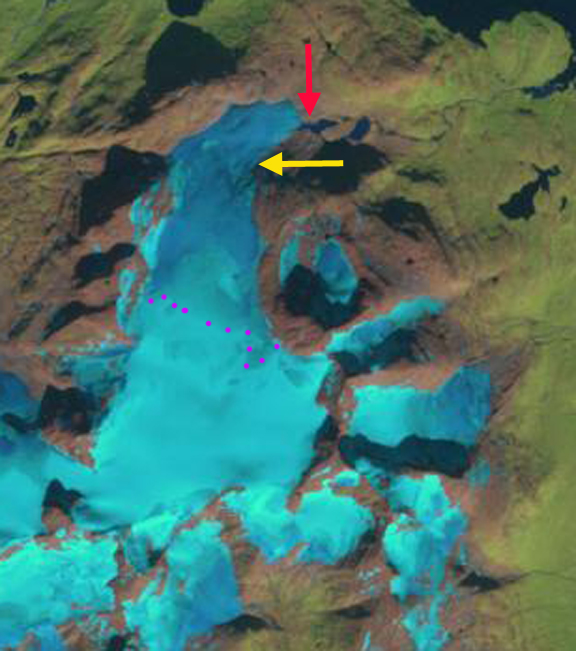
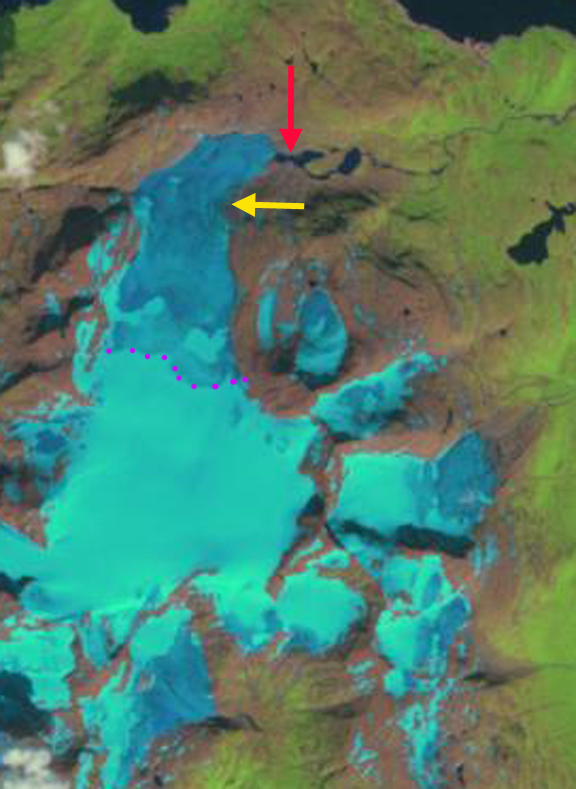
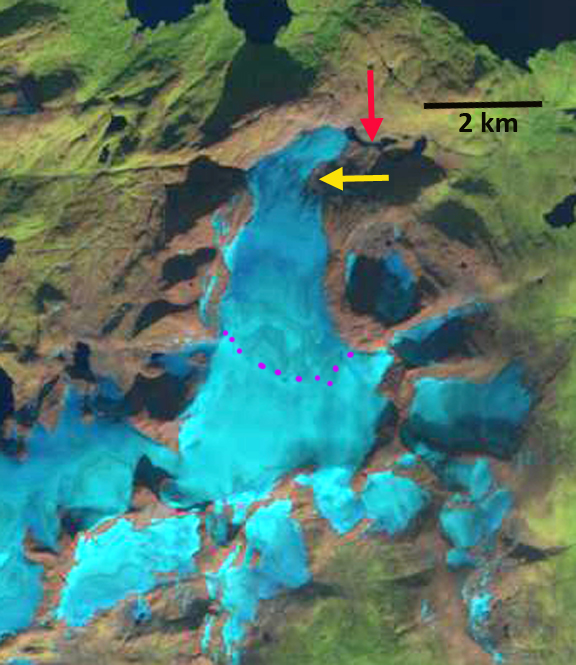
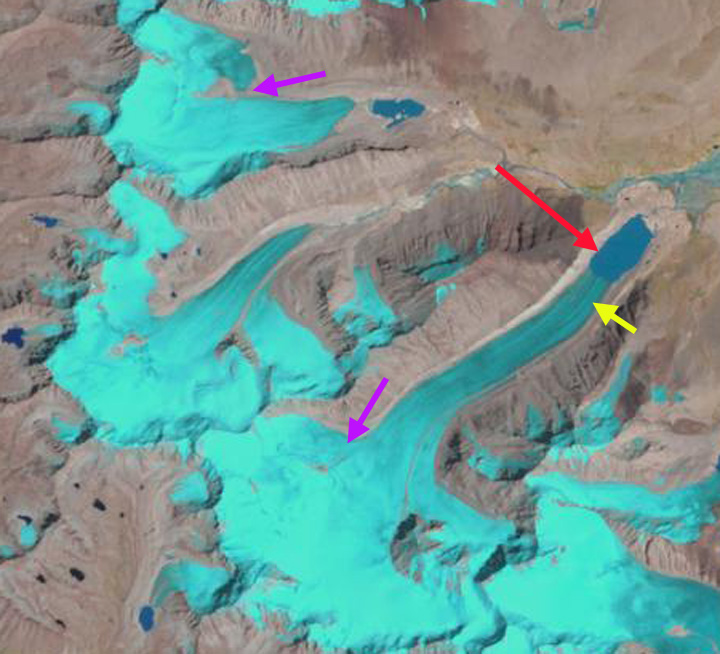
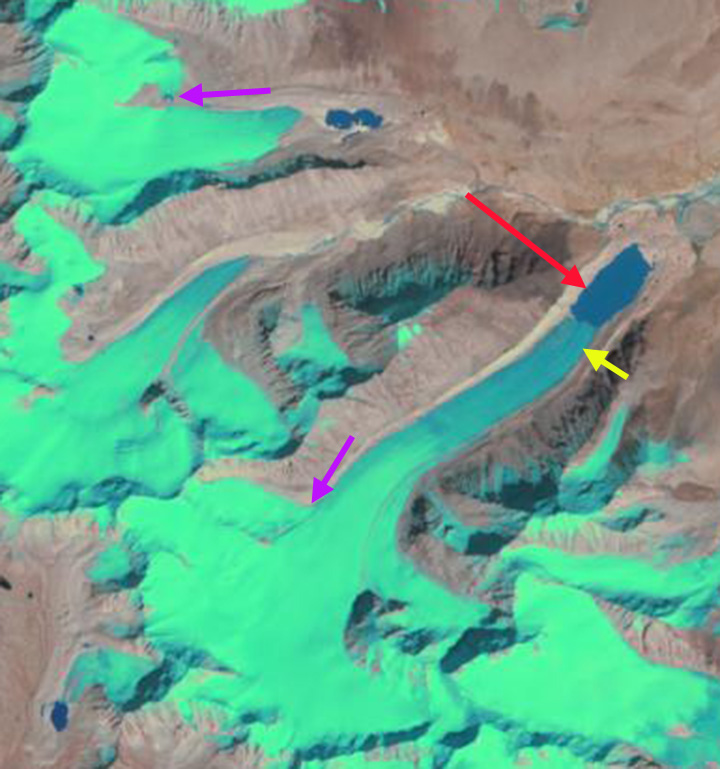
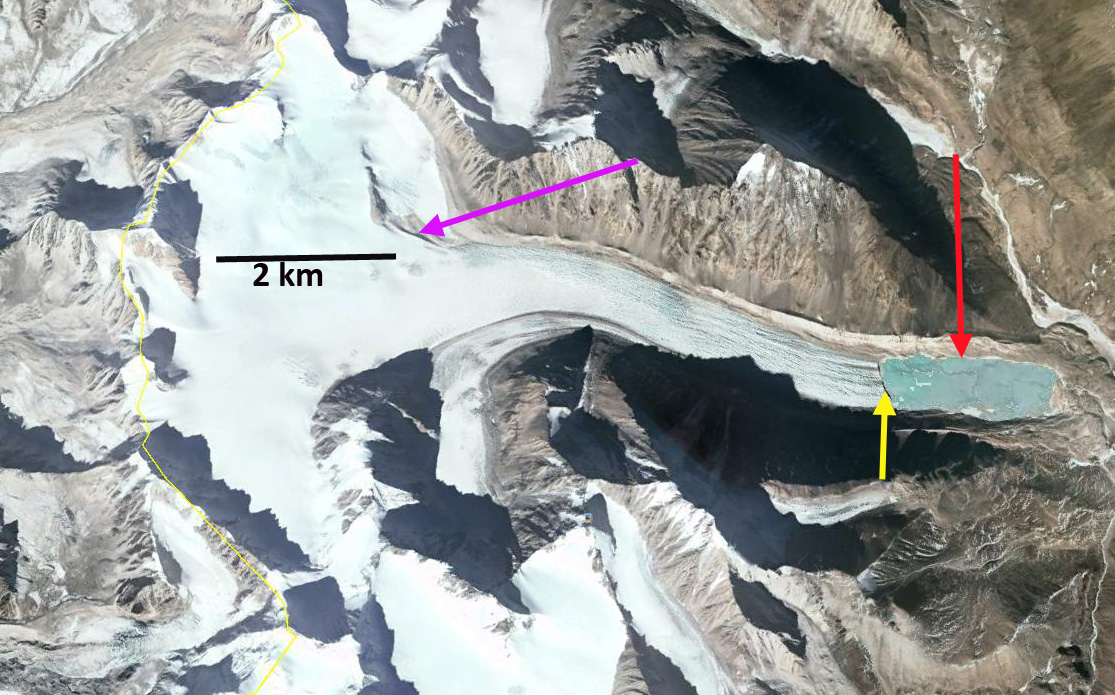
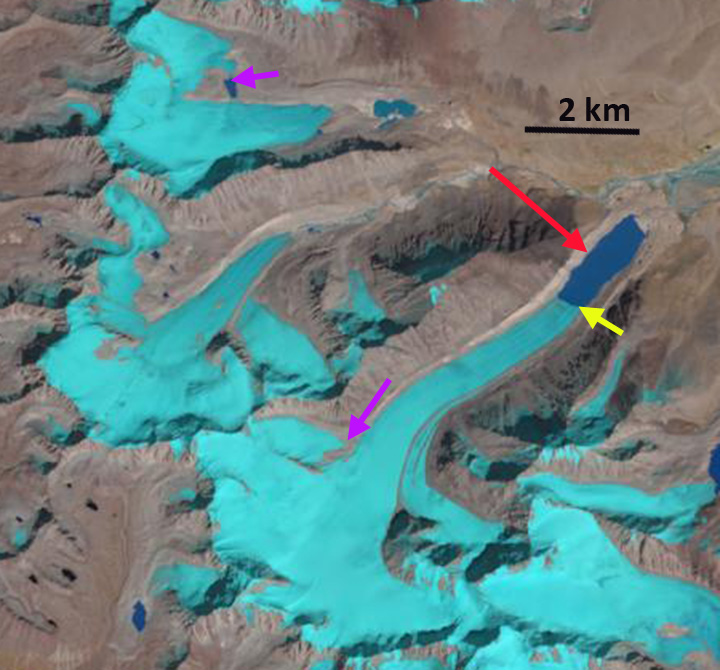
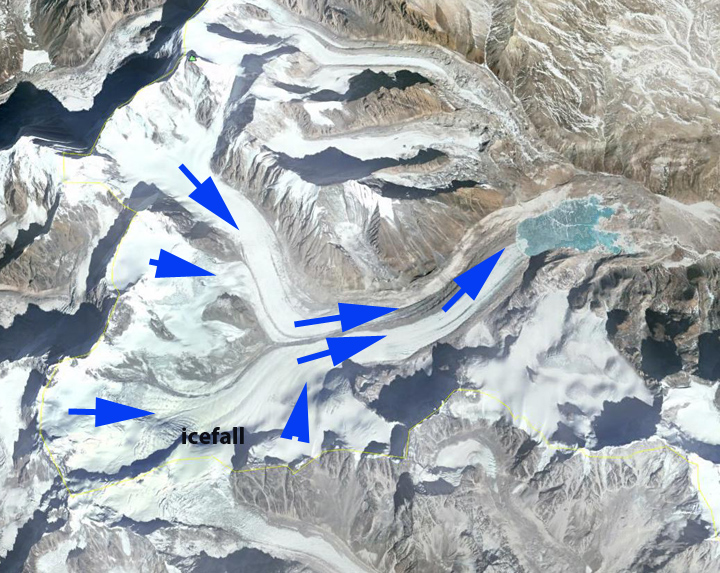
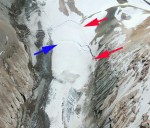
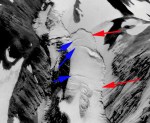
Here we examine Landsat images from 1998, 2002 and 2013 with the green arrows pointing the 2013 terminus position of the northern glacier, the red arrows to the 1998 terminus position of the center glacier and the yellow arrows indicating the 1998 terminus location of the western glacier. The blue arrows indicate ice flow.
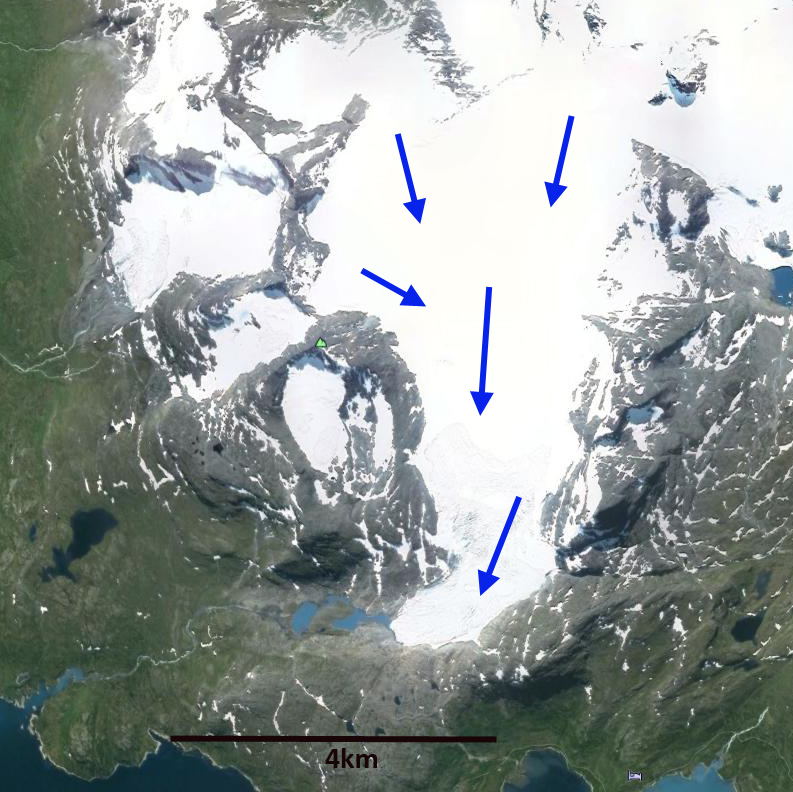
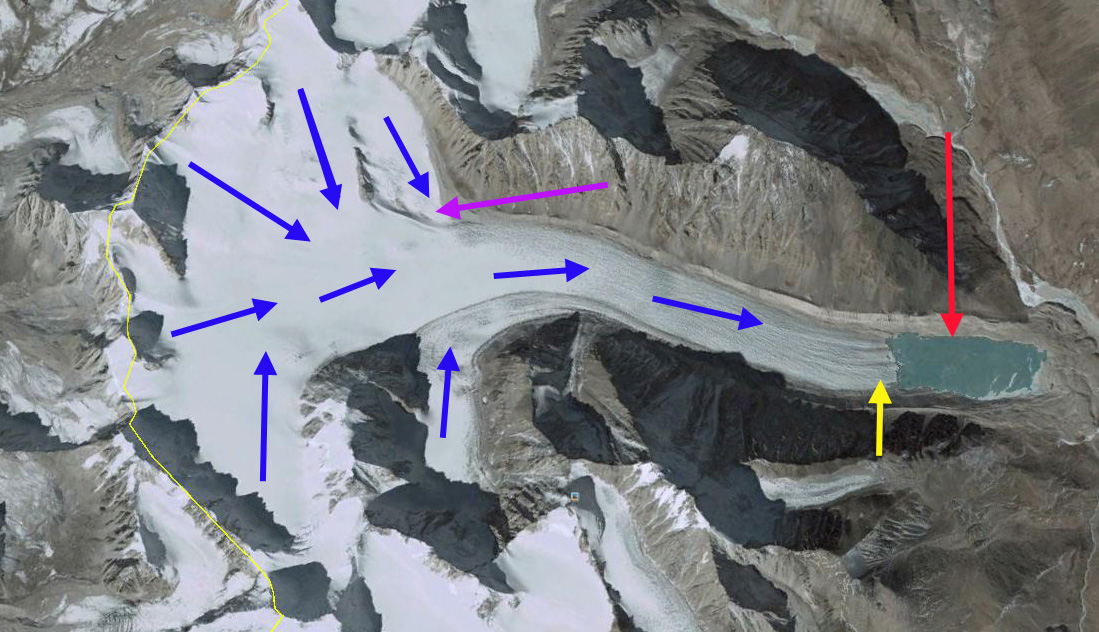
Google Earth image
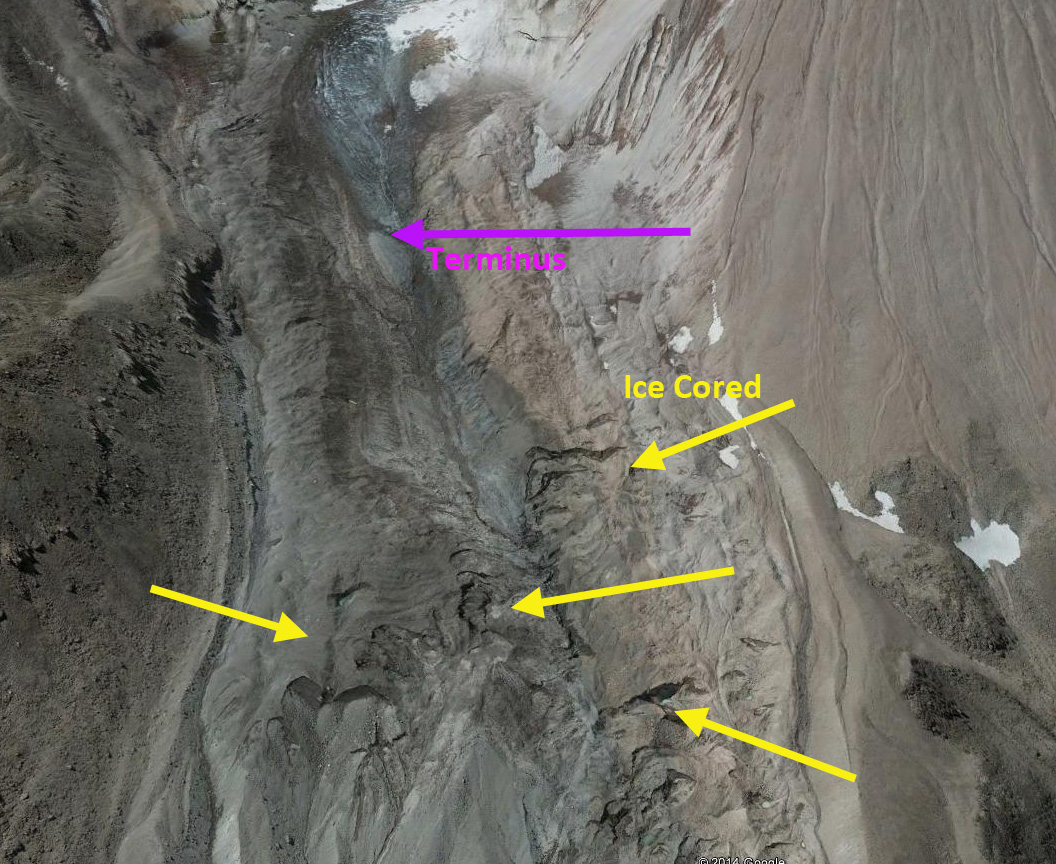
In 1998 the red arrow indicates the terminus of the center glacier, which also has an ice cored medial moraine that extends nearly across the entire proglacial lake that the glacier terminates in. The northern glacier extends beyond the green arrow. The western glacier extends to the yellow arrow filling much of a small basin. In 2002 there is little evident change at the northern glacier. The center glacier has retreated leading to lake expansion, and the medial moraine extending into the lake is also shorter. The western glacier no longer reaches the yellow arrow. By 2013 the northern glacier has retreated 200 meters to the green arrow. The center glacier has retreated 400 m leading to the same amount of lake expansion, the medial moraine no longer extends into the main lake basin. The western glacier no longer reaches a lake that has developed in the basin at the 1998 terminus position. The retreat is 300-400 meters. The retreat over 15 years is substantial for small glacier like this. This parallels the retreat at nearby Zemestan Glacier and the Emend River headwaters glaciers.
1998 Landsat image
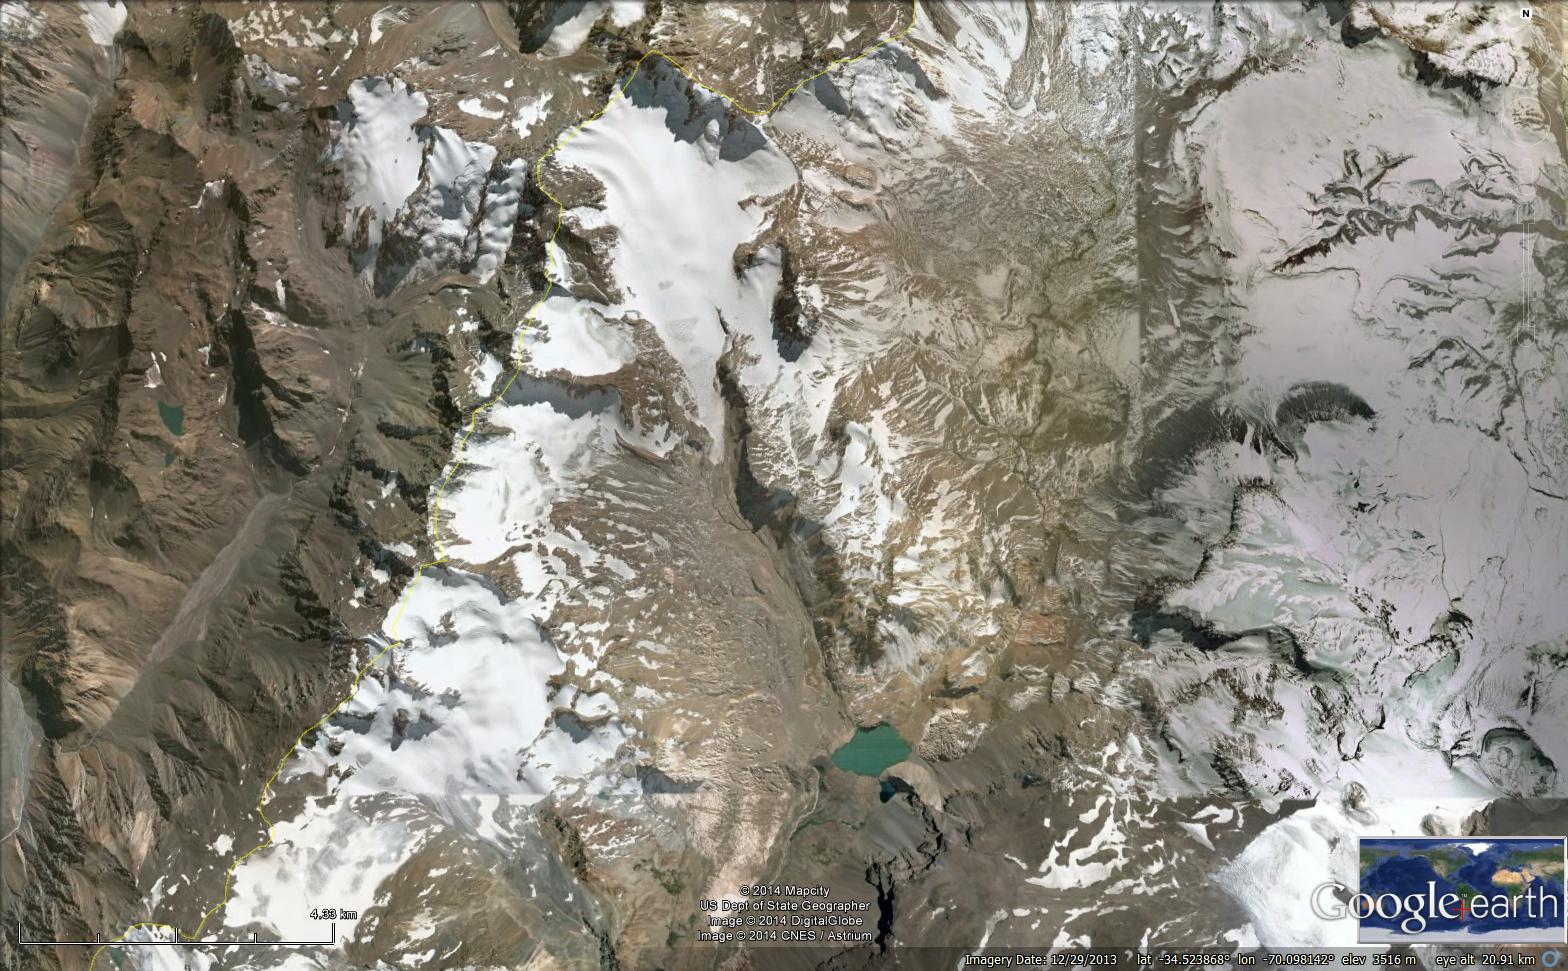
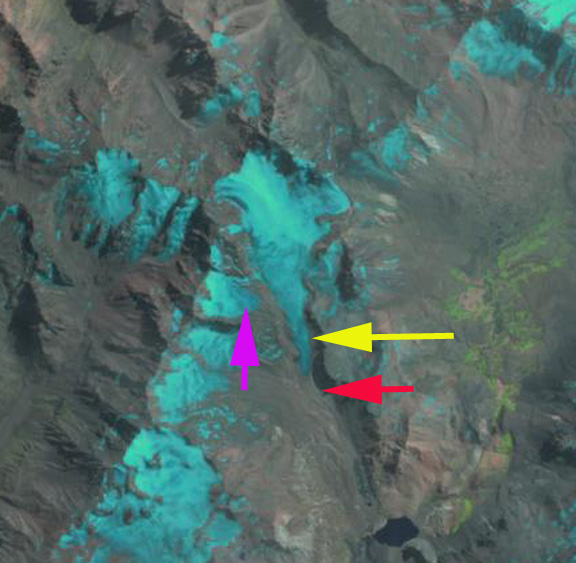
Glaciar del Humo is in the Mendoza Province of Argentina. It drains into Lago Atuel and is one of the headwaters of Rio Atuel. Rio Atuel has hydropower development above and within the Rio Atuel Canon. The Nihuil dam and reservoir above the canyon and four more dams within the canyon, including Valle Grande Reservoir. Le Quesne et al (2009) examined the retreat of glaciers in the Central Andes and reported the retreat of Glaciar del Humo as 3200 m from 1914-1948, 700 m from 1948-1970 and 660 m from 1970-2007. Here we utilize Landsat imagery to observed changes from 1990 to 2014.
Google Earth Image
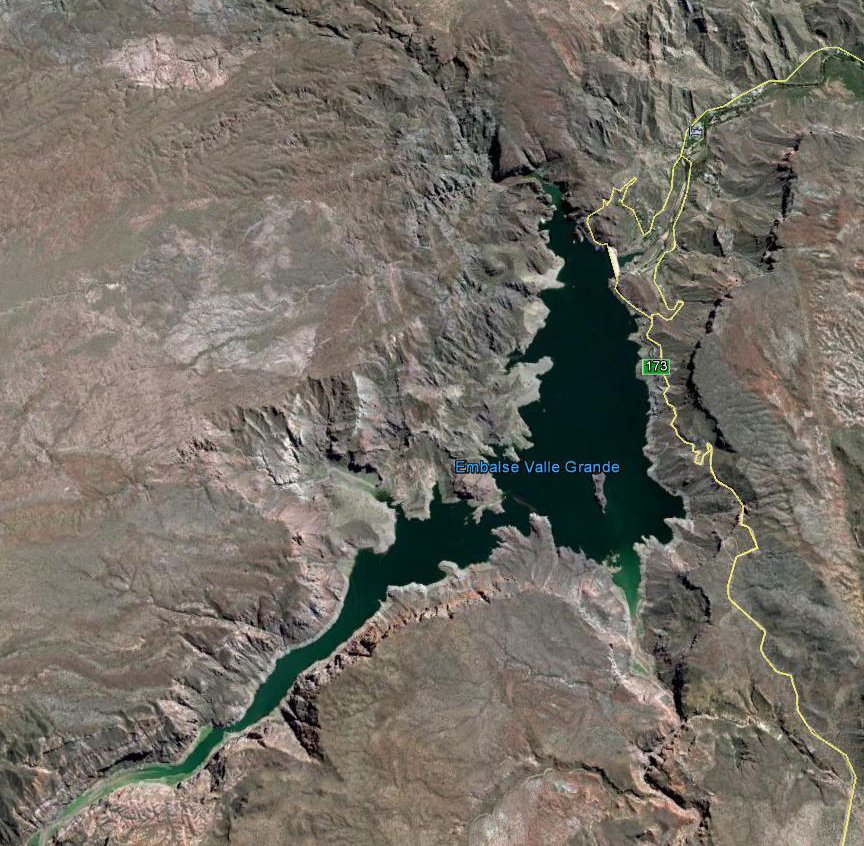
Google Earth Image of Valle Grande Reservoir on Rio Atuel
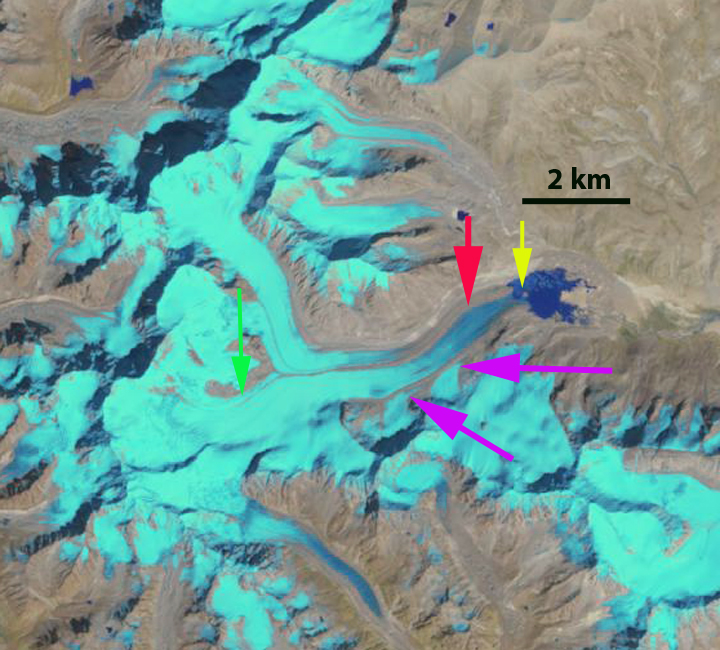
In each image the red arrow marks the 1990 terminus, the yellow arrow the 2014 terminus and the purple arrow a glacier on the west side of Humo. In 1990 the Glaciar del Humo extended down valley ending at the red arrow at 3200 m. The side glacier ended less than 200 m from the main glacier. By 2000 the terminus had retreated 250 m. In 2003 there is little change from 2000. By 2013 the side glacier is separated by 350-400 m from the main glacier. The snowline is in the main accumulation of the glacier. In 2014 the glacier has retreated 900 m from the 1990 terminus position. The terminus is quite thin indicating that retreat will continue. There is also limited retained snowpack on the glacier in 2014, which would lead to mass losses and ongoing retreat. The retreat of this glacier follows that of others in the region, note maps from Glaciares de Argentina
Kleinfleisskees is a small glacier in the Hohe Tauern region in the eastern Austrian Alps. The glacier had an area of 0.87 km2 in 2004 (Binder, 2006). The glacier is located adjacent to the Sonnblick Observatory (3106m), which has both a long term climate record and a webcam.The mass balance of this glacier has been assessed since 1999 (Hynek et al, 2011). From 1999-2012 the glacier has lost 7 m of water equivalent, which is over 8 m of glacier thickness. (WGMS). Unger et al. (2012) produced a map of the changes in this and other nearby glaciers from 1850 to 2009 that was published by WGMS. Here we examine changes in the glacier from 1990 to 2013 using Landsat and Google Earth imagery.
Unger et al (2012) Map of glacier change.
In each image the red arrow indicates the 1990 terminus and the yellow arrow an outcrop of rock that emerges after 1990. In 1990 the glacier extends to a small lake, red arrow. This terminus tongue is 200 meters wide and 300 meters long. At the yellow arrow the annual snowcover has been lost and glacier ice is exposed. In 2001 the terminus tongue has nearly disappeared and the glacier no longer reaches the lake. The yellow arrow again indicates a location where snowcover has been lost and a large area of glacier ice exposed, with the hint of bedrock emerging. By 2013 the glacier terminus tongue is gone, the glacier has retreated 400 m from the 1990 position, with most of the retreat occurring by 2005. An area of bedrock has emerged at the yellow arrow as the glacier ice covering of this location has been lost. Retreat from 2006-2013 was minor according to the WGMS and the Austrian Alpine Club Inventory. In 2012 this survey found 94 glaciers in retreat and 2 stationary out of 96. In 2012 and 2014 glacier mass balances have been quite negative on the glacier, which will fuel more retreat. The glacier lost nearly its entire snowpack in 2014 as seen from the webcam at Sonnblick Observatorium on August 9th. Fortunately several late summer snowstorms prevented high ablation after this date. This glacier does continue to have significant crevassing indicating a good flux towards the terminus in the Google Earth image of 2006. The glaciers retreat is similar to that of Hochalm, Oschentaler and Rotmoosferner.
1990 Landsat image
2001 Landsat image
2013 Landsat image
Sonnblick Observatorium image from 8/9/2014
Google Earth image from 2006.
Hochalm Glacier is Austrian Alps. The glacier drains into the Malta River, which hosts a 40 MW run of river hydropower plant. Fischer et al (2014) note that the Ankogel-Hochalmspitzegruppe glacier area has declined from a Little Ice Age extent of 39.7 square kilometers, 19.2 square kilometers in 1969 to 16.0 square kilometers in 1998 and 12.1 square kilometers in 2012. They note the disintegration and separation of many glaciers in the region. The World Glacier Monitoring Service reported the terminus retreat of 80 m for Hochalm Glacier from 2001-2010.
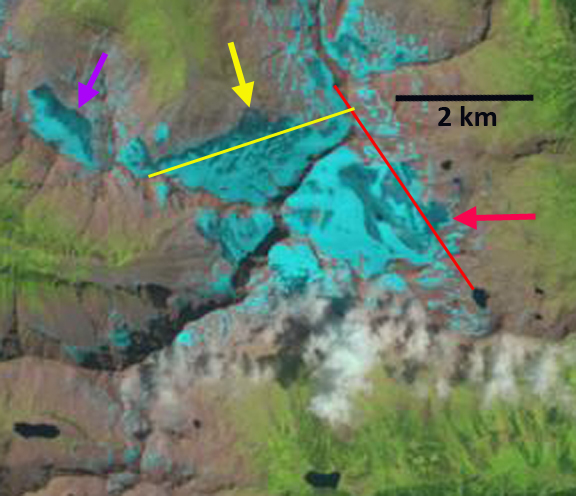
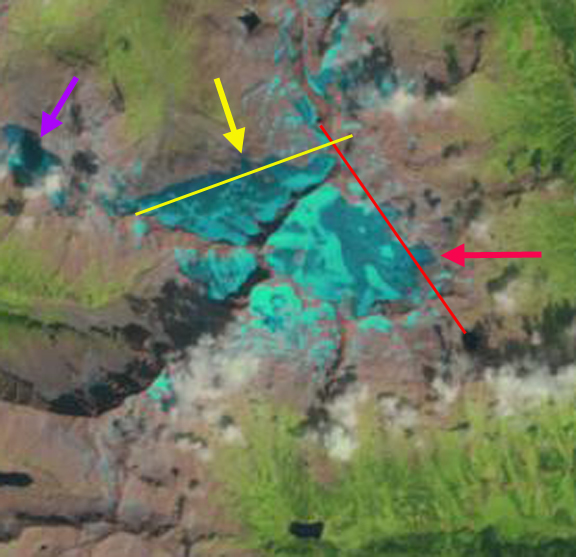
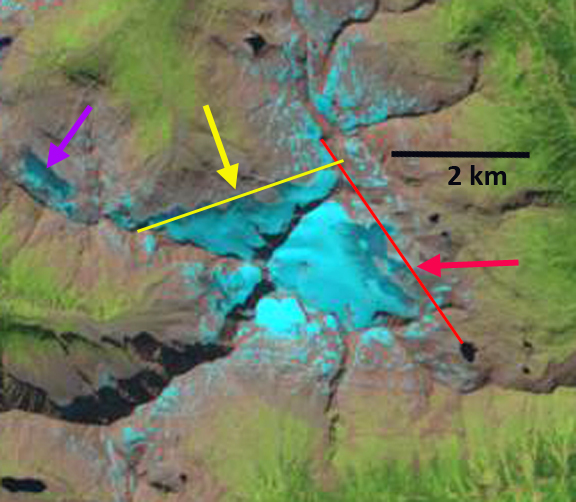
Here we examine the Hochalm Glacier and two neighboring glaciers and their response to climate change from 1990 to 2013 using Landsat imagery. The red line in each Landsat image is in the same location cutting across the Hochalm Glacier. The yellow line is in the same location transecting the Grosselend Glacier. In 1990 Hochalm Glacier has two termini tongues and has a width of 1.1 km extending past the red line. On Grosselend Glacier the terminus area extends beyond the yellow across the entire width of the glacier. The purple arrow indicates a small pocket glacier that has an area of approximately 0.45 square kilometers. In 2000 the Hochalm Glacier has just two narrow termi extending past the red line. The Grosselend Glacier still extends beyond the yellow line. In 2013 the southern terminus of Hochalm Glacier has disintegrated and only the northern terminus reaches the red line. On Grosselend Glacier approximately 40% of the glacier width reaches the yellow line, the main terminus tongue at the yellow arrow has retreated to the yellow line. The area of the glacier at the purple arrow is now 0.23 square kilometers, half of its 1990 extent.
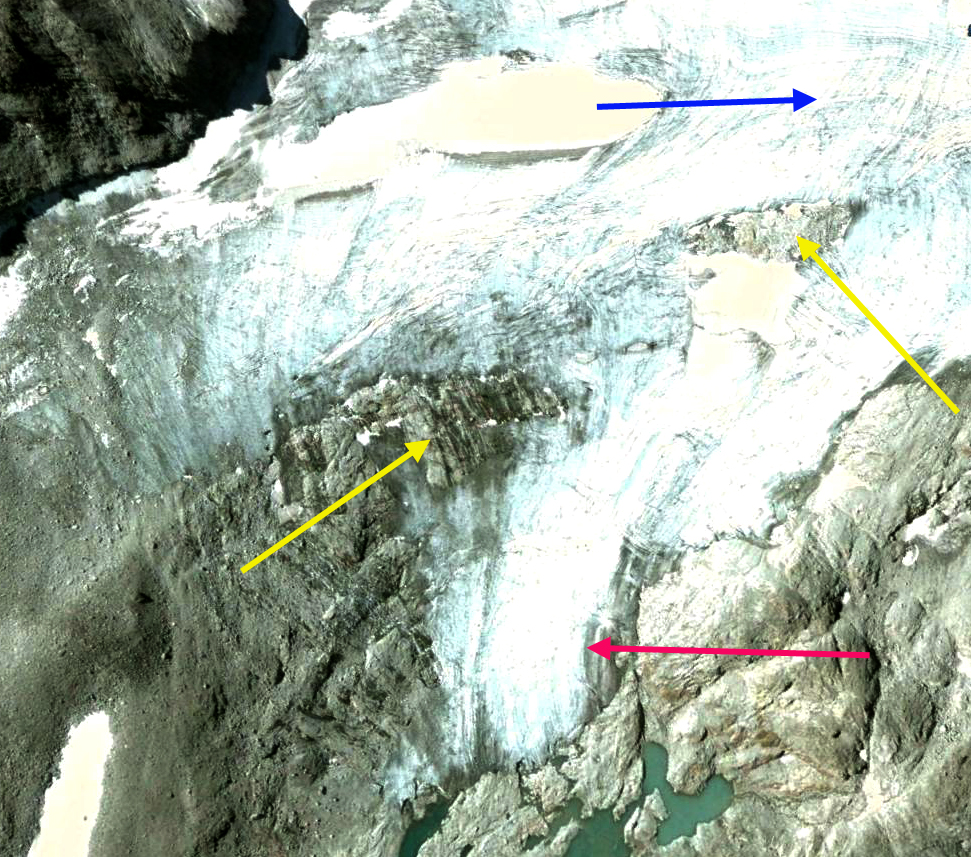
A 2006 Google Earth image of the Hochalm Glacier’s southern terminus indicates how thin it is with no crevassing, red arrow, and several large bedrock areas amidst the glacier, purple arrow. There are numerous annual horizons exposed just below the snowline as well, blue line. The retreat of Hochalm Glacier from 1990-2013 is 200 m for the northern terminus and 450 m for the southern terminus. For Grosselend Glacier the retreat of the main terminus is 450-500 m since 1990. The retreat follows that of Austrian glaciers as a whole as noted by Fisher et al (2014), and Abermann et al (2009). The glacier is thinning even in its upper regions, which indicates it cannot survive (Pelto, 2010). The retreat of Ochsentaler, Sulztalferner and Obersublzbach Glacier indicate a similar story.
1990 Landsat image
Vestisen Glacier is the second largest glacier of the Oksindan Icecap flows west. The glacier drains west into the Rossaga River, which has a Statkraft Hydropower plant, though upstream of the glacier inflow. Here we examine Landsat imagery from 1992-2014 to observe recent changes.
Vestisen Mapcarta view
In 1994 the glacier terminus is at the red arrow. The areal extent of snowcover is more than 50% of the glacier area, blue arrow. A small glacier to the north is connected to the Vestisen at the pink arrow. The purple arrow is a small bedrock ridge that intrudes into the glacier a small distance from the south, and the yellow arrow is a small side terminus of the glacier. In 1999 the snowcovered area is 35% of the glacier. The region of firn, snow that survived the first summer, but is not ice yet, green arrow, is extensive suggesting that the 1999 mass balance was more negative than recent years. In 2006 the ridge at the south edge of the glacier has expanded at the purple arrow. At the pink arrow the connection to the glacier to the north is still comprised of glacier ice. In early september of 2014 the snowcovered area is very low at 15-20% of the glacier. The glacier has separated from the glacier to the north at the pink arrow. A small outcrop of rock has appeared amidst a secondary terminus at the south side of the glacier, yellow arrow. The ridge intruding into the southern edge of the glacier is now 300-400 meters longer and is wider. A lake has formed at the main terminus. This lake has formed due to a combination of thinning and retreat of the terminus, a retreat of 250-300 m has occurred. The Mid-September 2014 image indicates the snowcovered area, blue arrow is down to 5%. The firn area, green arrow, that represents snow that had survived previous summers, is being consumed by the substantial melt of the 2014 season. To have an equilibrium mass balance glaciers in Norway need to be 55-60% snowcovered at the end of the melt season. Glacier mass balance will be quite negative in 2014, which will lead to further retreat of the main terminus and secondary terminus regions, NVE will continue its long term mass balance monitoring that will report on the particular quantities. The retreat here is less than that of Austsre Oksindbreen, just to the northeast, but it is poised for greater retreat in the near future, with poorer retained snowcover. The glacier is following a pattern of thinning and retreat over the last 15 years in Norway. The Norwegian Water Resources and Energy Directorate (NVE) reports that 23 of 24 Norway glaciers examined consistently since 2000 have retreated significantly.
1994 Landsat image
1999 Landsat image
2006 Landsat image
2014 early September Landsat image
2014 Late September Landsat image
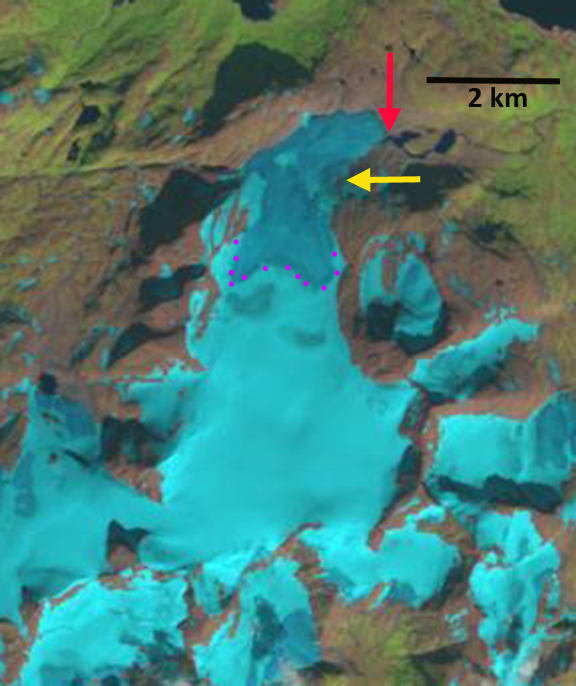
Austre Okstindbreen is the largest glacier of the Okstindan Icecap. It flows north from the 1700 m to a terminus in a proglacial lake at 900 m. The lake drains into Grasvatnet. The glacier had a sustained retreat of 2 km from 1908-1980, emplacing annual moraine ridges during the 1950-1968 period (Worsley and Ward, 1974). The other main glacier of the Oksindan Icecap is Vestisen. Knudsen and Theakstone (1988) identified a series of glacier dammed lake draining events from 1976-1987, with glacier retreat this is no longer occurring. Jacobsen et al (1997) noted that the lower glacier in particular had slowed down from 1976 to 1995. They also reported during a series of positive balance years the ELA averaged 1250 m. The Norwegian Water Resources and Energy Directorate (NVE) reports annual terminus of this glacier, noting a 118 m retreat from 2010-2013. Here we examine changes in the glacier from 1994-2014 using Landsat imagery.
Google Earth Image
In 1994 the glacier terminates at the red arrow, the snowline (purple dots) is at 1300 m. The width of the glacier at the eastward turn, yellow arrow is 1500 m. In 1999 the glacier has retreated a short distance and the snowline is at 1400 m. In 2006 the proglacial lake has continued to expand. The glacier width at the east turn is 1300 m. The snowline is at 1450 m. In 2014 the snowline is at 1550 m. The glacier width at the yellow arrow is down to 1100 m. The retreat from the red arrow is 400 m, which is 20 meters/year. The persistent high snowline above 1300 m in images that are not even at the end of the melt season indicate a significant rise. The 400 m reduction in the width of the glacier at the east turn, which is 1.5 km above the terminus, indicate the retreat will continue. The glacier retreat parallels that of Norway glaciers in general since 2000, with 23 of 24 glaciers examined consistently by (NVE) retreating during this interval, one was close to equilibrium. Engabreen, Tunsbergdalsbreen and Blamannsisen.
1994 Landsat image
1999 Landsat image
2006 Landsat image
2014 Early September Landsat image
2014 Mid-September Landsat image
Ribuktse Glacier drains east from 6200 m peaks along the Nepal-China border. The glacier ends in a lake that drains into Ribuktse Tso, the Yarlung Tsangpo (Zangbo), which becomes the Brahmaputra River. The Zangmu hydropower project is being constructed on the river, it is a 510 MW project. Here we examine Landsat and Google Earth imagery from the 1991-2014 period. This is a region where Li et al (2011) noted that increasing temperature, especially at altitude, the fronts of 32 glaciers have retreated, mass losses of 10 glaciers have been considerable, glacial lakes in six regions have expanded and melt water discharge of four basins has also increased. Neckel et al (2014) examined changes in surface elevation of the glaciers and found this region lost 0.44 m/year from 2003 to 2009.
Google Earth image
In 1991 the glacier ends in a proglacial lake at the red arrow, the yellow arrow is the 201 terminus. The lake at an elevation of 5050 m is 1.1 km long and 600 m wide. The purple arrow indicates two tributaries that connect to the larger valley glaciers. By 1998 the lake has expanded. The tributary to the glacier to the north of Ribuktse has separated from the main glacier. In 2000 and 2001 the tributary to the Ribuktse Glacier is still connected to the main glacier. The terminus continues to retreat with lake expansion. By 2005 the lake is 1.8 km long and the tributary is no longer visibly in contact with the main glacier at the purple arrow. In 2014 the terminus has retreated 800 m since 1991, the lake is 1.9 to 2 km long and the tributary has significantly separated form the main glacier. At the glacier just to the north the tributary separation from the valley glacier has led to a new glacier lake developing by 2011. There is little evidence of calving from Ribuktse Glacier. The retreat of the low slope glacier tongue in the proglacial lake lacking calving will continue at a slow rate. The high elevation of the glacier terminus area limits the magnitude of ablation on the glacier tongue. The retreat follows the pattern of the Yemayndrung Glacier just to the south, Durung Drung Glacier, India, Reqiang Glacier, China and Matsang Tsanpo Glacier, China which are in a similar climate setting. This area did get an unusual heavy October snowfall from Cyclone Hudhud this week.
The Yemayundrung Glacier flows northeast from the Nepal-China border to end in lake at the headwaters of the Khugpi Chu River. This river is one of the source rivers of the Yarlung Tsangpo (Zangbo) in China which becomes the Brahmaputra in India. This is a region where Li et al (2011) noted that increasing temperature, especially at altitude, the fronts of 32 glaciers have retreated, mass losses of 10 glaciers have been considerable, glacial lakes in six regions have expanded and melt water discharge of four basins has also increased. This is further documented by an inventory of 308 glaciers in the Nam Co Basin, Tibet, where an increased loss of area for the 2001-2009 period, 6% area loss (Bolch et al., 2010) was observed. Here we examine Landsat imagery of changes in this glacier from 1998 to 2014.
In each image the yellow arrow indicates the 1998 terminus and the red arrow the 2014 terminus. The purple arrows indicate a pair of tributary glaciers from the south and the green arrow a tributary after it has joined the main glacier separated by a lateral moraine. In 1998 the glacier terminates at the yellow arrow and the maximum length of the proglacial lake at the terminus is 1 km. The two tributaries from the south join the main glacier. The tributary at the green arrow has a blue ice tongue that extends down glacier to the main glacier junction. In 2000 the terminus has retreated a short distance, but there is little change in the tributaries. By 2013 the lake has lengthened to 1.8 km with glacier retreat. In 2014 the two southern tributaries at the purples arrows no longer connect to the main glacier. The tributary at the green arrow no longer has blue glacier ice extending past the arrow to the main glacier junction. The glacier has retreated 750 m from 1998-2014. The thinning of several tributaries is indicative of less volume flux toward the terminus, which will lead to continued retreat of this glacier and lake expansion. The retreat is similar to that of Durung Drung Glacier, India, Reqiang Glacier, China and Matsang Tsanpo Glacier, China and Ribuktse Glacier, China, which are in a similar climate setting. This area did get an unusual heavy October snowfall from Cyclone Hudhud this week.
Ferebee Glacier is in the Coast Range of Alaska 15 km northeast of Skagway. The Ferebee River that drains the glacier flows into the Chilkoot Inlet. The glacier begins at 1800 m in the Klukwah Mountains and flowed south and terminated on an outwash plain at 200 m in the USGS map of the region from 1955. Little change in the terminus occurred prior to 1981. I observed the glacier from the air in 1981 and there was no lake at the terminus and only a minor several hundred meter wide devegatated zone from recent retreat. Here we examine Landsat imagery from 1986-2014 to identify recent change. A landslide occurred onto Ferebee Glacier in 2014, that will add debris cover to the surface that is limited today.
Google Earth image
USGS map of area
In each image the red arrow marks the 1986 terminus, the yellow arrow the 2014 terminus and the purple dots the snowline. In 1986 the glacier still terminated on the outwash plain at the south end of what is a newly forming lake small pockets of open water are evident on the lateral margins. The snowline is at the base of the lower icefall at 900 m. By 1999 a lake has formed at the terminus, that is 1.2 km long, a retreat of nearly 100 meters per year. The snowline is at 1000 m in 1999. A 2004 Google Earth image of the terminus area indicates two regions of concentric crevassing upglacier of the terminus, one adjacent to the yellow arrow, this indicates ice that has been lifted and then dropped by water, which only happens if the ice is thin enough for flotation. By 2013 the lake has more than doubled in length and the snowline is near the top of a pair of icefalls at 1300 m. In 2014 the lake is 2.7 km long on the eastern shore and 2.5 km long on the western shore. The glacier has retreated 2.6 km in 28 years, still nearly 100 m/year. The lake is not becoming narrower and there is no elevation step on the glacier, to suggest the end of the developing lake is near. The snowline in 2014 even in early August is at 1400 m. This glacier will continue to retreat as long as the snowline is above the top of the icefalls at 1250 m. The retreat of this glacier is like the Meade Glacier across Chilkoot Inlet, LeBlondeau Glacier just to the west and Gilkey Glacier to the south.
1986 Landsat image
Meade Glacier drains the northwest portion of the Juneau Icefield, with meltwater entering the Katzehin River and then Chilkoot Inlet. The glacier begins in British Columbia and ends in Alaska. Here we use Landsat imagery to examine changes in the glacier from 1984 to 2014. The glacier experienced a slow continuous retreat from 1948 to 1986 of 400 m, the glacier ended on an outwash plain. From 1991-2006 JAXA’s EROC program noted a retreat of 570 m, retreating into a lake basin. In 2007 the lower 2.5 km of the glacier was stagnant and heavily crevasses, poised for collapse in a developing proglacial lake. The 1948 map of the glacier indicates no proglacial lake with the glacier terminating on an outwash plain.
USGS Topographic map from 1948 aerial photographs
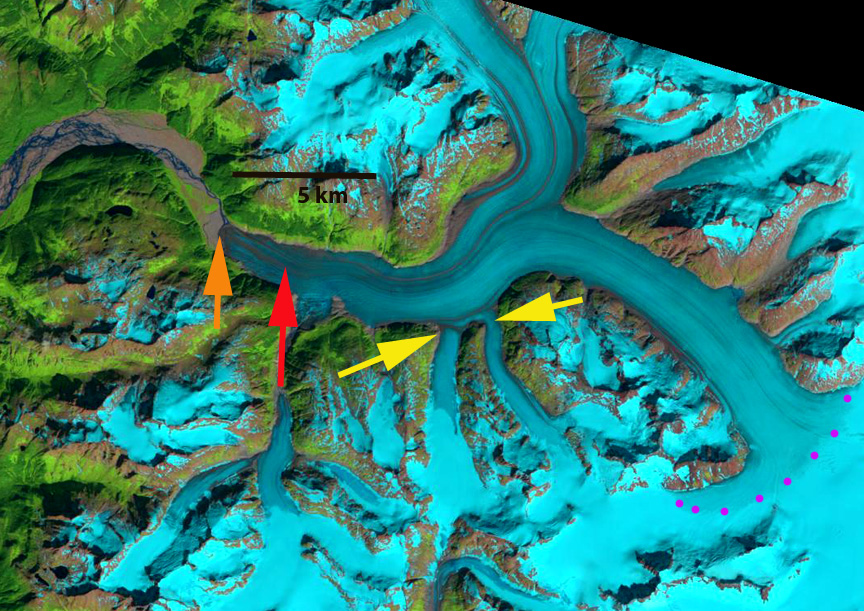
In 1986 the terminus is indicated by an orange arrow, the 2014 terminus by a red arrow, two tributaries that connect to the Meade Glacier are indicated by yellow arrows and the snowline at is indicated by purple dots. The snowline is at 1250 m in 1986, there is no evident lake at the terminus of glacier just an expanding outwash plain. Both tributaries are 750 m+ wide where they join Meade Glacier. By 2004 a 400 m long proglacial lake has formed at the terminus. The two tributaries from the south at the yellow arrows no longer are connected to the glacier. The snowline is at 1450-1500 m, which is much higher than in 2004 on Taku Glacier or Brady Glacier. In 2009 the snowline is at 1400 m, the proglacial lake has expanded to 600 m in length. In 2014 the proglacial lake is 3.5 km long, the entire lower 2.5 km of the glacier has collapsed since 2007. There is still considerable relict ice floating in the lake. There is a substantial lake along the southern margin of the glacier where a tributary streams enters the main valley. This indicates the glacier will quickly retreat to this point by further collapse into the lake. The snowline in 2013 and 2014 was quite high and the summer’s quite warm which aided in the lake expansion. The snowline in 2014 is at 1400 m on Aug. 2, the date of the imagery, the high snowlines ensure continued mass loss and glacier retreat. There was still six week of summer melting remaining on the date of the imagery. The Meade Glacier is poised to continue a rapid retreat in the near future its retreat parallels that of most Juneau Icefield glaciers including the next glaciers to the south Field Glacier and Gilkey Glacier.
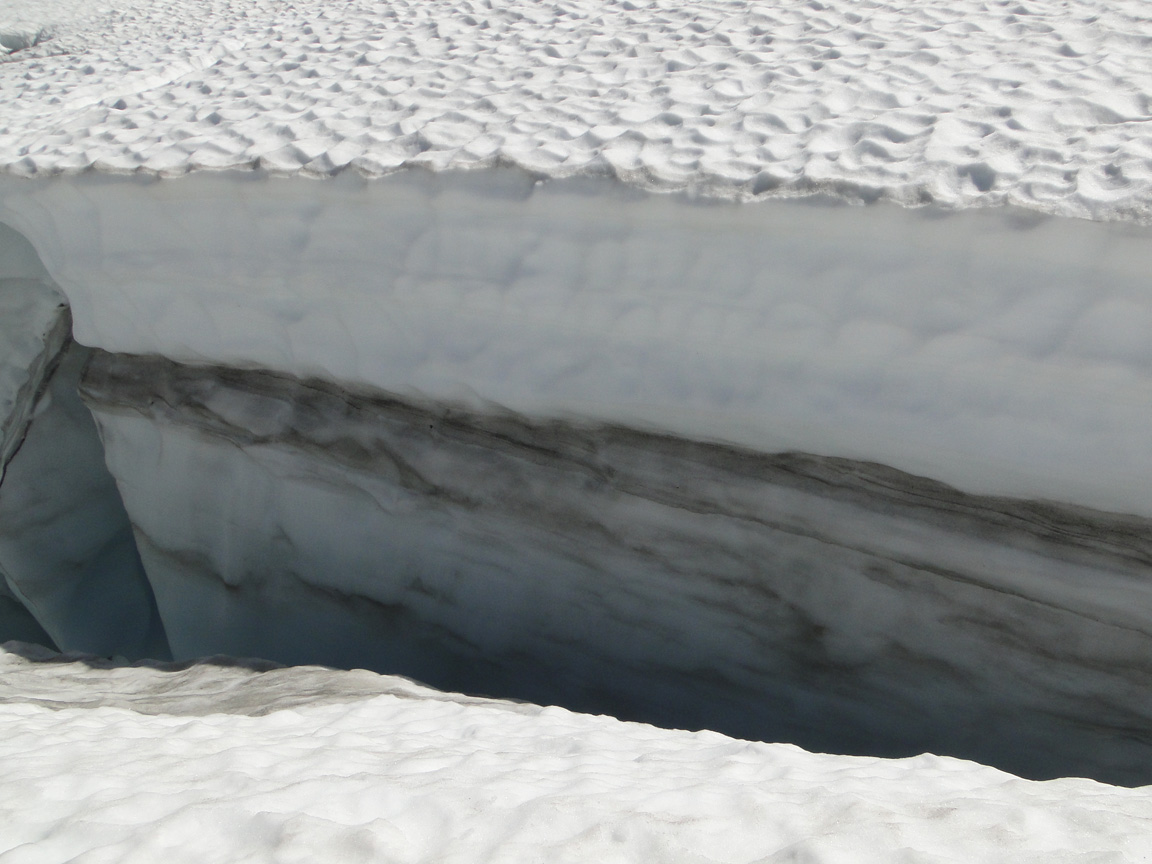
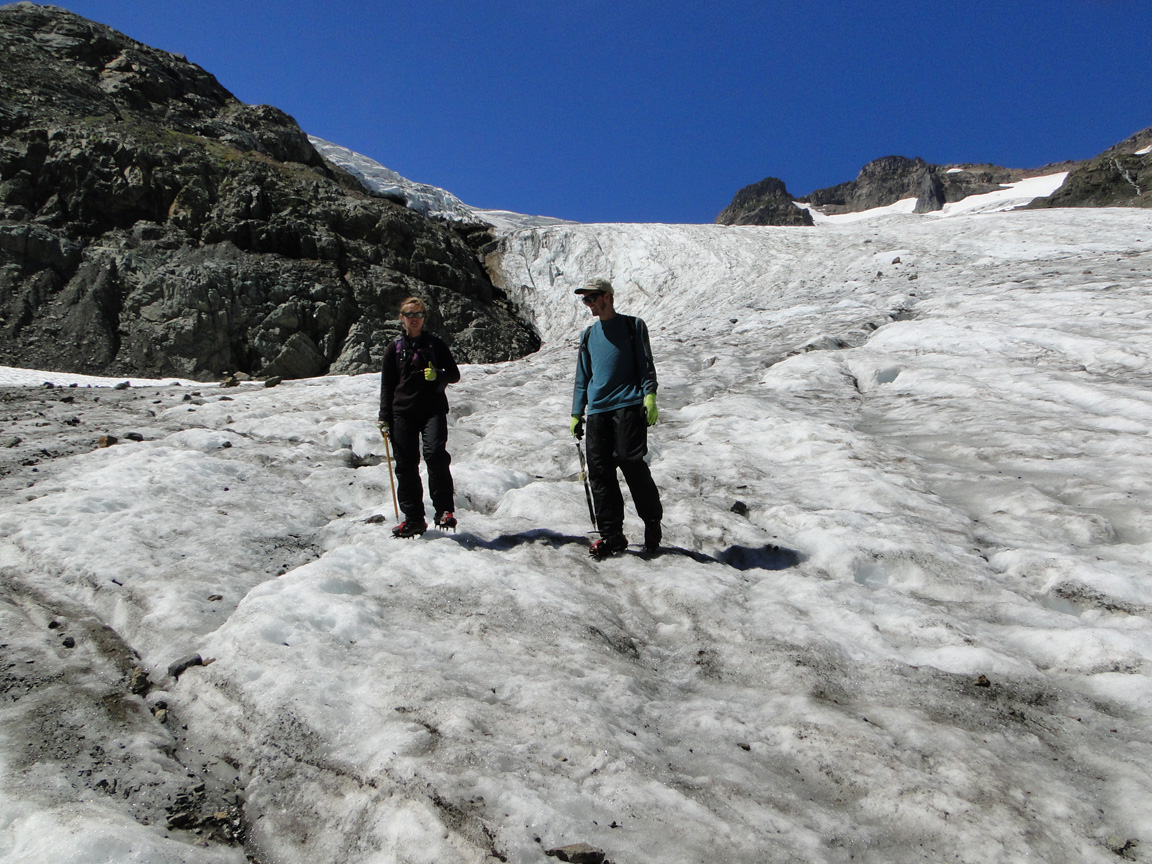
From 1984-2014 we have monitored the mass balance of the Rainbow Glacier on Mount Baker, North Cascade Range, Washington. This entails detailed monitoring of snowpack depth in July and August, and subsequent ablation to the end of the melt season. On July 13th the glacier was completely snowcovered. By August 10th the snowline had risen to 1575 m, with 1.4 m of ablation since July 13th. We measured the snowdepth at 85 locations on the glacier, with only 6 measurements exceeding 3.5 m on Aug. 10th.Ben Pelto and Ashley Edwards examining crevasse stratigraphy both the 2013 and 2014 layers evident.
Limited snowpack below the main icefall at 1750 m on Aug. 10.
Limited snowpack below the main icefall at 1750 m on Aug. 10.By September 27th the snowline had risen to 1975 m with a few pockets of snow retained where the snowdepth had exceeded 3.2 m on Aug. 10th. Snowdepth at the Sept. 27th snowline had been 3.0 to 3.2 m on Aug. 10th. This indicated ablation of approximately 3 m of snowpack, 1.8 m of water equivalent from Aug. 10th to Sept. 27th. Ablation from July 13th to Sept. 27th was 5.3 m of snowpack and 3.2 m w.e. This was 5-10% more ablation than any other year since 1984. A comparison of images from the ground on Aug. 10th indicates the snowpack on the glacier from 1550-1950 m, the blue arrows indicate locations where a patch of 2014 snow remained on Sept. 27th. The Sept. 27th image was taken by Tom Hammond from Rainbow Ridge the only location where the whole glacier can be viewed. The firn is simply old snow that survived a summer and could be from 2012 or 2013. Aug. 10th accumulation zone view
Tom Hammond Image adusted to show firn, ice and retained snow. Sept. 27th
Winter snowpack was normal on Mount Baker, the record ablation then led to a large negative mass balance for the glacier of -1.8 m, but not a record loss. The ablation did lead to many significant surface streams on the glacier shown below, which drain into the glacier at moulins.
The terminus of glacier retreated rapidly from 1984 to 1998, but has slowed as it currently is in an avalanche runout zone. We visited the terminus in 1984 and all retreat is measured from that point when the glacier was in contact with an advance moraine from the 1955-1980 period of advance. A comparison of 1993 and 2006 Google Earth images indicates the retreat, red outline 2006 margin and black outline 1993. The 2014 image taken by Tom Hammond indicates that the terminus did get exposed in 2014 which will lead to additional retreat when we measure the terminus position next summer. Total retreat from 1984 to 2014 is 490 m. 1993 Google Earth view of terminus
2006 Google Earth view of terminus.Picture of the terminus in 2014 indicating the 214 and 1984 position. Taken by Tom Hammond from Rainbow Ridge.Ablation zone on Aug. 10
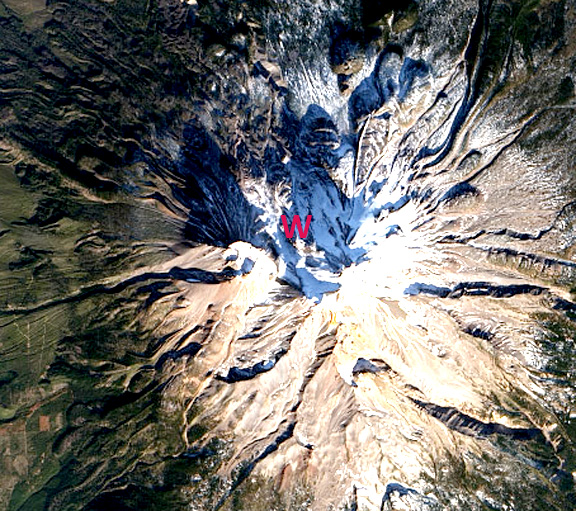
Mount Shasta is a stratovolcano home to the largest glaciers in California. Of the seven glaciers on the mountain Whitney Glacier on the north side is the longest. The last two years 2013 and 2014 have seen hot dry summers separated by a dry winter in 2013/14, see below, how are the glaciers responding? In 1981 USGS (Driedger and Kennard, 1986) mapped the area and volume of several of the glaciers, in a landmark study of glacier volume on Cascade volcaones. Whitney Glacier had an area of 1.3 square kilometers, a maximum depth of 38 m, and a volume of 25 million cubic meters. The glacier was noted as having a length of 3.0 km ending on the USGS map at 9900 feet.
January satellite image of Mount Shasta’s limited snowpack
Topographic map of Mt. Shasta.
A UCSC study looking at the change in the glaciers from 1944 to 2003 noted an expansion of the Mount Shasta glaciers that when published in 2008 was in contrast to most alpine glaciers globally or in the Pacific Northwest. Tulaczyk and Howat (2008) noted that Whitney Glacier had advanced 850 m since 1951 to 2003, but when did retreat begin? There was a period of advance for many Cascade volcanoes glaciers between 1950 and 1980, but retreat after. For example on Mount Baker all of the glaciers advanced during the 1944-1979 period by an average of 480 m (Pelto and Hedlund, 2001). By 2010 Pelto and Brown (2012) observed all were retreating with an average retreat of 370 m. In 2003 all of them all had retreated , but many were in advance of their 1944 position. By 2014 the retreat has exceeded the advance from 1944 on most Mount Baker glaciers, more on this in the next post. This is an important point for Mount Shasta too, Whitney Glacier was advancing in 2003 but had been retreating in the late 1980’s and 1990’s. Whitney Glacier was further advanced than in 1944, but how short lived was the advance? Here we examine satellite images from 1987 to 2014 to identify recent trends, along with Google Earth imagery of termini of several glaciers and the 1981 USGS observations.
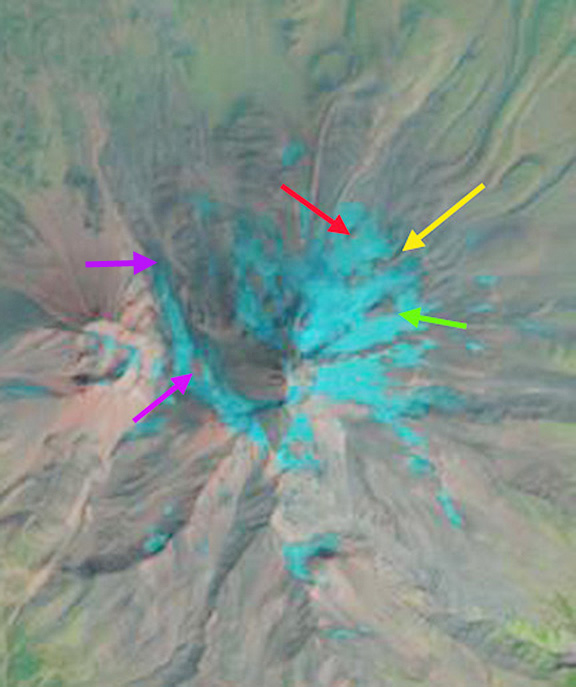
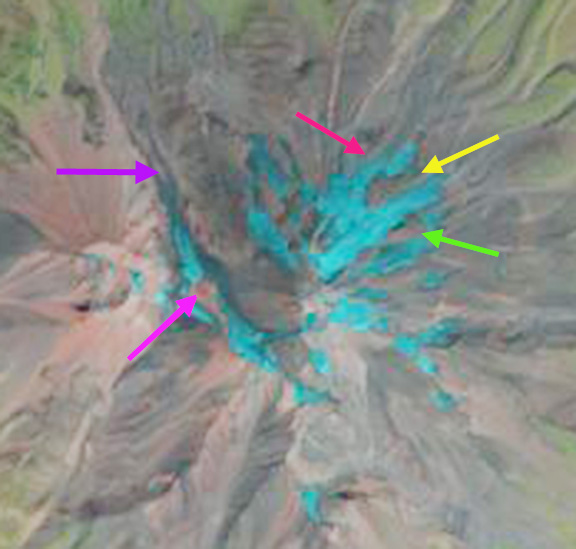
The first sequence is a 1987, 2013 and 2014 Landsat image with a pink arrow at the top of Whitney Glacier indicating the expansion of bare rock at the head of the glacier. The purple arrow is at the 1987 terminus, which indicates some retreat and also thinning by 2013.
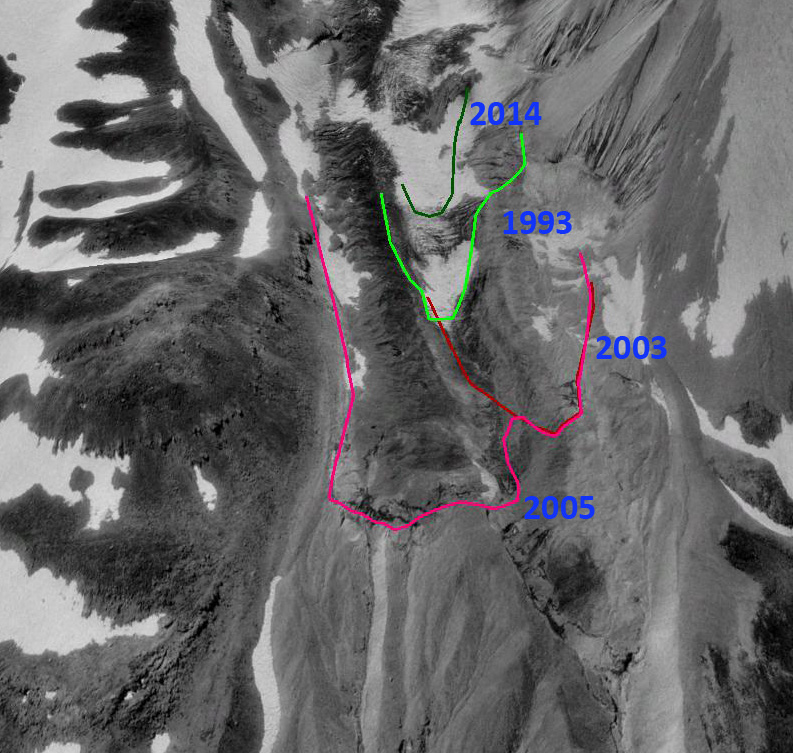
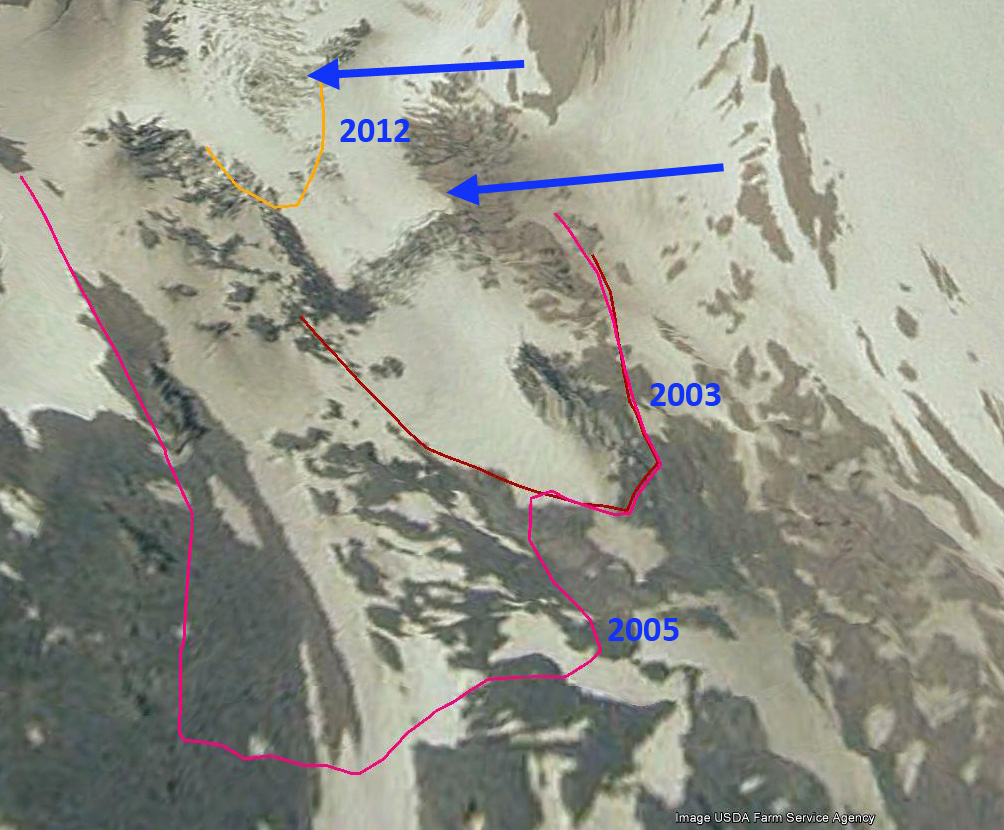
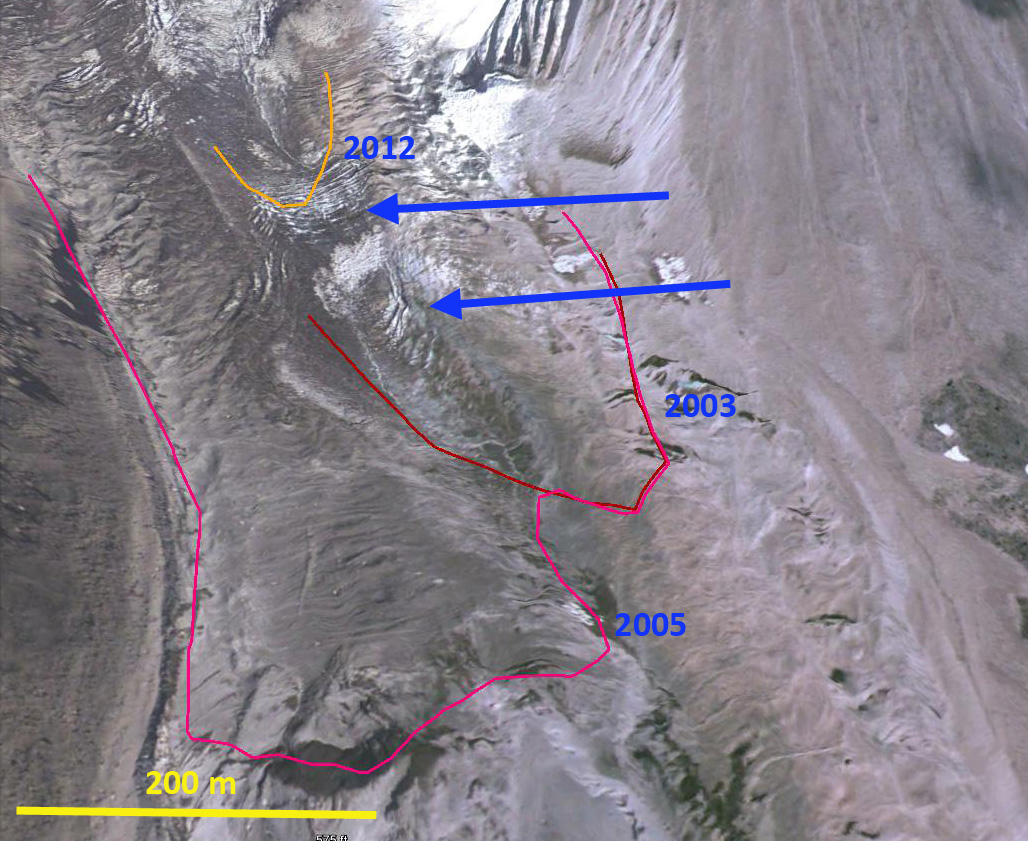
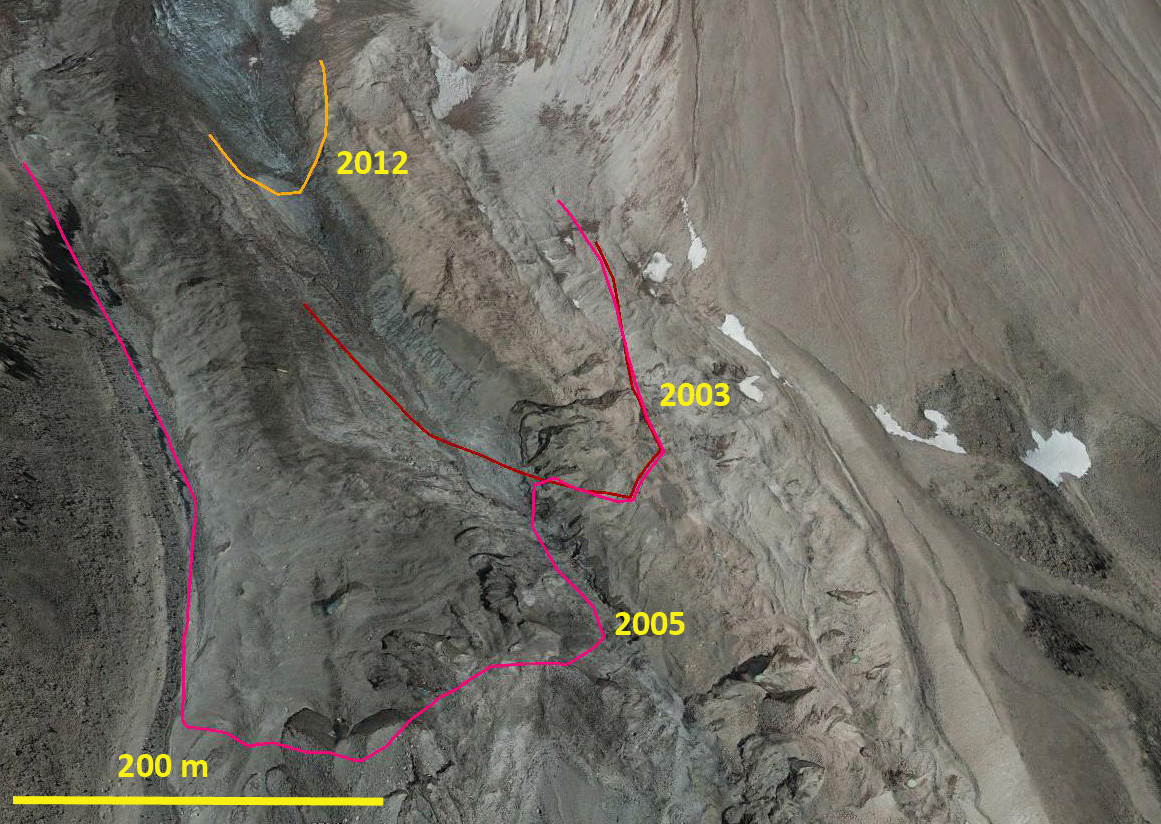
In between 1987 and 2013 of course was the period of advance and then retreat that is examined in the second sequence of images from Google Earth of the glacier in 1993, 2003, 2005, 2012 and 2014. It is evident that the glacier did expand between 1993 and 2005, as Tulaczyk and Howat (2008) had noted the advance period was unusual. The advance was likely limited to the 1999-2005 period due to heavy snowfall from 1998-2002. The 2005 terminus is quite near the 1981 terminus position indicating a period of retreat in the 1980’s and 1990’s. In 2003 and 2005 there is extensive crevassing at the blue arrows. The glacier terminus margin is indicated by a red line for 2003, pink line for 2005 and orange line for 2012 and green for 2014. It is evident that the zone of heavy crevassing and significant ice motion in 2003 and 2005 is in the vicinity of the 2012 terminus. By 2012 and 2014 the glacier is thin in its lower reaches with no crevassing. This indicates the retreat will be continuing. By 2014 the terminus of the glacier had retreated 700 m from 2005 and is now 2.6 km in length and terminates at 10,200 feet, 400 feet higher than a decade before or in the 1981 map. A closeup of the terminus in 2012 indicates the thin uncrevassed nature with surface streams incised into the ice. There are some areas of ice cored moraine beyond the current terminus.
The retreat of glaciers on Mount Shasta leads to thinner ice and lower velocities, but can also lead to ice failure and avalanching, along with more subglacial melt pockets-caves developing. This is likely beyond the recent small outburst flood on Mt, Shasta. The reduced velocity high on Whitney Glacier is evident from observations of a key crevasse set higher on the glacier beginning at an elevation of 11700 feet. The red arrows point out what is a bergshrund along most of its length separating the glacier from the surrounding non-glacier snowfields. The blue arrows indicate crevasses below the bergshrund. Note that the vertical and horizontal offset of the bergshrund had declined from 1998 to 2014, and the number and extent of the crevasses has also declined. Both indicate reduced acceleration and velocity.