Operation Icebridge kept an eye this past fall on the extensive rift transecting the PIG that will lead to calving of a large iceberg in the near future. This rift was identified by NASA’s Operation Icebridge in 2011. This rift expanded laterally through 2012 and in width in early 2013, but had not shown open water in the daily MODIS imagery until 11/11/2013. The iceberg had not detached fully from the glacier until now. The iceberg being calved is approximately 780 square kilometers in size. With the Antarctic Operation Ice Bridge just beginning a new campaign great imagery will soon come via Pine Island Glacier I am sure.
Below is the image from Nov. 11 & 16 2013 annotated followed by a sequence of MODIS images of the rift in 2012 and 2013 from the MODIS Rapid Ice Sheet Change Repository for Antarctica updated daily.

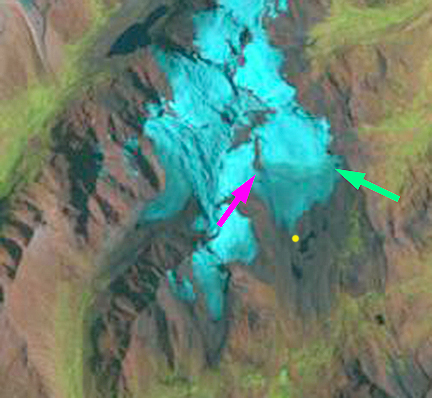
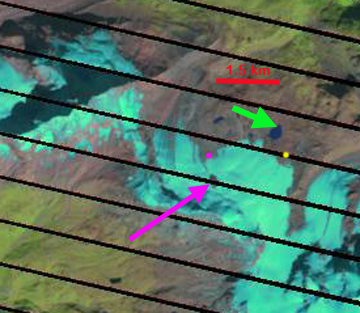
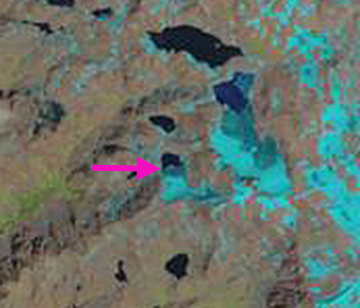
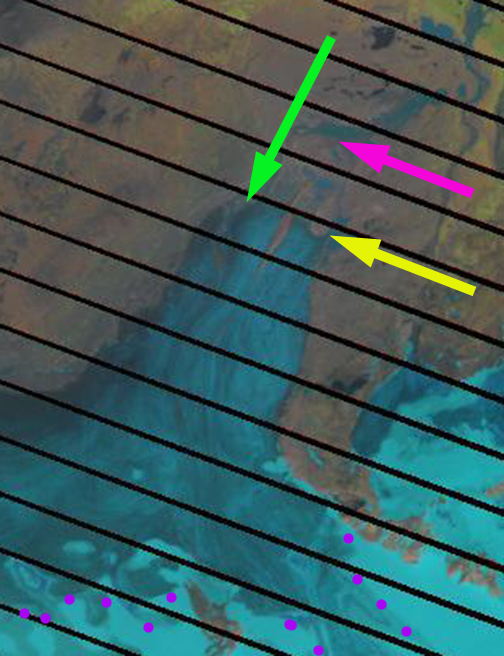
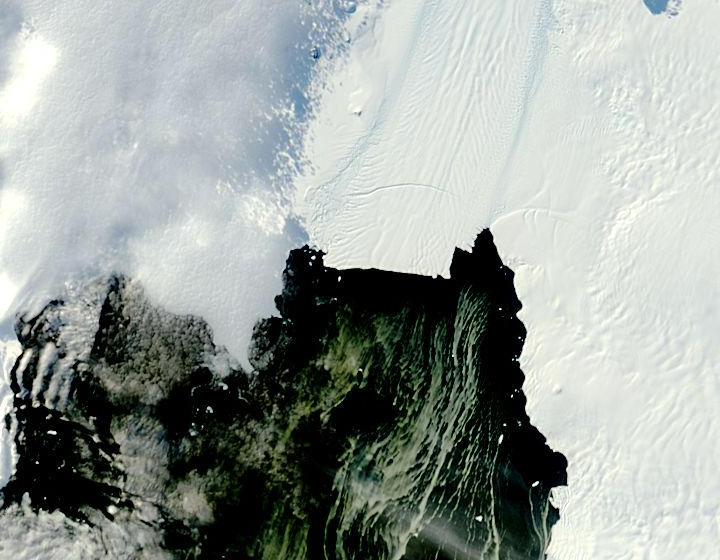
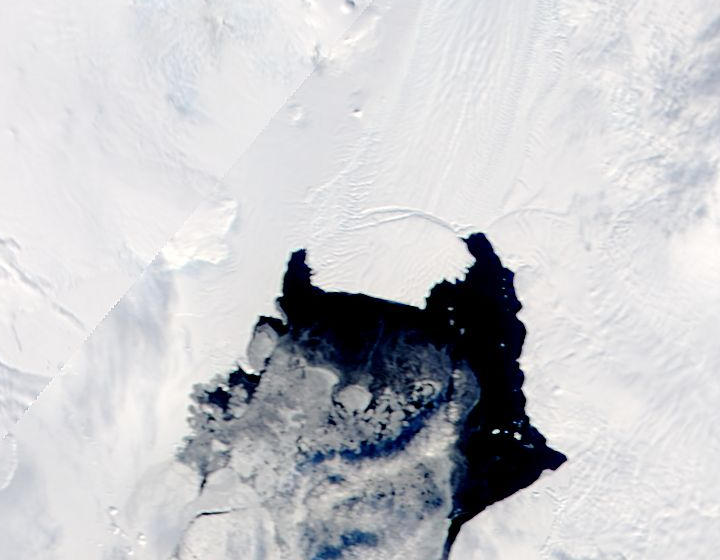
Nov. 11, 2013 MODIS
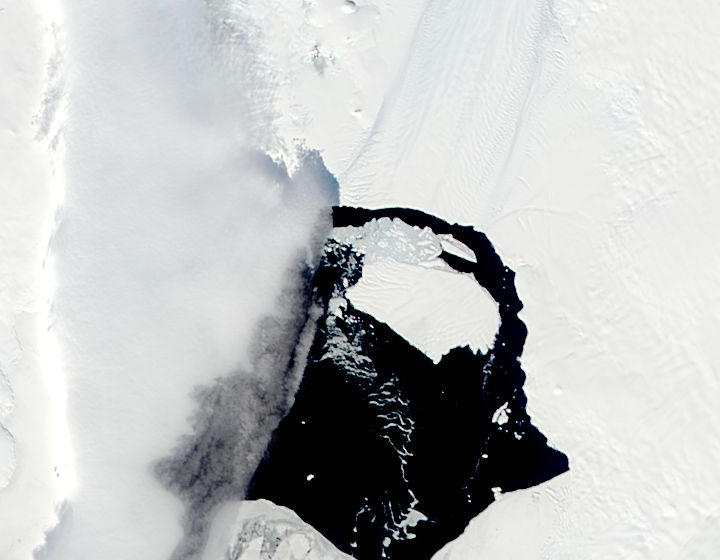
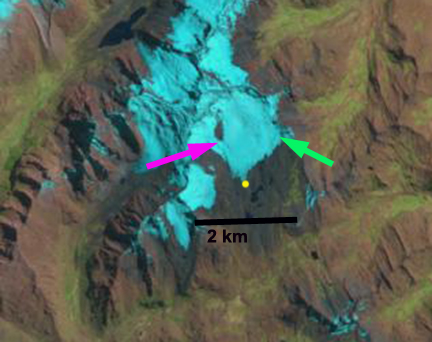
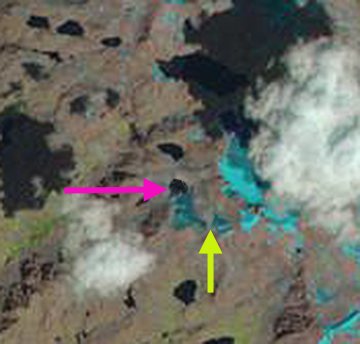
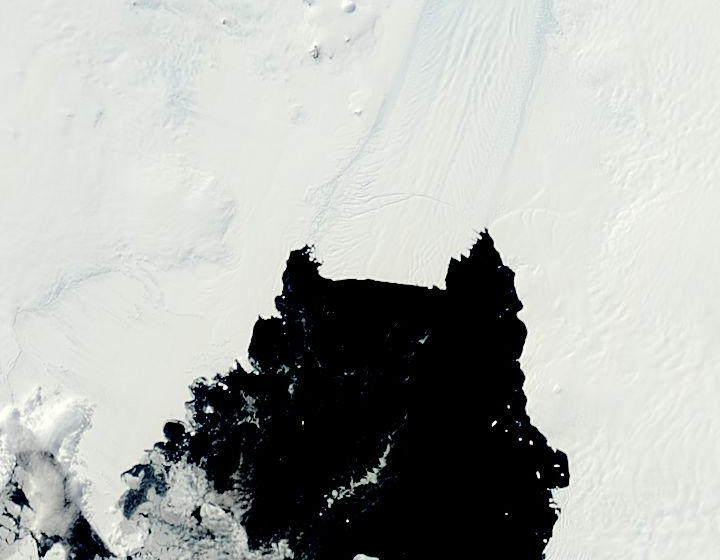
Nov. 16 2013 MODIS
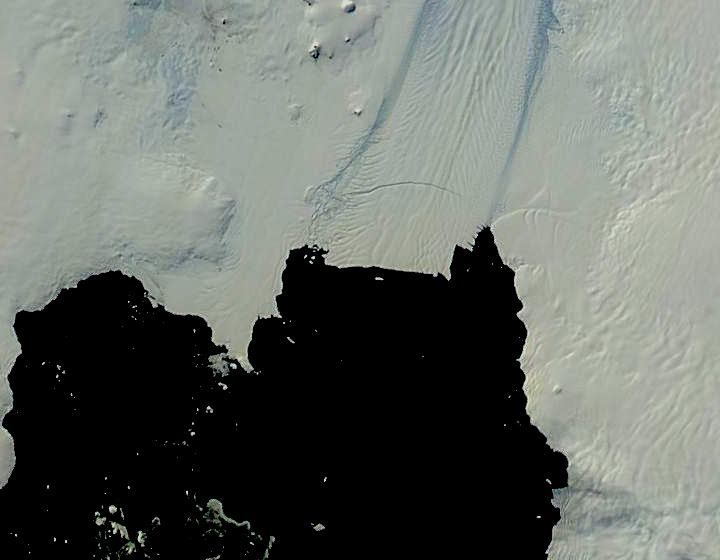
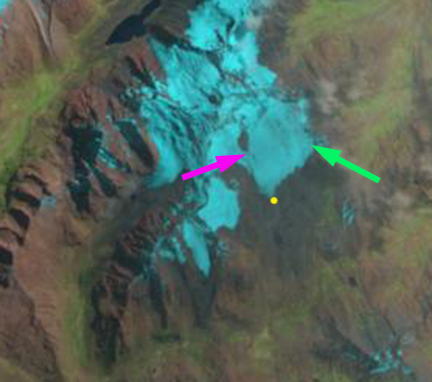
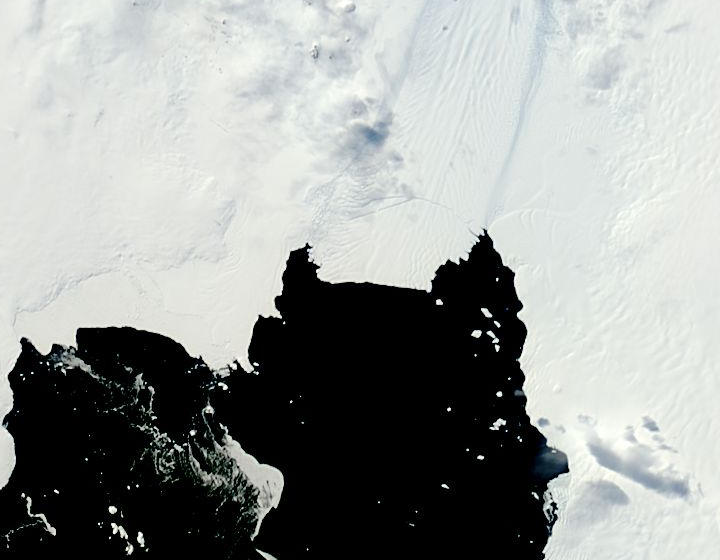
Feb. 4, 2012 MODIS
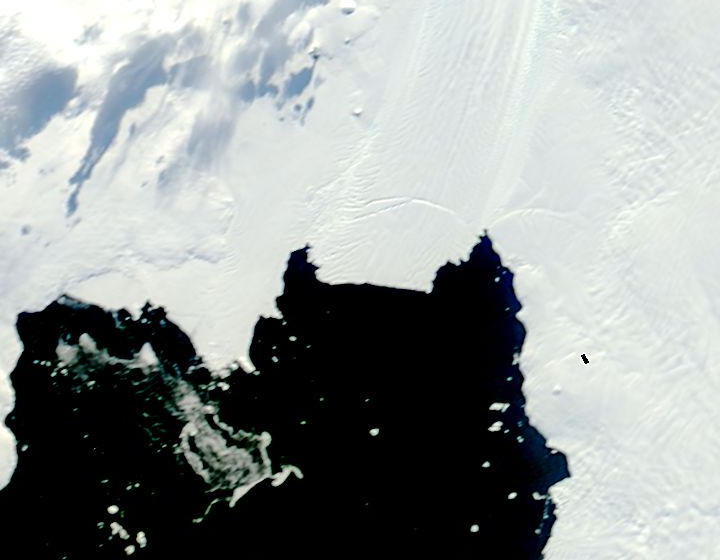
March 9, 2012 MODIS
Nov. 19 2012 MODIS

Dec. 25 2012 MODIS
Feb. 2 2013 MODIS
Feb. 9, 2013 MODIS

Feb 18, 2013 MODIS
April 3, 2013 MODIS

Oct. 23, 2013 MODIS
Nov. 5, 2013 MODIS
Nov. 11, 2013 MODIS
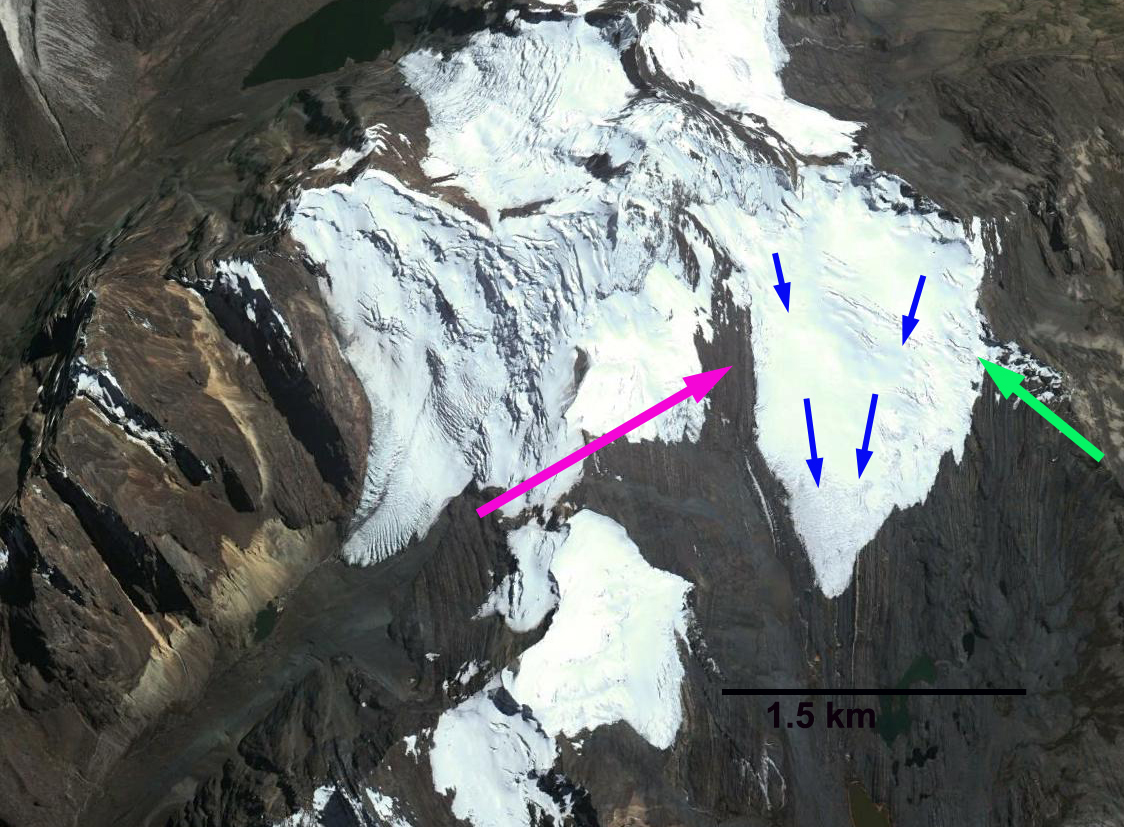
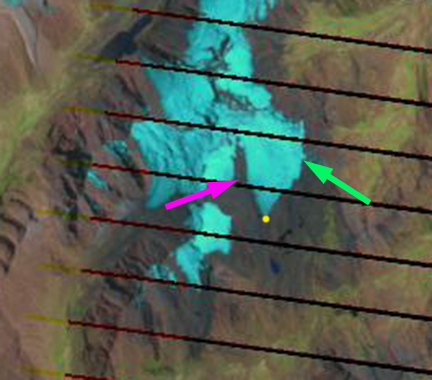
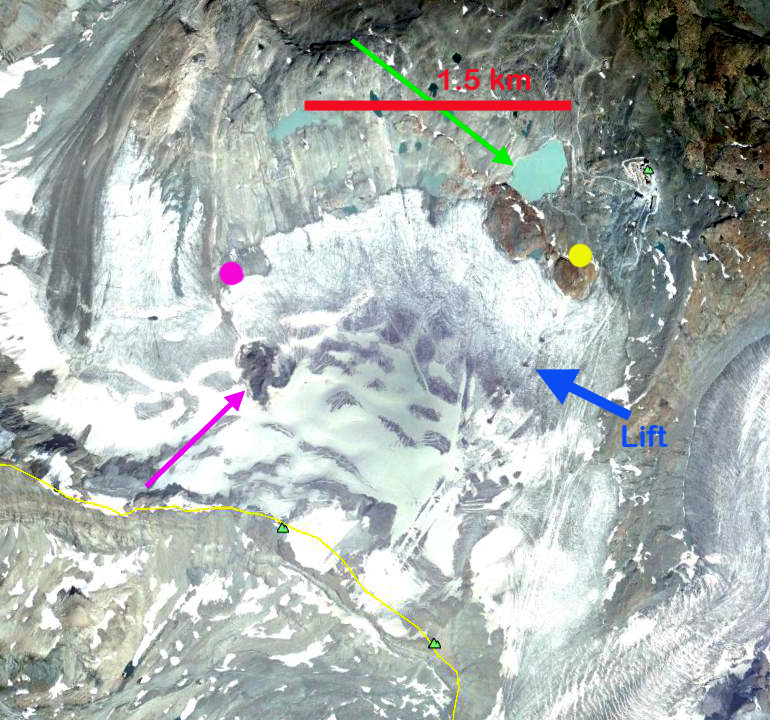
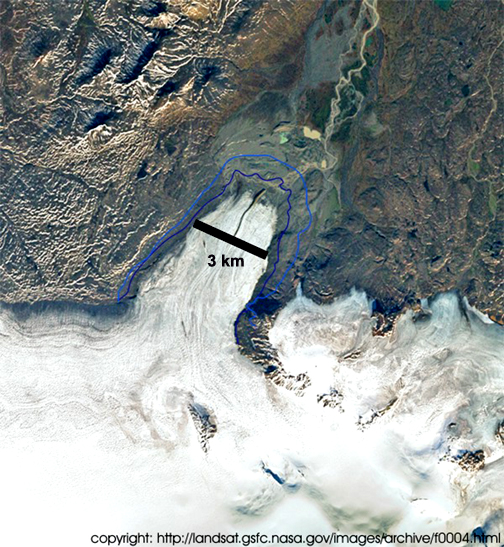
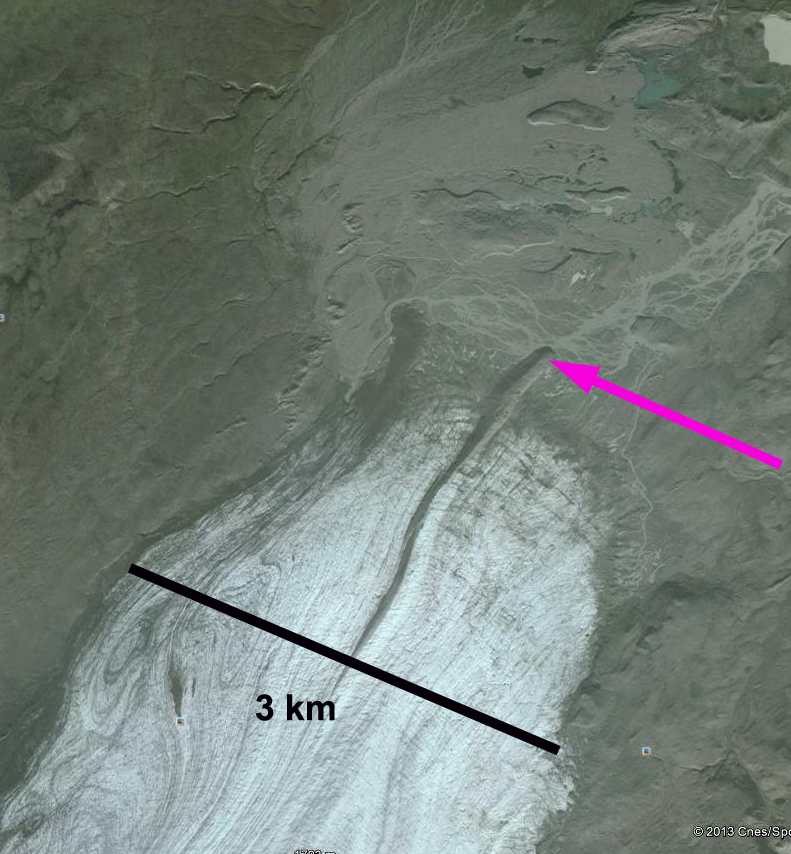
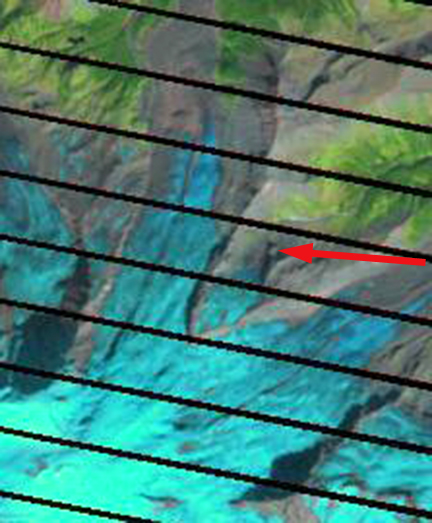
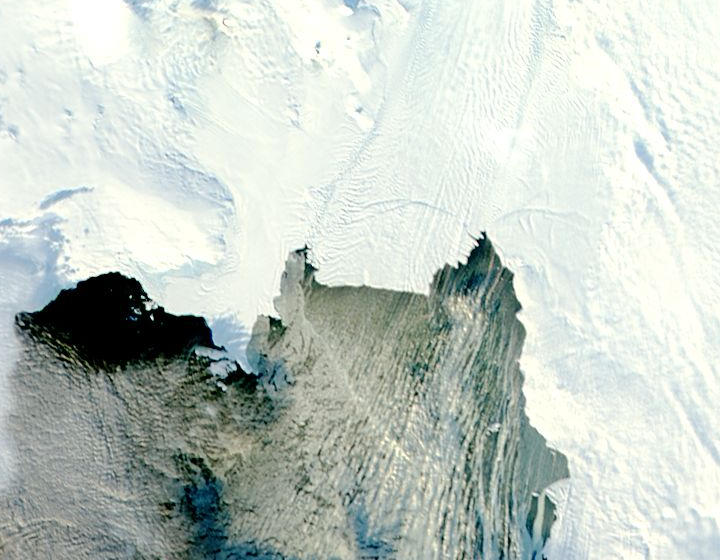
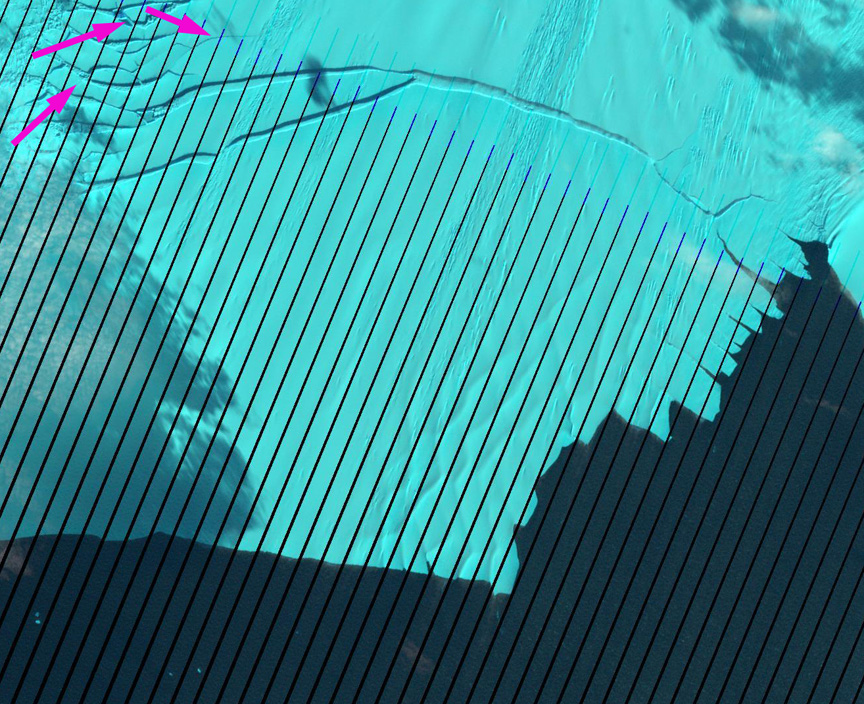 Landsat Image from March 2013, indicating the rift, before separation including additional rifts forming on east margin.
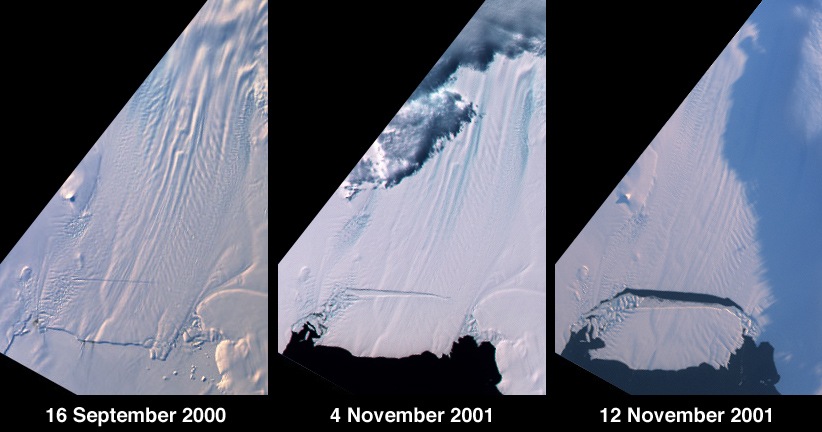
This iceberg can be compared to the development of an iceberg in 2001 (NASA 2001).
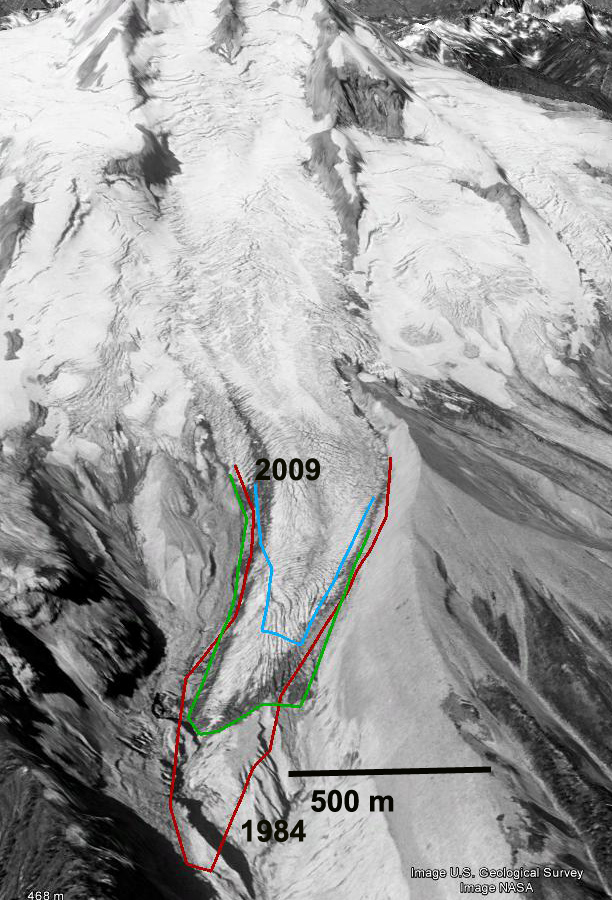
On December 17, 2012 researchers with the PIG project announced that they had successfully drilled through the remote Pine Island Glacier ice shelf.
The successful drilling will help to reach the project’s ultimate objective: to study the physical processes that are causing a rapid melting of the 60-kilometer-long (37 miles) ice shelf that extends into Pine Island Bay. One cause is suspected to be the circulation of relatively warmer ocean waters under the floating ice shelf that are undercutting the shelf (NSF, 2012). The logistics of this operation is captured in fascinating detail by the PIG Ocearnography Program. Meanwhile the Glaciology Program under Bob Bindshacler of NASA will be sizing up the glacier. PIG has thinned and accelerated since 1984, the most notable cause is melting of the base of ice sheet by warm water that was directly measured using and autosub (Jenkins et al, 2011). This research led to observations of channelized melt beneath the glacier (Stanton et al 2013).