
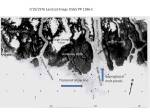
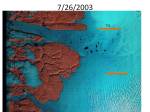
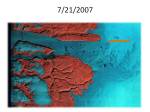
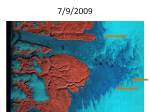
The Banded Glacier on Mount Logan in the North Cascades of Washington has retreated since 1960 creating a new alpine lake. The glacier has retreated 450 m in from 1960 to the 2006 satellite image expanding the proglacial alpine lake. This glacier is retreating as are all North Cascade glaciers. The 1960 image is from Austin Post (USGS). The 2006 image has a blue dotted line at the 1960 terminus. Note the spread of rock outcrops in the accumulation zone suggesting this glacier will have trouble surviving, a blue arrow indicates the new rock outcrops..The glacier has lost 40% of its area in this 46 year period. The north side (left side in the image) is very short at this point. The new lake has a number of icebergs in it. The number of crevasses has also diminished as the glacier has thinned, become shorter and as a result moves slower. The images below are from 1960, 1998, 2006 and 2009. The retreat from 1998-2009 is 270 meters.


 The slower movement is despite an increase in surface slope as the glacier has retreated from the flatter lake basin area onto the slopes leading to the summit of Mount Logan. This glacier is difficult to view unless you are right in the basin where it is. In 2005 and 2009 this glacier lost almost all of its snowcover, not a good sign for a glacier to survive.
Category: Glacier Observations
Post detailing changes in a glacier
North Cascade Glacier Mass Balance 2010
 A glacier has no memory of the past year when it comes to mass balance, unlike say the extent of sea ice, it is more like the extent of snowcover. This was emphasized by a comparison of glacier mass balance in the North Cascades from 2009 to 2010. Temperature sensitivity is also highest during the summer for a glacier and for snowcover in general. As the melt season begins the snow cover extent is large on a glacier-100% for North Cascade glaciers. The key is how rapidly the snow line rises during the melt season. For continental scale snowcover it is more of a recession northward. In the Northern Hemisphere for example February 2010 was the third most extensive snow cover extent of the last 44 years, March the 18th of the last 44 years, and April the 41st most of the last 44 years, in the Northern Hemisphere and the 44th most extensive in North America. (Rutgers University Global Snow Lab). This change indicates a record snow cover melt off in 2010 for the last 44 years. This was not surprising given that global temperatures anomalies were also at there highest levels during this period. This can happen on a glacier as well.
 For North America the main change with global warming is the decrease in melt season snow cover extent as noted in the image below, which shows red for well below average snowpack, and dark blue well above average snowpack. Note the dark blue nature of summer in the 1970’s and the dark red in the summers after 2003. t is during the summer when temperature alone is the key, not storm tracks and jet stream position.
  . For the North Cascades the summer melt season of 2009 was the record, not 2010. North Cascade glaciers over the 27 years I have been monitoring them. I
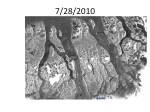
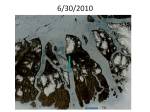
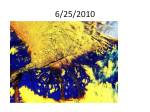
For the North Cascades In 2009 a negative PDO (Pacific Decadal Oscillation) and negative ENSO (La Nina) existed leading to below normal temperatures and average precipitation during the winter in the Pacific Northwest. The combination of a negative PDO and a negative or equilibrium La Nina has led to an equilibrium or positive glacier mass balance in the North Cascades, WA in 13 of 16 years since 1960. The summer of 2009 had the highest total ablation recorded during annual mass balance measurements since 1984, offsetting good winter snowpack and leading to a mean negative mass balance of -1.9 m. In 2010 a positive PDO and ENSO (El Nino) conditions persisted during the winter leading to above normal temperatures and average precipitation in the Pacific Northwest. The combination of a positive PDO and El Nino has led to negative glacier balance in all 14 years this has occurred since 1960. A markedly cool 2010 melt season led to near minimum ablation since 1984, and an equilibrium mean annual balance of 0.05 m. Ablation season conditions dominated the mass balance record for both years. In 2009 there was a transition from a La Nina to an El Nino accompanied by a change to a postiive PDO. In 2010 a change from an El Nino to a La Nina and to a negative PDO. We will be exploring the impact of coastal upwelling strength, upwelling onset, PDO, ENSO and the Pacific Transition for these two unusual summer seasons. In 2009 a high pressure ridge was centered over the West Coast, upwelling began early and there was limited marine influence along the coast. In 2010 an anomalous high pressure center in the eastern North Pacific generated northerly winds along the West Coast and a late onset of upwelling. Our goal is to be able to forecast the summer melt season conditions sometime in May. A comparison of the mass balance maps for Columbia Glacier in 2009 and 2010 illustrates the difference
 The lines are contours of mass balance ochre is the zero balance line as of August 1, then brown-red 1 m of snowpack, blue, two meters and green three meters, than lime green is the end of summer snow line. Note that as of Aug. 1 both years had nearly identical snowpack, but ablation was much higher due to record warmth in August 2009, and the snowline ended much higher than in 2010. The result despite less winter snowpack, a more positive though still negative mass balance for Columbia Glacier in 2010. In the summer of 2010 we measured the snow depth and/or snow melt at 180 locations on this glacier. The Columbia Glacier is a low elevation glacier mostly below 5200 feet. It is also avalanche fed. Both factors led to abnormally low snow accumulation in the winter of 2010, and despite the cool summer a negative balance. Easton Glacier on Mount Baker on the other hand is mostly above 6000 feet, and does not receive avalanche accumulation. The winter snowpack was close to normal and then below normal melting led to a positive mass balance. The glacier gained an average thickness of 0.7 meters. This is small compared to the loss of 2 meters.
Glacier Nef Retreat, Rio Baker, Chile
Glacier retreat and thinning is particularly strong in the Patagonian icefields of South America. The two largest temperate ice bodies of the Southern Hemisphere are the Northern Patagonia Icefield (CHN image below) 4,000 km2 and the Southern Patagonia Icefield (CHS), 13,000 km2.  It has been estimated that the wastage of the two icefields from 1995–2000 has contributed to sea level rise by 0.105 ± 0.011 mm year,which is double the ice loss calculated for 1975-2000 (Rignot et al. 2003).Nearly 90% of the glaciers studied are affected. Of the 72 glaciers surveyed in the region 63 have retreated significantly, only eight have remained stable and one advanced. O’Higgins Glacier, which feeds the Pascua River has retreated 11.6 km, IRD, 2010. Baker River (Rio Baker) is located to the east of the Northern Patagonia Icefield and is fed mainly by glacier melt water originating from the eastern outlet glaciers of the iecefield Leones, Soler, Nef, Colonia. Rio Baker is the most important Chilean river in terms of runoff, with an annual mean discharge of about 1000 m3/s . Glacier Nef is one of the main glaciers feeding Rio Baker. Rio Baker is a critical hydropower resource for Chile. Hidroaysen Project is proposing 5 dams on the Baker and Pascua River generating 2750 MW of power. Glacier Nef retreated 3400 m from 1945-2000, 2400 m retreat of the retreat occurred in the 1994 collapse of the terminus tongue into the proglacial lake, which is now 3.5 km long as seen in the image from Pierre Chevallier IRD.
  The glacier has an area of 164 km2 the proglacial lake began to from after 1945, but was less than 1 km long until after 1994. The glacier had primarily been thinning in height and width near the terminus from 1945-1994
(Aniya, 1986 ) and Winchester, et al. (2010). Below is a map of the hydropower project, from Hidroaysen Project .  Today Glacier Nef has not reached the head of this proglacial lake and will continue to retreat. The west side of the terminus is debris covered and has a fringing proglacial lake. The lack of elevation change and the isolated proglacial lake here suggests the lake will expand laterally as well as length wise. The retreat follows the pattern of enhanced calving in a proglacial lake for NPI glaciers such as , Gualas GlacierReichert Glacier, Steffen Glacier, and Colonia Glacier. The retreat via calving due to a thinning terminus tongue is similar to the case on Gilkey Glacier, Alaska, Tasman Glacier, New Zealand and Triftglestcher, Austria. The visible trimline indicates the thinning. The lack of vegetation indicates the recent nature of the retreat from this lateral trimline.
 The glaciers feeding Rio Baker remain quite large and will remain a large meltwater source for the forseeable future. The majority of Glacier Nef is above the recent equilibrium line altitude of 1200 m. The section of the Rio Baker below is where one of the dams will go.
Stephenson Glacier retreat, Heard Island
The Australian Antarctic Division manages Heard Island Island and has undertaken a project documenting changes in the environment on the island. One aspect noted has been the change in glaciers. The Allison, Brown and Stephenson Glacier have all retreated substantially since 1947 when the first good maps of their terminus are available. Fourteen Men by Arthur Scholes (1952) documents a year spent by fourteen men of the Australian National Antarctic Research Expedition. Their visit to the glacier noted that they could not skirt past the glacier along the coast. After crossing Stephenson Glacier they visited an old seal camp and counted 16,000 seals in the area Ensuing mapping and aerial photography has enabled a sequence of glacier boundary maps to be created that illustrate the changes in the glaciers. Thost and Truffer (2008) noted a 29% reduction in area of the Brown Glacier from 1947-2003. They also observed that the volcano Big Ben that the glaciers all drain from has shown no sign of changing geothermal output to cause the melting and that a 1 C warming has occurred over the same time period. Stephenson Glacier extends 8-9km down the eastern side of Big Ben. it 1947 it spread out into a piedmont lobe that was 3 km wide and extended to the ocean in two separate lobes around Elephant Spit. A picture from the Australian Antarctic Division taken in 1947 shows the glacier reaching the ocean and then in 2004 from the same location. 
 around then broadens to form a piedmont lobe up to -3 km wideKiernan and McConnell (2002) an order of magnitude increase in the rate of ice loss from Stephenson Glacier after 1987. Retreat from the late 19th century to 1955 had been limited.
  As Kiernan and McConnell observed retreat began to increased and by 1971 the glacier had retreated 1 km from the south coast and several hundred meters from the northern side of the spit. This retreat by 1980 caused the formation of Stephenson Lagoon and by 1987 Doppler Lagoon had formed as well. After 1997 the two lagoons have joined as Stephenson Glacier has retreated rapidly. The terminus is now 2.2 km from the south coast and 3.1 km from the north coast. The highly crevassed area above the terminus indicates the rapid ongoing flow of the glacier. The terminus is highly fractured in Google Earth Imagery indicating this section will continue to retreat via calving of icebergs into the lagoon, which is quite full as it is. The first image below shows the terminus location over the last 60 years from the Australian Antarctic Division. The second image are the AAD overlays that can be imported into Google Earth. The last image is a closeup of the still disintegrating terminus into the combined lagoons from 2008.

 The Stephenson Glacier is undergoing a rapid calving retreat that began due to ongoing mass balance loss. This mass balance loss is shared by the other glaciers on the island are observations, though the actual terminus retreat may be less the volume losses of Brown Glacier recently have been large.
Ryder Glacier, Northern Greenland Transient snowline rise
Ryder Glacier drains from the northern margin of the Greenland Ice Sheet into Sherard Osborn Fjord. The glacier was first surveyed by Lauge Koch in 1917. By 1956 the glacier had lost 75% of its floating tongue. Since 1990 the glacier front has advanced slightly with much of this change beginning in a mini-surge in 1995. As noted in the Arctic Report Card 2010 since 2000, the net area change of the 35 widest marine-terminating glaciers is -1535 km2. This is an effective average glacier length change of -1.7 km since year 2000. While the overall area change indicates the largest observed retreat, 7 of 35 glaciers did advance in 2010 relative to 2009. The largest glacier advances were at Ryder and Storstrømmen glacier, each advancing 4.6 and 4.2 km2, respectively.The shelf front of Ryder Gletscher advanced has advanced recently at about the
rate of flow, but it is thin <200 m and fractured in the floating region. This does not appear to be an advance driven by increased mass balance. In the last decade particularly since 2003 the transient snowline observable in satellite images has in most years reached 1000 m. The floating tongue has to date managed to avoid the large losses on Petermann Glacier. Both glaciers have experienced enhanced surface melt, the key has been greater basal melt to date at Petermann Glacier. This is in contrast to the 800 m level reported in the Satellite image Atlas of Greenland. The transient snowline (TSL) on the outlet glaciers of the local ice caps provides a crucial measure of annual balance and the extent of significant melting on the Ice Sheet. The number of satellite images available has increased dramatically providing the capability for TSL identification daily if clouds permit using MODIS. MODIS, Landsat 7, NOAA Microwave imagery and ENVISAT images below indicate the transient snowline for the Ryder Glacier area. Note that many of images from late June indicate a TSL in the 1000 m range even early in the melt season. To the west of Ryder Glacier (R), Steensby Glacier (S) and sometime Petermann Glacier (P) are evident n the outlet glaciers of Steensby Gletscher and Ryder Gletscher, where
it reaches an altitude of approximately 800 m. Ryder Glacier’s TSL lies very close to the southern boundary of the processed images from the Danish Meteorological Institute. The first slide is the topgraphy of the Ryder Glacier near the TSL, the second is a 1976 satellite image from the USGS Greenland Satellite Image Atlas 1386-c. The rest are annotated images downloaded from DMI or from the USGS for the Landsat images which are false color images. The TSL tends to rise from 975 m to the east of the glacier outlet to 1100 m south of and west of the fjord entrance.


Sara Umaga (Tos) Glacier, India snowline rise and retreat-Hydropower
Sara Umaga Glacier drains into the Beas River in the Himachal Pradesh region of India. The glacier has retreated over 1600 meters since initial 1970. The glacier is also a key water source for hydropower, this will be detailed below. The glacier is 15 km long extending from 5600 m to 3900 m. The glacier has retreated at a rate of 44 meters/year from 1989-2004 (Kulkarni, 2005). The glacier is adjacent to the Chota Shingri Glacier which has retreated at a rate of 7 m/year from 1970-1989 and 27 m/year from 1990-2000. The retreat is the result of the rise of the equilibrium line, approximately the snowline at the end of the summer, where ablation equals accumulation. In the late 1980’s the snowline averaged 4700 m. In recent years the snowline has been a high as 5180 meters (Wagnon et al., 2007). This same rise has led to high snowlines on the Sara Umaga Glacier. In recent satellite images the snowline is above 4900 m, and the snowline is below where the ELA will be at the end of the melt season. The snowline and the head of the glacier are noted in the image below. This leaves only 20 % of the length of the glacier in the accumulation zone. In terms of area 25-30% of the area of the glacier has been above the current ELA. For a glacier to be in equilibrium at least 50% of the glacier must be in the accumulation zone. The Sara Umaga is retreating as it cannot sustain the large lower elevation ablation area. Retreat has revealed two vegetation trimlines. The older is a Little Ice Age trimline-the former the trimline is from the 1950-1970 period.
  This is an attempt to restore equilibrium. An examination of the heavily debris covered ablation zone indicates that the lowest 2.25 km of the glacier is stagnant and will melt away. The end of the stagnant zone is indicated by the green arrow and the change in thickness to the Little Ice Age lateral moraine by the brown arrow and the current terminus by the pink arrow.
 . The lower section of the glacier is heavily debris covered which reduces melt rates. There is no apparent crevassing or convex shape to the glacier cross profile in the lower 2.25 km indicating stagnation. The debris covered section is not sensitive to soot deposition, as it is already sufficiently dark. The Glacier drains into the Beas River, which flows first through the Larji Hydropower project, which alters streamflow often leaving the stream below nearly dry. The Beas River is then impounded by the Pandoh Dam-and lake, third image below, which diverts water through a tunnel into the Saltuj (Sutlej) River, fourthimage, and thence the Bakrhra Dam at 1200 MW hydropower project. The tunnel from Pandoh is the largest tunneling project in Inida 13 km with a diameter of 8 m.
Larji Hydropower looking upstream to reservoir and beyond. Notice the influence of the dam on the river which is nearly dry below the dam on the date of the imagery near Markanada Temple.


Ried Glacier Rapid Glacier loss, Switzerland
Ried Glacier is beneath the Durrenhorn in the Pennine Alps of Switzerland. The glacier was 6.3 km long in 1973. In 2010 the glacier is 5.1 km long. From the Swiss Glacier Monitoring Network annual measurements, Ried Glacier retreated 300 m from 1955-1990, 8 meters/year. From 1990-2008 retreated an additional 300 m, 30 m/year. Than in 2009 the glacier retreated 500 m. A comparison of a 2004 image taken by M. Funk and a Sept. 2008 image from D. Gara
 indicate why the change was so abrupt. The glacier had been retreating upvalley with a long gentle terminus tongue. This section of the glacier separated from the glacier in late 2008, with the terminus now ending on a steep rock slope. There is still stagnant ice in the valley below the end of the current glacier. It is heavily debris covered and no longer connected to the glacier system. This glaciers recent rapid retreat parallels that of Dosde Glacier, Italy and Triftgletshcer, Switzerland and Rotmoosferner, Austria. A look at the glacier system and the terminus in Google Earth imagery provides a broader view of the glacier behavior. The terminus in this image still extends downvalley with the low sloping tongue that is now separated. Current terminus marked with red-T.

In the imagery above the glacier is still connected to the terminus tongue. It is evident that the glacier has two primary icefalls at that time. The upper icefall is the location of the annual snowline, where accumulation tends to persist throughout the year. Below this point only seasonal snowfall is retained. The retreat history from the Swiss Glacier Monitoring Network is seen below.
Quien Sabe Glacier Retreat
The Quien Sabe Glacier in the North Cascades of Washington has experienced rapid retreat in the last 20 years. This glacier is the largest in Boston Basin near Cascade Pass, its name translates to “who knows?”, well we all know it is not enjoying recent climate. In the 1960 Austin Post photograph he gave to me in 1994, the glacier was heavily crevassed and advancing. By 1975 the advance had ceased, but little retreat occurred until 1987.  This glacier faces south and is fed by avalanching off of Forbidden and Sahale Peak. The glacier retreated 1200 meters from its Little Ice Age maximum (moraine indicated with blue arrows) until 1950. Richard Hubley noted the advance by 1955, the total advance was 55 meters by 1975 (advance moraines noted with orange arrows).
 We were able to identify the advance moraine in 1985 when it was still quite evident. The smooth bedrock, Granodiorite in the basin, provides little friction for this glacier as it moves over the polished slabs. Today the terminus moraines from 1975 range from 150-250 meters from the current glacier terminus averaging just over 200 meters. For a glacier that averages 700 meters in length this is a significant loss of total area. There are a number of bedrock outcrops that have appeared above the terminus indicating how thin the terminal area is and that retreat is ongoing.
  . In 2009 the glacier lost almost all of its snowcover an occurrence that has become frequent in the last 18 years. In this August image the glacier is 25% snowcovered.
  Fortunately 2010 was a better year in terms of snowcover, with more than 50% of the glacier snowcovered at the end of the summer, photograph from Neil Hinckley.
Quien Sabe Glacier viewed from a similar location on the western side of the glacier in 1985 and 2007. The reduction in crevassing, thickness is evident as is the marginal retreat and emerging bedrock. 

Dosde Glacier, Italy retreat and separation
Dosdè Glacier in the Dosdè-Piazzi Group of the Italian Alps has been the focus of research by the University of Milan Department of Geography in the last decade to both chronicle its retreat, examine the causes, and evaluate the impacts and potential mitigation steps. In 1954 there was a Dosdè Est, Dosdè Centrale and Dosdè Ovest glaciers with respective areas of 1.2 and 0.8 and 0.9 square kilometers. By 2003 the areas had been reduced to 0.8, 0.5 and 0.3 square kilometers. This is evident in the picture from 1932 and 2007 of the Dosdè Glacier group from Guglielmina Diolaiuti, University of Milan. I have added arrows annotating key changes Est is on the left, Centale in the middle and Ovest (labelled Ost) on the right.  The purple arrow indicates the separation of two glaciers. The blue arrow indicates the change in glacier size near the top of the peak. The orange arrow notes the thinning of the glacier near the current glacier tongue. The green arrow indicates the retreat at the head of the glacier indicating thinning even in the accumulation zone. This glacier lost all of its snowcover in several recent summers including 2010, in this Google Earth view the summer of 2010 is ongoing and their are a few white patches of snowpack from the previous winter, that were then lost. This inconsistency of the accumulation zone is a sign of a glacier that cannot survive
 In this region at least 6 glaciers have been observed to disappear in the last 50 years. The continued decline in area and lack of accumulation zone persistence does not suggest that glaciers in this mountain massif will survive. Dosdè Est has retreated over 400 meters in the last 50 year, but of more importance to its survival is the degree of thinning apprarent from the terminus to its head. Dosdè Est has been the focus of study utilizing a covering blanket to examine its efficacy in reducing ablation as was done on Stubai Glacier in Austria. The University of Milan group reported a 43% decline in snow ablation and a 100% decline in ice ablation. The retreat of this glacier follows the trend of increasingly rapid and widespread retreat seen throughout the Italian Alps, as chronicled by the Italian Glacier Commission, which reported more than 95% of the over 100 glaciers examined retreating from 2000-2005. The smaller size and elevation range of the Dosdè Glacier group makes them more vulnerable to complete loss than Forni Glacier.
Neumayer Glacier, South Georgia Retreat
South Georgia sits amidst the furious if not screaming fifties latitude belt, the circum Antarctic westerlies. This region is famous for the endless march of storms parading around Antarctica. The island is south of the Antarctic Convergence, preventing any truly warm season from persisting. The cool maritime climate leads to numerous glaciers covering a majority of the island and quite low equilibrium line altitudes. Sugden, Clapperton and Pelto (1989-sorry no good link to this paper, one of the first I worked on), 1989 noted the ELA of Neumayer Glacier at 550 m. The tidewater glaciers of South Georgia in general maintained fairly advanced positions unitl 1980. Gordon et al., (2008) observed that larger tidewater and sea-calving valley and outlet glaciers generally remained in relatively advanced positions until the 1980s. After 1980 most glaciers receded; some of these retreats have been dramatic and a number of small mountain glaciers will soon disappear. Neumayer Glacier is one of the large tidewater glaciers on South Georgia. Maps from the British Antarctic Survey (BAS) and satellite imagery are used here to assess the changes in this glacier terminus position. A view of the entire glacier in 2006 from Google Earth, from beyond its calving terminus, indicates indicates the glacier remains vigorous with extensive crevassing at the calving front and extensive snowcover above the ELA.  The BAS has a mapping function that provides glacier front positions since early in the 20th century. For Neumayer Glacier the 1938 position is 3.5 km down fjord from the 2006 position. There was essentially no retreat up to 1974 and limited retreat up to 1993.
  . In 2004 and 2009 NASA provided two images of Neumayer Glacier indicating retreat from 2004 when the glacier extended to the down fjord edge of a tributary glacier from the south. By 2009 the glacier has retreated upglacier of this now former tributary, this retreat is 1300 m. Landsat Image from 1999 to 2014 indicates retreat of 4800 m from the red to the green arrow , this is 320 m/year. The glacier appears to have retreated into a deeper section of the fjord then where it ended from 1970-2002. This will enhance calving from the glacier, and promote additional mass loss and retreat. This retreat will impact Konig Glacier which is connected to the Neumayer Glacier. Calving rate increases with water depth and the degree of glacier. Pelto and Warren (1991) provided an expanded version of the relationship first quantified by Brown and others (1982). In the you would have never guessed it category, is the glacier retreat has been an aid to the rat population, as the glacier tongues used to corner populations.


Rainbow Glacier Mass Balance
In 2010 at the end of a four day period of cool rainy weather we hiked into to our base camp on Ptarmigan Ridge to measure the mass balance of the Rainbow Glacier on Mount Baker in the North Cascades of Washington for the 27th consecutive year. Below is a view of Rainbow Glacier as we approach it. This is a valley glacier that begins on the slopes of Mount Baker at 2200 m and descends to a terminus that is often avalanche covered at 1350 m.  The year proved to be the most variable in terms of glacier mass balance of any of our 27 years. Assessing the mass balance requires melting the extent and depth of snowpack on the glacier. We had a chance to measure the snow depth in 121 locations using crevasse stratigraphy and probing. The below image has all of the measurement locations, blue dots, and the rough contours of mass balance marking the snowline in green-blue, the 1 meter of snowpack water equivalent (swe) in purple and the 2 m of swe in blue. Glacier margin is in orange-brown.
 . The initial field assessment of mass balance for the Rainbow Glacier in 2010 was +0.81 m. At this time the significant melt season is at an end, new snow is projected for tomorrow 9/23. The average over the previous 26 years has been -0.40 m/year. Of the ten glaciers we monitor there was a split with six having negative balances and four positive, the variation is unusual. The probe is a half inch diameter steel rod that is easily driven through the snowpack until the hard icy layer marking last years summer surface is reached. This can either be bare glacier ice or the firn from the previous year. In either case it cannot be penetrated. The second means is to lower a tape measure down the wall of a vertically sided crevasse. This provides a two dimensional measure and view of snow depth versus the point measurement of probing. By late summer the density of the snowpack is uniform in the North Cascades. We survey the blue ice regions using a GPS to map the boundaries. Melting is assessed by observing the progressive ablation of snow and ice. On Rainbow Glacier snowpack was normal below 1800 m, where probing is dominantly used.
  The snowline was at 1450 m in early August and had risen to 1600 m by late September. Above 1600 m the snowpack increased very rapidly this year from 1.5 m at 1800 m to 5.5 m at 2100 m. This reflects the unusually warm winter that led to a dearth of snow below 1800 m by winters end. Above this elevation several winter events that were rain below were snow. Than melting was well below normal in the summer of 2010. Again spring snow storms retarded melt above 1800 m, while those were rain events below this elevation.
Crevasse stratigraphy was the dominant tool of measuring snowpack on the Rainbow up to is divide with Mazama Glacier. Navigating these crevasses takes considerable care using the snow probe as a crevasse probe. 
 .
. The area of bare glacier ice is riven by some large streams, which are also the focus of annual observation.

 T The terminus this summer was buried in snow from an avalanche, as was the case last year. In 2007 the terminus was fully exposed and we could measure the retreat at 450 m in the last 25 years.
  This glacier’s mass balance history follows that of the other northwestern North American glaciers which also is right in line with global mass balance. All data is from the WGMS.
 One of the best parts of this location is the gorgeous campsite we use for a base camp. It is above the glacier so we have to hike uphill at the end of the day.
  . his area is noted for its mountain goats as well which we count annually.
  We will complete a final analysis in the next month and report this data to the World Glacier Monitoring Service.
Engabreen Glacier, Norway retreat
Engabreen is an outlet glacier of the Svartisen ice cap in northern Norway. It has an area of 40 km2. Most of the area lies between 1200 and 1450 m the high plateau of the ice cap. This glacier has been the focus of attention from the Norwegian Water Resources and Energy Directorate (NVE) for over 50 years.  NVE maintains the most extensive and detailed glacier monitoring network in the world. The NVE annual mass balance measurements on Engabreen indicate that winter snow typically accumulate 3 m of water equivalent on the ice cap. This amounts to 5-7 m of snowpack as the melt season begins in May. The glacier terminus descends from the ice cap down nearly to Engabrevatnet, a lake at 7 m. At the terminus annual melting is 12 m.
The rivers from the northern and eastern side of Svartisen were regulated in the 1990’s for hydro power production by construction of a tunnel system partly underneath the glacier. Today about 60% of the potential runoff of the Engabreen is captured and sent through a bedrock tunnel to the hydropower facility. During completion of this tunnel access to the glacier base was opened. Today there is the world’s only ongoing subglacial laboratory here. The melt water from Engabreen is collected into this tunnel system at 620 m a.s.l. underneath 200 m of glacier ice in the ice fall.
Late in the 18th century Engabrevatnet started to appear as the glacier retreated upvalley.
In 1903 regular length change observations were initiated, a small advance ensued until 1910. By 1931 the glacier retreated 100 meters, and the glacier tongue was thinning. During the next decade calving led to rapid retreat revealing the rest of Engabrevatnet. The retreat ended in 1965, since then has advanced with three different pulses ending in 1971, 1984 and 1999, the last pulse reaching to within a few meters of the lake shore. From 1999-2009 Engabreen has retreated 255 m. Below are pictures from the NVE taken in 2000 and 2008 of Engabreen, note the large contraction of the terminus area. Also note the considerable reduction in crevassing at the terminus, indicating a velocity reduction and that retreat will continue in the near future. 
 The 2009 position is its point of furthest retreat since the Little Ice Age. The recent retreat indicates a recent trend of negative mass balance on the glacier. There is excellent flow off the ice cap that has persistent and consistent snowcover indicating this glacier will survive current climate.
