
This video examines the 2009 North Cascade Glacier Climate Project Field Season. It is a look more at where we work, than what we find. Mass balances were substantial averaging -1.93 m. The winter season was wetter than average, with close to average snowpack in the North Cascades. Summer melt conditions were exceptionally warm, leading to enhanced melting and considerable losses in glacier volume. The mass loss of approximately 2 meters represents about 4% of total glacier volume, gone in one year. In July ablation averaged 8.5 cm per day. For glaciers that average 50-60 m in thickness that is the loss of 2.5 m in one month. Most of the melt was snowpack from the previous winter. However, by mid-August blue ice was exposed on the majority of the glacier surfaces across the North Cascades and any ablation was a loss in long term glacier volume. In the case of Columbia Glacier at the end of August a view of its surface indicates only a few white patches of snow remaining.  Glacier retreat was slowed on Rainbow and Ice Worm glaciers where the terminus was buried under avalanche snow. Retreat of Easton Glacier was 20 m, Lower Curtis Glacier 11m, Daniels Glacier 12 m, Lynch Glacier 8 m. All 42 glacier observed retreated in 2009. Easton Glacier developed a new rock outcrop in the midst of the glacier
 . More details on this project North Cascade Glacier Climate Project
[url=http://www.youtube.com/watch?v=DJGQXlvWXy8]
Category: Glacier Observations
Post detailing changes in a glacier
Honeycomb Glacier Retreat, New Lake Formation
Honeycomb Glacier is one of the longest and largest glaciers in the North Cascades. It is currently 3.7 km long and has an area of 3.1 km2. It has retreated 2.05 kilometers since its Little Ice Age Maximum. The glacier was an imposing site to C.E. Rusk who recounted his early 20th century exploration (1924). Like all 47 glaciers observed by the North Cascade Glacier Climate Project it has retreated significantly since 1979.
A 1960 photograph taken by Austin Post shows the glacier ending with no lake at its terminus. The terminus is gentle and has no crevasses, indicating it is relatively stagnant and poised to melt away. The glacier has retreated 1.3 km from its Little Ice Age moraines at this point. In 1967 another Austin Post image indicates a new small lake forming at the terminus.
 In 1995 we visited the margin of this lake, where the glacier ended in 1967 and took a photograph back to the glacier. As seen below retreat to this point was 400 m.
  A pair of images from Bill Arundell in 1973 and Lowell Skoog in 2006 indicate the scale of the retreat, these images do not show the actual terminus but do show the main nunatak-rock island and how much it has become exposed in the 33 years. This nunatak was hardly evident in 1960, and in a 1940 image of the glacier literally did not yet exist.
 The terminus had retreated 400 m from the 1967 position to 1995. In 1987 a new lake began to form at the terminus of the glacier at 1680 m. The glacier is shown ending in this lake in 2002 from both the far end of the lake and the nunatak above the lake, the glacier had retreated 210 m since 1995. In 2006 the glacier retreated from the end of this lake. This is a shallow lake that may eventually be filled in by glacier sediments. The terminus is flat and stagnant ending at 1680 m in the lake. Thus, the rapid retreat will continue, the glacier is still not close to acheiving a post LIA equilibrium. Glacier retreat from 1940-1967 averaged 9 m/year. Retreat was minor between 1967 and 1979. The retreat rate since 1979 has been greater than 38 m/year, with a total retreat of 700 m. The nunatak in the middle of the glacier, which was beneath the ice in 1940 is now 90 m above the ice. The section of the glacier below the nunatak in 2002 is stagnant with no crevasses.
 Indicating this glacier will retreat at least to the base of this rock knob, which will then no longer be a nunatak. A comparison of Google Earth Imagery from 1998 and 2009 illustrate the appearance of numerous new bedrock knobs in the area where there was an icefall in 1995.

 survive The upper portion of the glacier has retained its snowcover in recent years indicating the glacier can survive current climate at a much smaller size.
Recession of Jakobshavn Isbrae continues
The Jakobshavn Isbrae (glacier) has captured our attention over the last 30 years because it has the highest long term average velocity of any glacier in the world. At the ice front the velocity has remained above 16 meters per day for all measurements completed over the last 50 years. The ability of this glacier which is 10 km wide at its front and 800 m thick at the calving front to drain 6.5 % of the Greenland Ice Sheet is its importance. The annual volume of discharge is 40 cubic kilometers. This prompted the University of Maine’s Terry Hughes to take a close look at the glacier in 1985. I participated in that project and one key conclusion we reached was that the Jakobshavn Isbrae was in approximate equilibrium (Pelto and others, 1989). The terminus had not shifted significantly in the past 30 years and no thinning was evident either. The image below of terminus change The top image above is from Jason Box, Byrd Polar Research Center, Ohio State University, and is a mosaic of Landsat and ASTER images indicates a substantial retreat from 1850-1964 of about 30 km. The first image is from the fall of 2009 and the second a Modis image from June 2010. The third from July 2010,from NASA. The last two in the sequence are Landat 8 imagery from May 9 and June 1, 2014 indicate an early summer retreat that was first noticed by the ongoing sharp observations of Espen Olsen. The retreat follows the typical winter advance, and is not back to the 2013 furthest retreat also identified by Espen Olsen. Notes on these latest images below the sequence.
From 1964 to 2001 the glacier terminus did not recede significantly and observations of terminus velocity remained relatively constant at 16 to 20 m year at the glacier front. Then in 1997 an acceleration began. The velocity reached 34 m per day by 2003, twice its normal speed, the glacier thinned by up to 15 m year and retreated 10 km, from 2001 to 2003. From 2004-2007 an additional retreat of 5 km occurred.


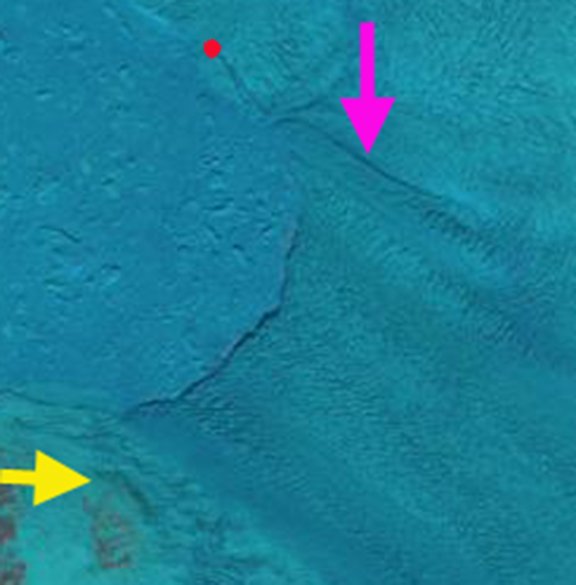
[caption id="attachment_7425" align="aligncenter" width="480"] Pink arrow indicates a prominent lateral rift. Yellow arrow reference location. Red dot an existing transverse rift.
The pink arrow notes a prominent lateral rift, the yellow arrow a reference point. Red dot is a transverse rift near the ice front. No large rifts are apparent in the area of the main calving on May 9.[/caption] A bedrock high beneath the glacier is reflected by the sudden increase in slope below point A. What is fascinating is the speed at which the glacier surface below A at Point C was transformed from an ordinary set of transverse crevasses to the chaotic scene typically indicative of an area of rapid acceleration and failure of seracs, those walls betweens crevasses. The glacier has had a profound response to the rifting-calving retreat of the previous day. The area of crevasse transformation is an indication of the connection of this area of the glacier to action at the terminus, the crevassed areas response was so swift that it was effectively involved in the calving retreat incident. The area around C is a zone of weakness to watch for further appearance of rifting. The area in front of the bedrock high is clearly not a place for the terminus to stabilize. The bedrock high itself could well be a point of greater stability for the terminus. Upglacier 2010 is not a good year for the glacier either the snowline is high for June exposing larger areas of bare glacier ice with higher albedo for melting, see image at bottom.
On Jakobshavn the acceleration began at the calving front and spread up-glacier 20 km in 1997 and up to 55 km inland by 2003 (Joughin et al., 2004). Luckman et. al., (2006) observed…“The most plausible sequence of events is that the thinning eventually reached a threshold, ungrounded the glacier tongues and subsequently allowed acceleration, retreat and further thinning. It is reasonable to believe that the 1998 Jakobshavn speed-up, also following a long period of stability, was triggered by the same processes of thinning but occurred earlier and after a shorter period of thinning because the tongue was already afloat.”
On Jakobshavn the acceleration was not restricted to the summer, persisting through the winter when surface meltwater is absent. This indicates that it is the change in conditions at the calving front where the backforce on the glacier was reduced that allowed acceleration and retreat. This is typical for Greenland marine terminating outlet glaciers, they have accelerated most at the calving front and the acceleration is not seasonal. The acceleration is not significantly due to meltwater enhanced lubrication. Below is the acceleration of the last decade compared to before, illustrating that the greatest acceleration is at the calving front (Thomas et al., 2009). 
The Jakobshavn is of particular importance as it has a bed below sea level for at least 80 km inland from the terminus. In this reach there are no significant pinning points, or abrupt changes in slope or width (Clarke and Echelmeyer, 1996) that would help stabilize the glacier during retreat. In particular the bed becomes deeper from 24-40 km behind the calving front, which should reinforce calving acceleration (Thomas et al., 2009).  Images of Jakobshavn Isbrae in 2001 indicate substantial rifts on the north side of the glacier near the 2005 terminus position, suggesting the glacier had been preconditioned for retreat. In the image below from June 17, 2010 the snowline is evident on the north side of Jakobshavn as the transition to the much lighter blue tone, in this Landsat image. The red line is the June 2009 snowline and the green line the 2008 June snowline.
A comparison of April 2010 (top image below) and April 2011 Landsat image (middle image) indicates a somewhat lower snowline on the Jakboshavn in 2011. The zoomed in version indicates the amount o the ice that is actually icebergs. 


