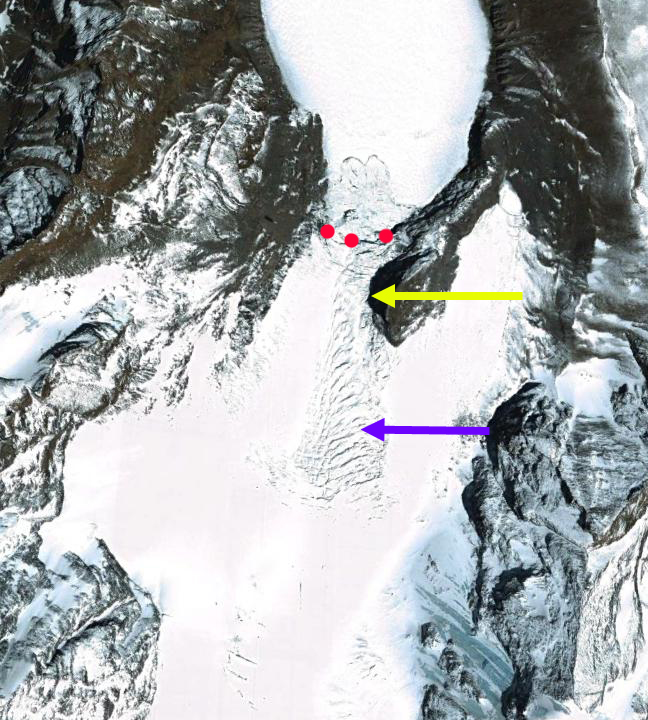
Satopanth and Bhagirath Kharak Glacier snowline (blue dots) on Oct. 8, 2020 (Sentinel image) mean elevation is 5350 m. T=Terminus location and blue line is flowline with distance from terminus in km.
Satopanth and Bhagirath Kharak Glacier are located at the headwaters of the Alaknanda River, Uttarakhand, India and have until recently shared a terminus. Glacier runoff is an important contribution to the 400 MW Vishnuprayag and 330 MW Alaknanda Hydroproject. Recent glacier behavior summarized by Thapliyal et al (2023)indicates retreat rates For Satopanth of 23.5 m/year and for Bhagirath Kharak of 18.5 m/year from 1968-2017. They also report a reduction of snowcover during a period of warming from 2000-2020. They considered the accumulation zone to be from 4500 m to 5600 m. Here we examine Sentinel images from Oct. 8, 2020 and Oct. 8 2023 indicating the snowline at 5350 m and 5250 m respectively. On Satopanth Glacier the glacier is 14 km long with ~87% of that length in the ablation zone both years. On Bhagirath Kharak Glacier the glacier is 16.5 km long with ~90% of its length in the ablation zone both years. A glacier needs more than 50% of its area to be in the accumulation zone, which means a snowline in the 4600 m range. The higher snowlines in recent years will drive an increased glacier loss. Below 4600 m debris cover dominates. Shah et al (2019) estimated mean sub-debris ablation ranges between 1.5±0.2 to 1.7±0.3 cm/day leading to thinning of this zone of the glacier.
Screenshot
Satopanth and Bhagirath Kharak Glacier snowline (blue dots) on Oct. 8, 2023 (Sentinel image- mean elevation is 5250 m. T=Terminus location. 90% of the length of each glacier is in the ablation zone.
Screenshot
Vishnuprayag Hydropower Plant a 400 MW run of river project 18 km downstream of Satopanth Glacier.
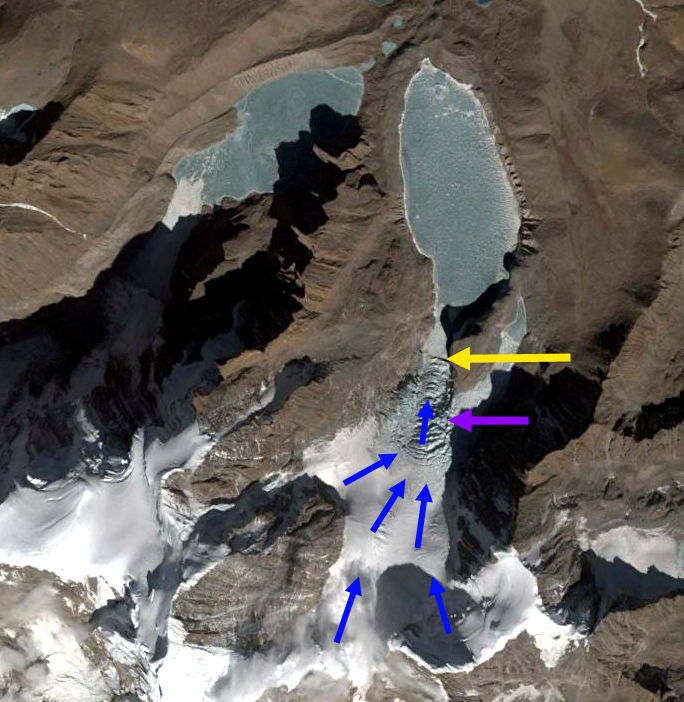
Suru Basin glaciers in 1998 and 2022 Landsat images. Red arrow marks the 1998 terminus location, yellow arrow the 2022 terminus location. S=Shafat Glacier, D=Dilung Glacier. Glacier 1-4 are unnamed glaciers that lost almost all snowcover in 2022.
Glaciers of the Suru Basin, draining the Ladakh Range, a drier region of the Himalaya, was significantly by the 2022 pre-monsoon and monsoon season warmth. Here we focus on a group of glaciers near Shafat and Dilung Glacier that lost snowcover in 2022. We also look at the retreat of Shafat and Dilung Glacier. Shafat Glacier occupies the northeast flank of Nun Kun Peak in Ladakh India and drains into the Suru valley. The main valley glacier has suffered from detached tributaries leading to terminus area stagnation (Pelto, 2021). Dilung Glacier retreat has led to an expanding proglacial lake. Shukla et al (2020) identified an increase in annual temperature has driven a 6% loss in regional glacier area and a 62% expansion in debris cover from 1971-2017. Here we compare Landsat imagery from 1998-2022 to identify this glaciers response to climate change.
In 1998 the terminus of Shafat Glacier was at the red arrow near a junction with a key tributary, with clean active ice reaching to the terminus. By 2022 the active ice is 2.5 km upglacier from this point at the yellow arrow, though there is stagnant debris covered ice below this point. Dilung Glacier in 1998 terminates in a 1.1 km long proglacial lake. By 2022 the glacier has retreated 900 m, resulting in a 2.0 km long lake. Rashid and Majeed (2018) indicate nearby Drang Drung Glacier has retreated 925 m since 1971, with a sharp increase after 2014.
For an alpine glacier to have a balanced annual budget it has to be 50-60 snowcovered at the end of the melt season. On Sept. 1, 2022 there are four glaciers 1-4 in this region that have 0-10% snowcover left. The snowcover is above 5300 m. This is illustrative of significant mass losses in 2022. On Dilung Glacier and Shafat Glacier the snowcover is ~20% and is confined to the regions above 5300 m. There is some cloudcover over the top of the Shafat Glacier in the 9-1-2022 Landsat image.
Suru Basin glaciers in September 1, 2022 Landsat image. Glacier 1-4 are unnamed glaciers that lost almost all snowcover in 2022. S=Shafat Glacier, D=Dilung Glacier. The snowline is above 5300 m.
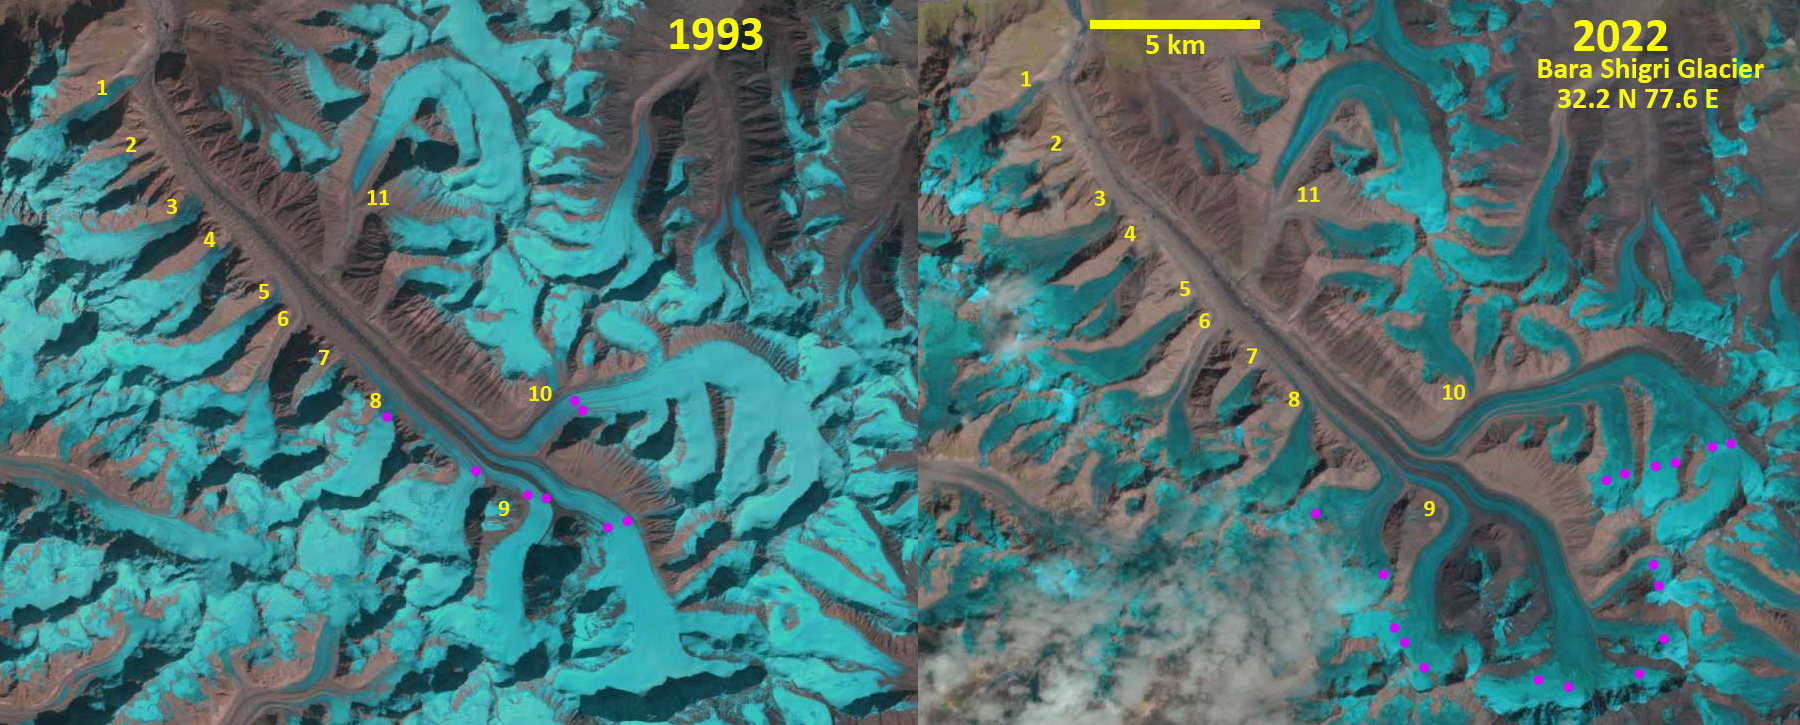
Bara Shigri Glacier in 1993 and 2022 Landsat images indicating the separation of a number of tributaries. Purple dots mark the snowline 1993=5050 m and 2022=5600 m.
Bara Shigri Glacier, India is in Chandra Valley of the Western Himalaya. Chand et al (2017) report on the behavior of the glacier from the Little Ice Age to 2014 noting a retreat of 255 m from 1992-2002 and 168 m from 2002-2014. This 26 km long glacier had an average snowline maximum elevation of 5340 m for the 2000-2014 period. The glacier has been fed by a number of significant tributaries feeding from the southwest, here labeled 1-9. The snowline has risen above 5400 m with increasing frequency resulting in a limited accumulation area as observed in Landsat images from 2002, 2016, 2020 and 2022.
In 1993 tributary 1, 3, 4, 5, 6, 8 and 9 feed the main stem, while tributary 2 does not reach the main stem and tributary 7 just meets it without apparent contribution. In 2002 the same tributaries continue to contribute ice to the main stem as in 1993. The snowline is much higher at 5400 m. In 2022 tributaries 1, 4 and 5 no longer contribute to the mainstem of the glacier, leaving Only tributaries 3, 6, 8 and 9 connecting. The snowline in 2020 averaged 5600 m as well, with higher snow levels on the southwest tributaries and a lower snowline on the northeast arm of the glacier.
The detachment of tributaries illustrates mass balance loss of these glaciers and consequence decrease in volume flux into Bara Shigri Glacier which will lead to continued retreat. Patel et al (2021) noted a mass loss rate of -0.59 m w.e. per year from 2013-2019 indicating the basin wide nature of mass loss. This mass loss is also leading to retreat of nearby Samudra Tapu Glacier.
Bara Shigri Glacier in 2002 Landsat image indicating the separation of a number of tributaries. Purple dots mark the snowline 1993=5050 m and 2022=5400 m.
Bara Shigri Glacier in 2020 Landsat image indicating the separation of a number of tributaries. Purple dots mark the snowline 1993=5050 m and 2022=5600 m.
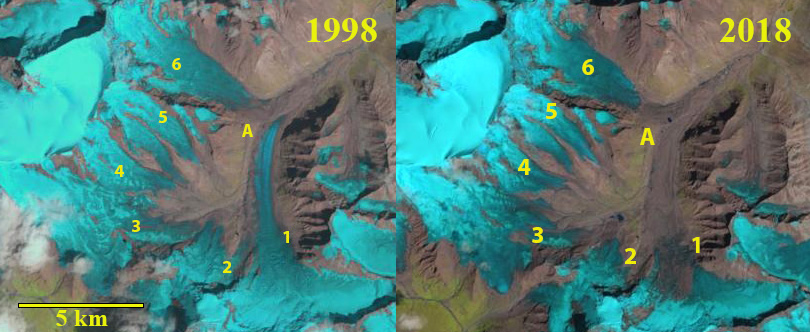
Shafat Glacier in 1997 and 2020 Landsat images. 1-6 are different tributaries with the main glacier being #1. A marks the junction of #1 and #6.
Shafat Glacier occupies the northeast flank of Nun Kun Peak in Ladakh India and drains into the Suru valley. The main valley glacier (1) has been fed by a decreasing number of tributaries. Shukla et al (2020) identified an increase in annual temperature has driven a 6% loss in regional glacier area and a 62% expansion in debris cover from 1971-2017. Here we compare Landsat imagery from 1997-2020 to identify this glaciers response to climate change.
In 1997 and 1998 tributary 2 and 3 join and then the debris covered sections connects to the main valley glacier #1. Tributary 4 terminus is the meeting point of two glacier tongues. The active non-debris covered ice of Tributary #6 reaches to the valley adjacent to Point A where it meets the main valley tongue. The active clean ice of the main tongue extends beyond Point A. In 1997-2000 the terminus is heavily debris covered with the main discharge from beneath the glacier at Point B. The active ice of Tributary 6 extends to within 1.5 km of the terminus, while the active/clean ice of the main tongue extends to within 1.3 km of the terminus. The snowline is at 4900 m in 1997 and 5100 m in 1998. By 2018-2020 the active ice area now ends 2.5 km from the terminus for Tributary 6 and 5.1 km from the terminus for the main glacier. Debris cover extends 5.3 km from the terminus up the main tongue and 2.7 km from terminus at Point B up Tributary 6. Retreat is hard to discern with the extensive stagnant debris covered area. Tributary 4 has separated into two parts, and tributary 2 and 3 have separated from each other and the main valley glacier. In 2018 the snowline is at 5200 m, while in 2020 it is 5050 m. The consistent high snowlines have led to glacier thinning, debris cover expansion, and increasing stagnation of the main glacier tongue. The stagnation is indicated by the increasingly concave cross profile and the lack of crevassing in the lower 5 km of the main glacier tongue below 4600 m. The low slope of the glacier from 4250-4400 m, of 4.8% suggests a proglacial lake could form in this reach of the main valley.
The glacier volume loss is more substantial than the area loss, with retreat less than on Kolahoi Glacier, but volume loss similar (Rashid et al 2019). Loss of glacier area leads to summer glacier runoff declines, which impacts irrigation Rashid et al 2019). The Suru River also has a 44 MW run of river Chutak Hydropower plant.
Shafat Glacier in 1998 and 2018 Landsat images. 1-6 are different tributaries with the main glacier being #1. A marks the junction of #1 and #6.
Digital Globe image of the terminus reach in 2000 and 2019. B marks the location of main river exiting from beneath the glacier. A marks the junction of the two glaciers. 1 and 6 indicate the two main glaciers that join 2 km above the Shafat Glacier terminus. Note debris cover spread particularly on main tongue.
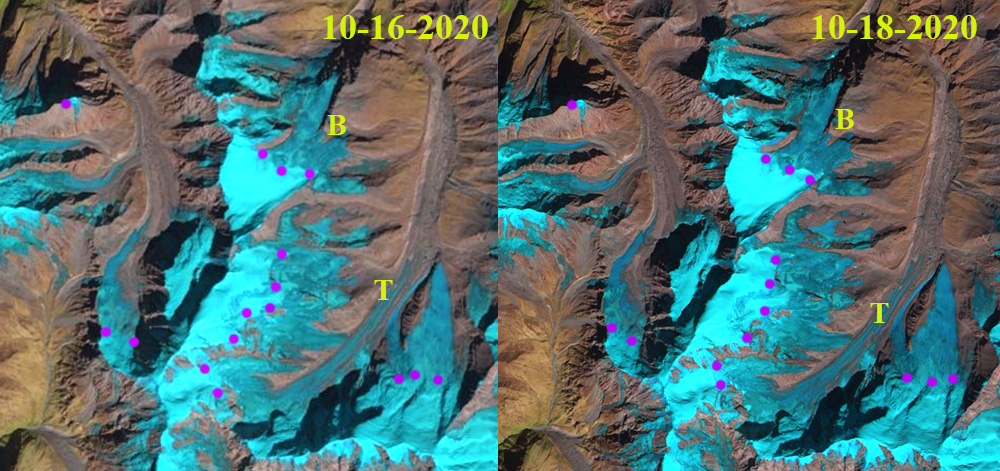
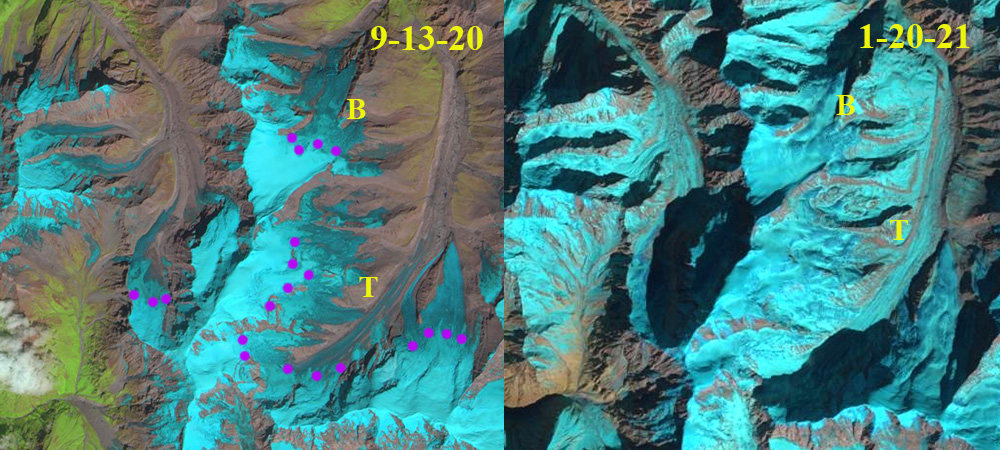
Snowline elevation on Trisul (T) and Bethartoli Glacier (B) in a 10-26-2020 Landsat and 10-18-2020 Sentinel image. The snowline ranges from 5800-6000 m, purple dots.
The catastrophic landslide and resulting flood in the Rishi Ganga basin Uttarakhand, India on Feb. 7 was triggered on a formerly glaciated slope at 5600 m detailed in a blog post by Petley (2021). This event occurred after a post-monsoon season featuring high snowlines on adjacent glaciers and the warmest January in the last six decades in Uttarakhand, India. Glacier snowlines are a proxy for the elevation where melting predominates. Were these preconditioning factors? Here we examine the elevation of the glacier snowlines in 2020.
The headwaters of the Rishi Ganga Basin, India feature a number of large glaciers draining the slope of Nanda Devi, Trisul and other high Himalayan peaks. The response of glaciers of the Rishi Ganga basin to climate change was examined by Kumar et al, (2020). They found a 10% reduction in glacier area from 1980-2017. They further observed the ELA to fluctuate from 5200-5700 m.
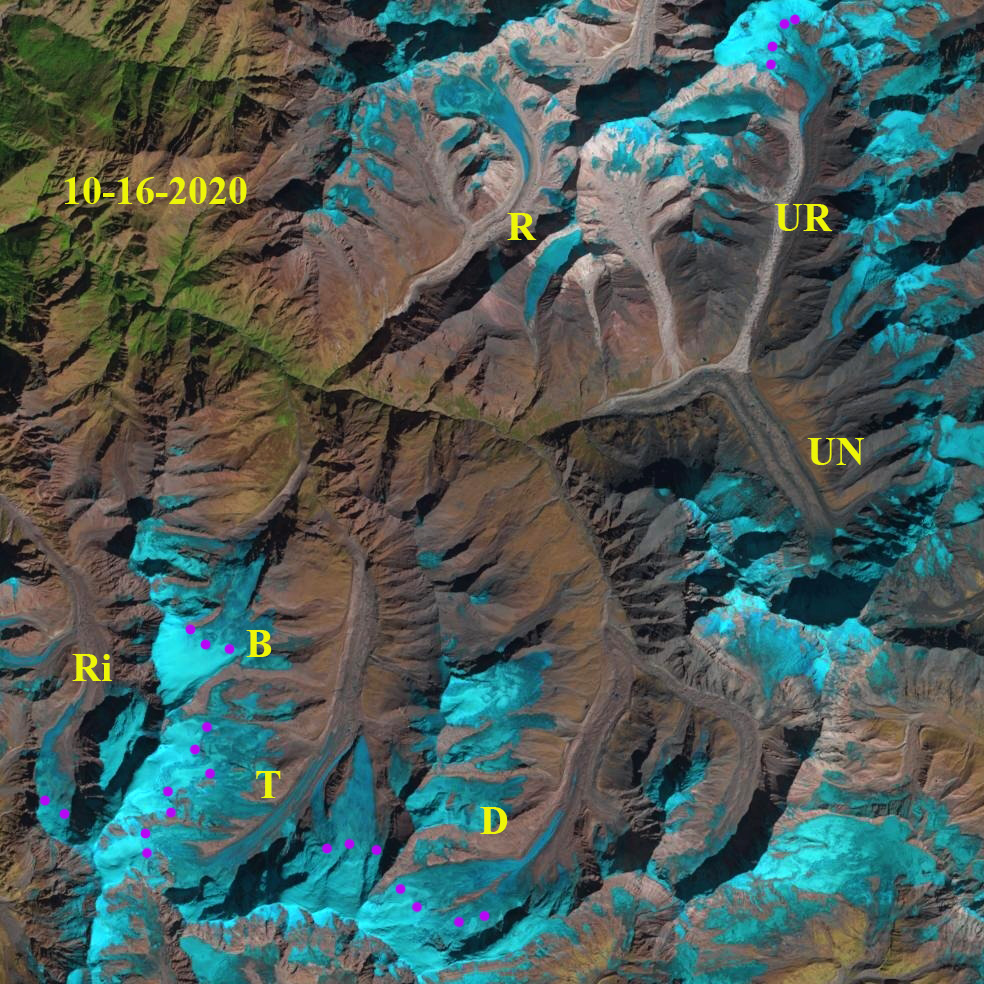
Nanda Devi region glaciers in 10-16-2020 image indicating the snowline at between 5800 and 6000 m on all the glaciers in the upper Rishi Ganga: Bethartoli (B), Dakshini (D), Ramani (R), Rinti (Ri), Trisul (T), Uttar Nanda Devi (UN), Uttar Rishi (UR).
In 2020 at the end of the summer monsoon the snowline on glaciers in the Rishi Ganga Basin were high at 5600-5700 m on Sept.13 as noted in particular on Trisul (T), Rinti (Ri), Ramani (R), Uttar Rishi (UR), Uttar Nanda Devi (UN), Dakshini (D) and Bethartoli Glacier (B) and an Rinti Glacier to the west that the landslide debris ended falling below. By mid October the snowline on the glaciers had risen to ~5800-6000 m on these seven glaciers in Landsat and Sentinel imagery. On Ramani Glacier there is no retained snowpack with the top elevation of the glacier at 5800 m. The amount of dark blue bare ice is striking. The snowline indicates an elevation that the freezing level during that year frequently rose above. This indicates the freezing line rose above the trigger elevation site ~5600 m frequently enough in 2020 that melting exceeded snowfall. This is higher than Kumar et al (2020) had observed during the recent period of increased glacier snow lines. By January 11, 2021 the area was blanketed by snow down to 4400 m, the subsequent warm period led to widespread melting and snow cover loss up to at least 5000 m on Trisul Glacier and Uttar Rishi Glacier. The freezing line and glacier snowline elevations in the post monsoon period are similar to near Mount Everest, where the January warmth led to even greater high elevation melt (NASA, 2021).
Whether the unusually high elevation melting and freezing levels observed on glaciers in the region in 2020 were pre-conditioning cannot be answered with analysis such as this, but it does demonstrate the the elevation range of landslide initiation was below the observed glacier snow lines in 2020 and in an elevation zone that experienced unusual melt conditions in 2020. The increased freezing levels in the region over the last several decades were documented for the Mount Everest area by Perry et al (2020),indicative of a long term trend.
Snowline elevation on Trisul (T) and Bethartoli Glacier (B) in a 9-13-2020 Landsat and 1-20-2021 Sentinel image. The snowline ranges from 5600-5700 m in September.
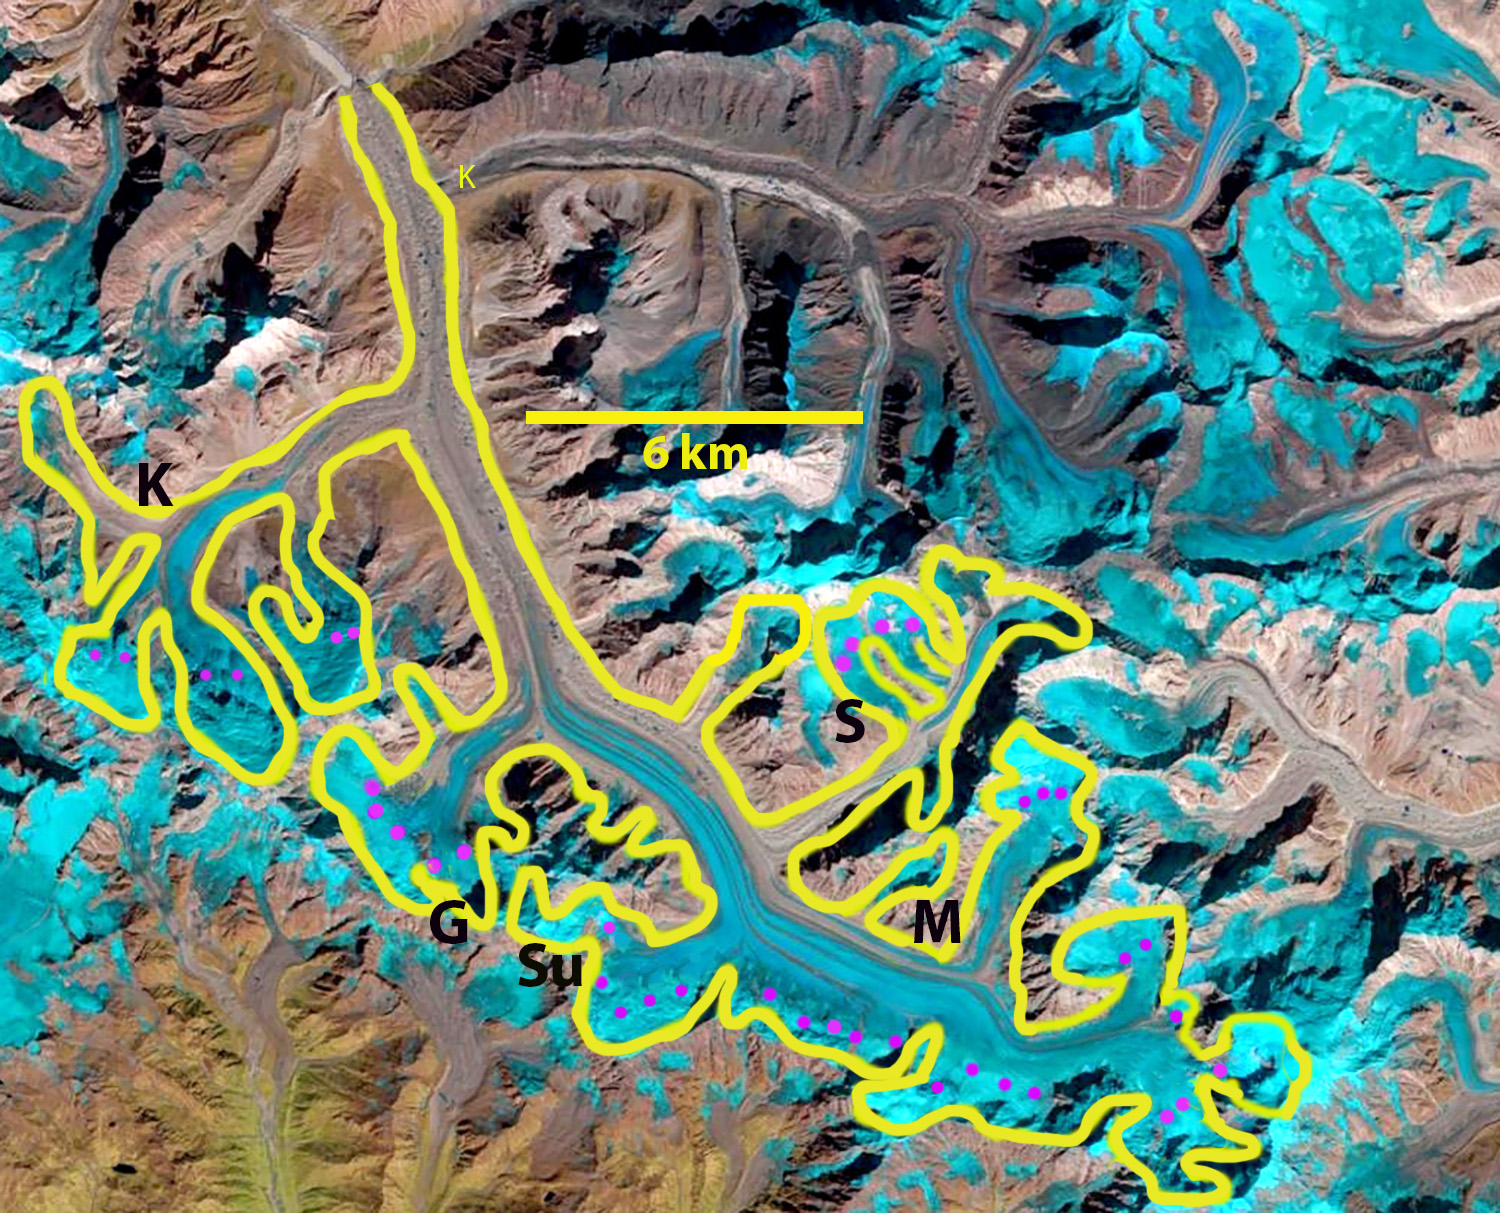
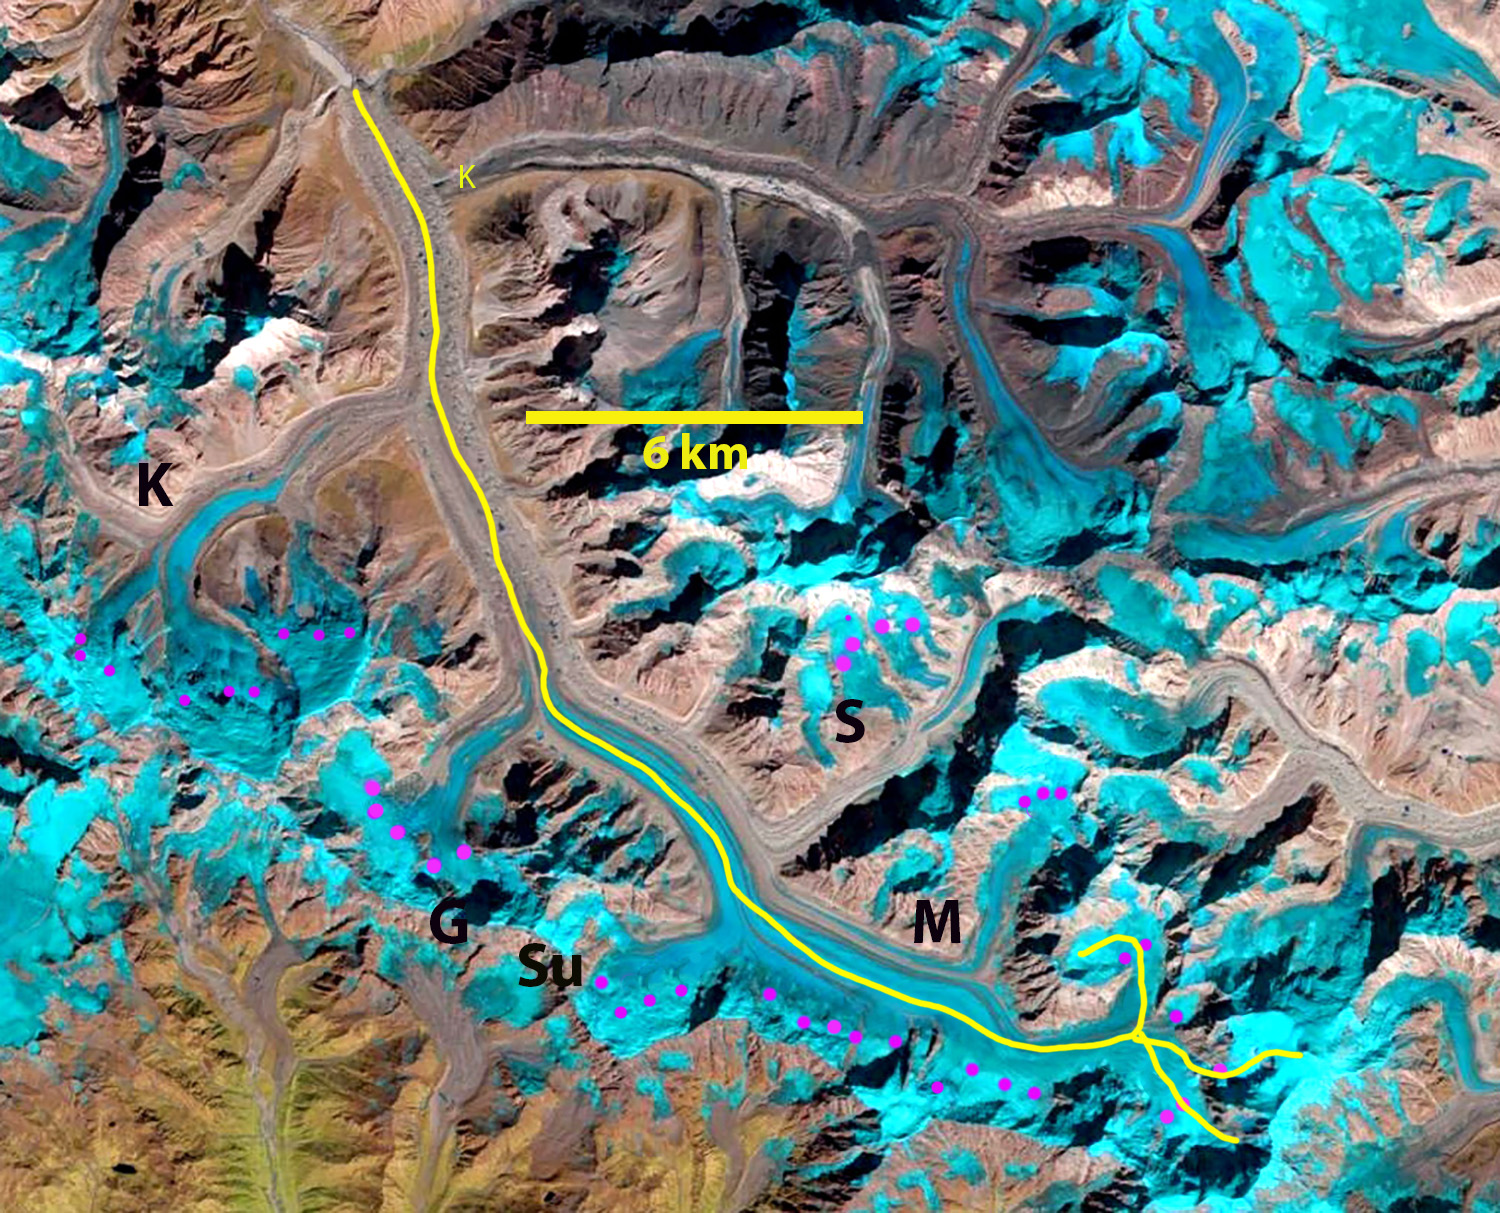
Gangotri Glacier snowline averaging 5600 m on Oct. 16, 2020 in Landsat image, magenta dots indicate the snowline. Yellow line is the Randolph Glacier Inventory margin. Tributaries: K=Kirti; G=Ghanohim, Su=Sumeru, M=Maiandi, S=Swachhand.
Gangotri Glacier, India is in the Bhagirathi River watershed and is the largest glacier in the Garhwal Range of the Himalaya. Gangotri Glacier supports hydropower as its meltwater runoff passes through three hydropower plants generating 1430 Megawatts including the Tehri Dam, Maneri Bhali I and II. From 1968-2006 the glacier retreated 800 meters, ~20 meters/year (Bhambri et al 2011). The glacier has continued to thin and tributary inflow has declined with a tributary (Chaturangi) separating during this period . Bhambri et al (2011) noted that recession rates have in the region have increased since 1990. Bhattachaya et al (2016) expanded on this work noting that the velocity of Gangotri Glacier declined during 2006-2014 by 6.7% from 1993-2006, indicating a reduced volume of accumulation flowing downglacier. They also noted an increase in the rate of debris-covered area expansion on the main trunk of Gangotri Glacier from 2006-2015, indicative of an expanding ablation zone. Bhattachaya et al (2016) report a retreat rate of 9 m/year 2006-2015, which is less than before, but the down-wasting in the same period 2006-2015 was higher than during 1968-2006.
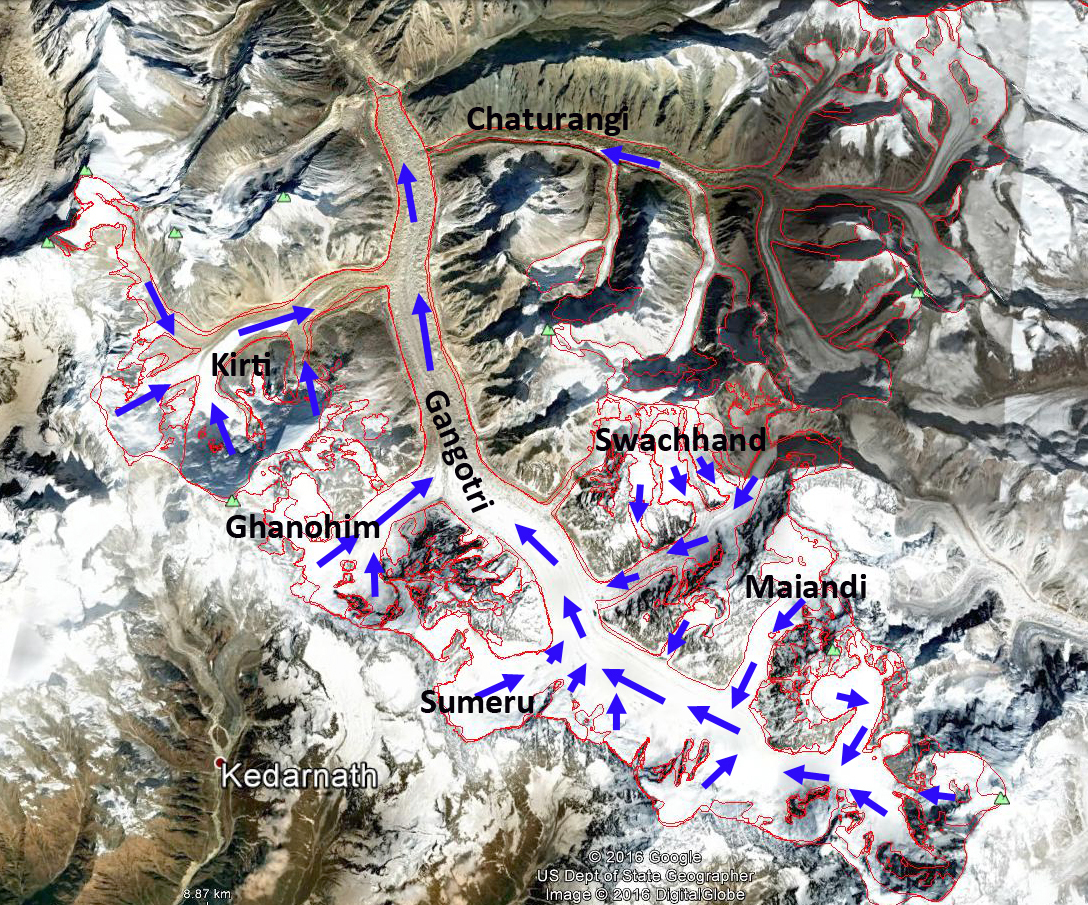
Gangotri Glacier boundary and flow directions on Digital Globe image with GLIMS glacier outline indicated.
Gangotri Glacier is a summer accumulation glacier with the peak ablation period low on the glacier coinciding with peak snowfall high on the glacier during the summer monsoon. In the post monsoon period of October and November precipitation is low and melt rates decline. Kundu et al (2015) noted that from Sept. 2012 to January 2013 the snowline elevation varied from 5080 m to 5174 m . This contrasts to an ELA of 4875 m reported by (Bhattachaya et al 2016) and 5100 m (Bhushan et al 2017).
On October 9, 2016 the snowline was at 4850 m on the main trunk and on the tributary Ghanohim Glacier, and 4750 m on the tributary Kirti Glacier. By November 30th a Landsat image indicates the snowline has risen to 5400 m on the main trunk and Ghanohim, the snowline is at 5800-5900 m on the glaciers in the Swachhand tributary valley, at 5600 m on Maiandi Glacier and 5700 m on the last tributary entering from the north. A Landsat image from Dec. 9th indicate that the snowline remains approximately the same as on Nov. 30th. The substantial post monsoon snowline rise in 2016 is illustrated in this article on Gangotri Glacier.
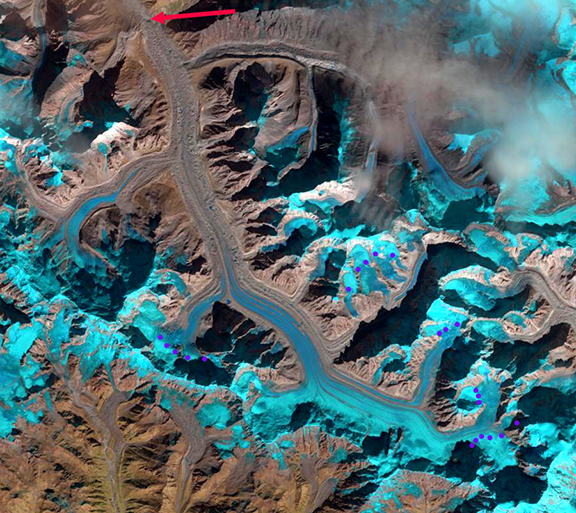
Gangotri Glacier snowline purple dots in Landsat 11-30-16 image, red arrow is terminus.
On October 16, 2020 a warm/dry post monsoon season has led to the snowline rising rapidly on Gangorti Glacier. On Kirti the snowline is at 5500 m, on Ghanohim at 5400 m, on Sumeru at 5500 m, on the main stem 5600-5700 m, on Maiandi at 5700 m and on Swachhand at 5800 m. The snowline is averages 5600 m the same as in 2016. Below the snowline there is limited older firn exposed, indicating that limited snow is retained below 5400 m on Gangotri Glacier from year to year. The bare glacier ice has a lower albedo then snow increasing melt and further reducing glacier mass balance.
The accumulation area ratio is the percentage of a glacier in the accumulation zone and is typically above 50% for a glacier in equilibrium. On Gangotri Glacier in November 30, 2016 the accumulation area ratio was 20-24%, indicating a large mass balance deficit. On October 16, 2020 the AAR of Gangotri Glacier was 23%. More important the firn line indicates that the AAR is now consistently at ~25%. This will drive continued retreat and will accelerate the retreat. How far upglacier on Gangotri Glacier do you have to travel to reach the snowline? On the central flow line 29-30 km along the 31-33 km length. The increase in temperature has led to a tendency for snowlines to rise in the post monsoon period and remain high into the winter season on other Himalayan glaciers such as West Rongbuk Glacier and around Mount Everest in 2019.
Central flowline for Gangotri Glacier, 32 km long, with 29.5 km in the ablation zone. Landsat image from 10-26-2020.
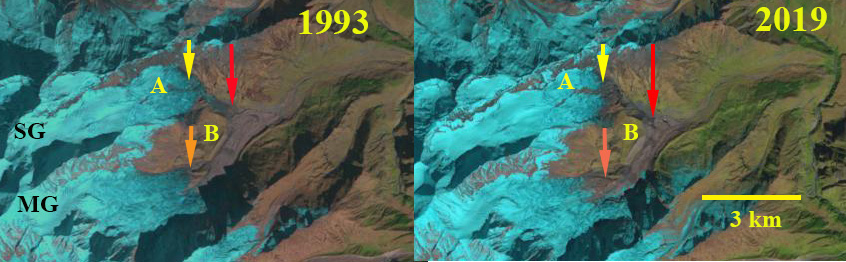
Sona Glacier (SG) and Meola Glacier (MG) in 1993 and 2019 Landsat images. Red arrow indicates 1993 terminus location of Sona Glacier and Yellow arrow the 2019 terminus location. The orange arrow marks the 1993 downglacier limit of clean ice, below is debris covered ice. Point A marks a small expanding rock outcrop amidst glacier. Point B marks north lateral moraine exposure of Meola Glacier.
The Dhauliganga River is in the Uttarakhand District, India and is fed by a significant number of large glaciers. The glacier runoff is a significant contributor to streamflow for the Dhauliganga Power Station 280 MW run of river hydropower. The reservoir is only 1 km long. Sattar et al (2019) examined glacier volume and velocity of 15 large glaciers in the basin and found a 6.9% loss in area from 1968-2016. The velocity tends to be highest in the upper ablation zone and declines toward the debris covered terminus regions. Here we utilize Landsat imagery from 1993-2019 to focus on two glaciers Sona and Meola Glacier that were previously joined in Survey of India map (NH-44-06).
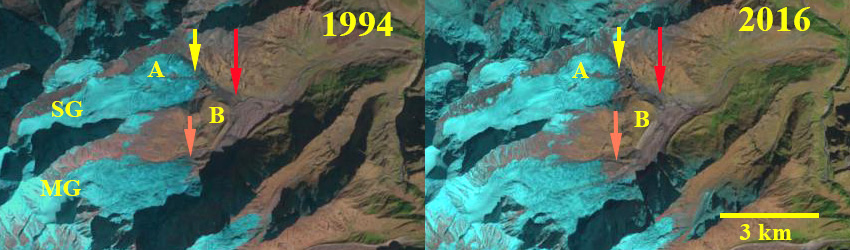
In the map below Sona Glacier and Meola Glacier are joined near Point B. In 1993 and 1994 Sona Glacier descends a steep slope terminating at the red arrow a short distance from Meola Glacier. At Point A the rock outcrop is minor. At Point B the lateral moraine slope above the glacier surface is limited. By 2016 Sona Glacier has retreated to the top of the steep slope. The orange arrow indicates clean ice on Meola Glacier has retreated upwards. By 2019 Point A has expanded and is now a ridge separating the glacier into two terminus tongues. Sona Glacier has retreated 1200 m from 1993-2019. The retreat was enhanced by the steep slope that the thin terminus descended in 1993. At Point B the lateral moraine slope above the glacier surface is notably larger indicating Meola Glacier thinning. The debris cover/clean ice transition on Meola Glacier has moved 600 m upglacier.
Sona Glacier (SG) and Meola Glacier (MG) in 1994 and 2016 Landsat images. Red arrow indicates 1993 terminus location of Sona Glacier and Yellow arrow the 2019 terminus location. The orange arrow marks the 1993 downglacier limit of clean ice, below is debris covered ice. Point A marks a small expanding rock outcrop amidst glacier. Point B marks north lateral moraine exposure of Meola Glacier.
Map indicating Sona Glacier (SG) and Meola Glacier (MG) draining into the Dhauliganga.
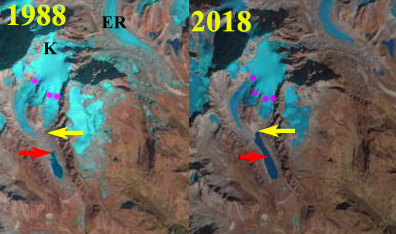
Kokthang Glacier in 1988 and Feb. 2018 Landsat imagery. The red arrow indicates the 1988 terminus and the yellow arrow the upstream end of the lake beyond which the glacier has retreated in 2018. The purple dots indicate the snowline.
Kokthang Glacier drains south from the Kokthang Peak a satellite peak on the south side of the Kanchenjunga Massif, Sikkim in India, the next valley south of East Rathong Glacier. This glacier drains into the Rangit River, which hosts a 60 MW run of river Rangit Hydropower project. Here we examine changes in the glacier from 1988 to 2018. Glaciers draining east from Kanchenjunga have generally experienced substantial retreat and lake expansion (Govindha Raj et al 2013): Lhonak Glacier, Changsang Glacier etc. The exception being Zemu Glacier which has been thinning, but not retreating substantially. NASA Earth Observatory posted an article based on this blog post.
In 1988 the debris covered terminus was in a 800 m long proglacial lake, after the two main tributaries joined. The snowline was at 5500 m. In 2000 the lake has expanded significantly and only the western tributary is actively reaching the lake. The snowline in 2000 is at 5400 m. By 2005 glacier retreat of the stagnant tongue had led to a lake expansion to a length of 1300 m, Google Earth image on left below. The snowline in 2005 is at 5500 m. The eastern tributary no longer descended to the lake. By 2017 the lake had further expanded to a length of 1600 m. The glacier retreat over the 30 year period being greater than the 800 m that represent a doubling of the proglacial lake size. The glacier has now effectively retreated from the lake and only minor expansion will occur with ice cored moraine meltout. The snowline in October 2017 was at 5600 m. The snowline remained high from October to mid-winter as it had in most recent years, with the February 2018 snowline at 5600 m still. This illustrates that ablation albeit, at a slow rate, is occurring from October-mid winter.
The persistent high snowline through much of the year leads to continued thinning and retreat of the lower glacier. The high snowlines have been seen in the Mount Everest area and on Gangotri Glacier. The upper glacier continues to retain snowcover indicating the glacier can survive current climate.
Kokthang Glacier in 2000 and 2017 Landsat imagery. The red arrow indicates the 1988 terminus and the yellow arrow the upstream end of the lake beyond which the glacier has retreated in 2018. The purple dots indicate the snowline.
Google Earth imagery from 2005 and 2014 of Kokthang Glacier.
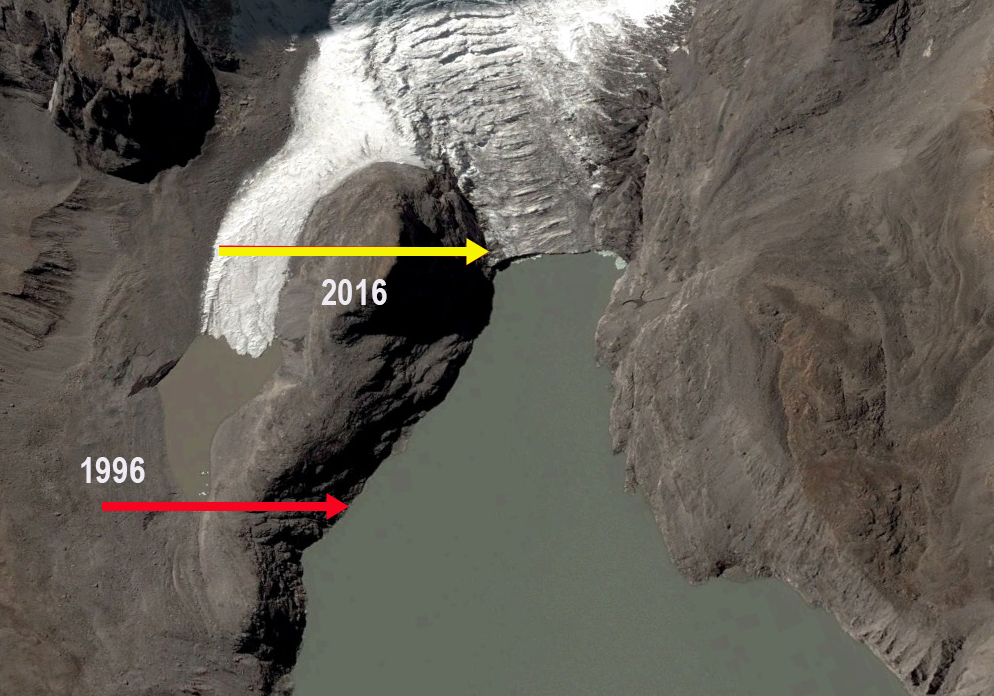
Gurudongmar Glacier draining ton Gurudongmar Lake B in Landsat images from 1996 and 1998 and Sentinel image from 2016.Red arrow is the 1996 terminus and yellow arrow the 2016 terminus.Point M indicates a terminal moraine belt, impounding the lake
Teesta Urja Limited is this month finishing the 1200 MW Teesta Stage III hydro power project on. The project is a run of the river scheme in the North Sikkim district. The dam is at the Chugthang Village just below the confluence of the Lachen River and Lachung River and the power house is 15 km downstream at Singhik. The project utilizes the fall of head in the River course, of about 800 meters between these two villages. This project is a part of overall development of Teesta basin being undertaken by Sikkim Government. The project is run of the river designed to generate 5,214 Million kWh (units) annually in 90 per cent dependable year, as per the information provided. This project adds to the existing hydropower on the Teesta River, such as the 510 MW Teesta V, also highly dependent on glacier runoff. The area of lake “B” in the Gurudongmar Cho Complex has increased nearly 4 times between 1965 and 1989. The significant increase in the areas of lakes “B” and adjacent “C” is a clear indicator of the glacier retreat/melt. Between 1989 and 2010, Gurudongmar Cho “B” has grown by one-sixth of its size in 1989 (Kumar and Prabhu, 2012). An inventory of Sikkim glacier lakes shows the existence of 320 glacial lakes, 85 are new ones in the study area compared to 2003 inventory, due to the ongoing retreat (Govindha Raj et al, 2012).
Like all glaciers in this region Gurudongmar Glacier is a summer accumulation type glacier. This means that the glacier receives most ~80% of its snowfall during the summer monsoon. This is also the period when ablation low on the glacier is highest. Following the summer monsoon which ends in early September there is a transition period with some colder storm events where the snowline drops. Than from November-February is the dry winter monsoon with limited precipitation. Thus, strange compared to most glaciers as winter proceeds often the lower glacier remains snow free. Here we examine 1996 to 2016 Landsat and Sentinel images to identify change. In 1996 the glacier terminates in the lake, just where the lake narrows significantly. In 1998 the terminus remains at the same location, the shading better identifies the calving front. Point M is the wide and stable moraine belt that impounds the lake. This suggests a limited GLOF risk. By 2016 the terminus has retreated 600 m since 1987 through a narrow lake extension. The glacier terminus based on the icefall that almost reaches the terminus, is nearing the upglacier end of the lake. This should lead to a reduction in the retreat rate. The retreat distance is substantial given the length of the glacier is 25% of the 1996 glacier length of 2.4 km. The retreat of this glacier is similar to that of other glaciers in the basin such as Middle Lhonak Glacier, South Lhonak Glacier and Changsang Glacier.
Google Earth image of Gurudongmar Glacier, indicating terminus location. Note icefall almost reaching shore.
Google Earth image from 2004 indicating s, terminus position in 2014 yellow arrow and icefall purple arrow.
Google Earth image from 2014 indicating glacier flow blue arrows, terminus position yellow arrow and icefall purple arrow.