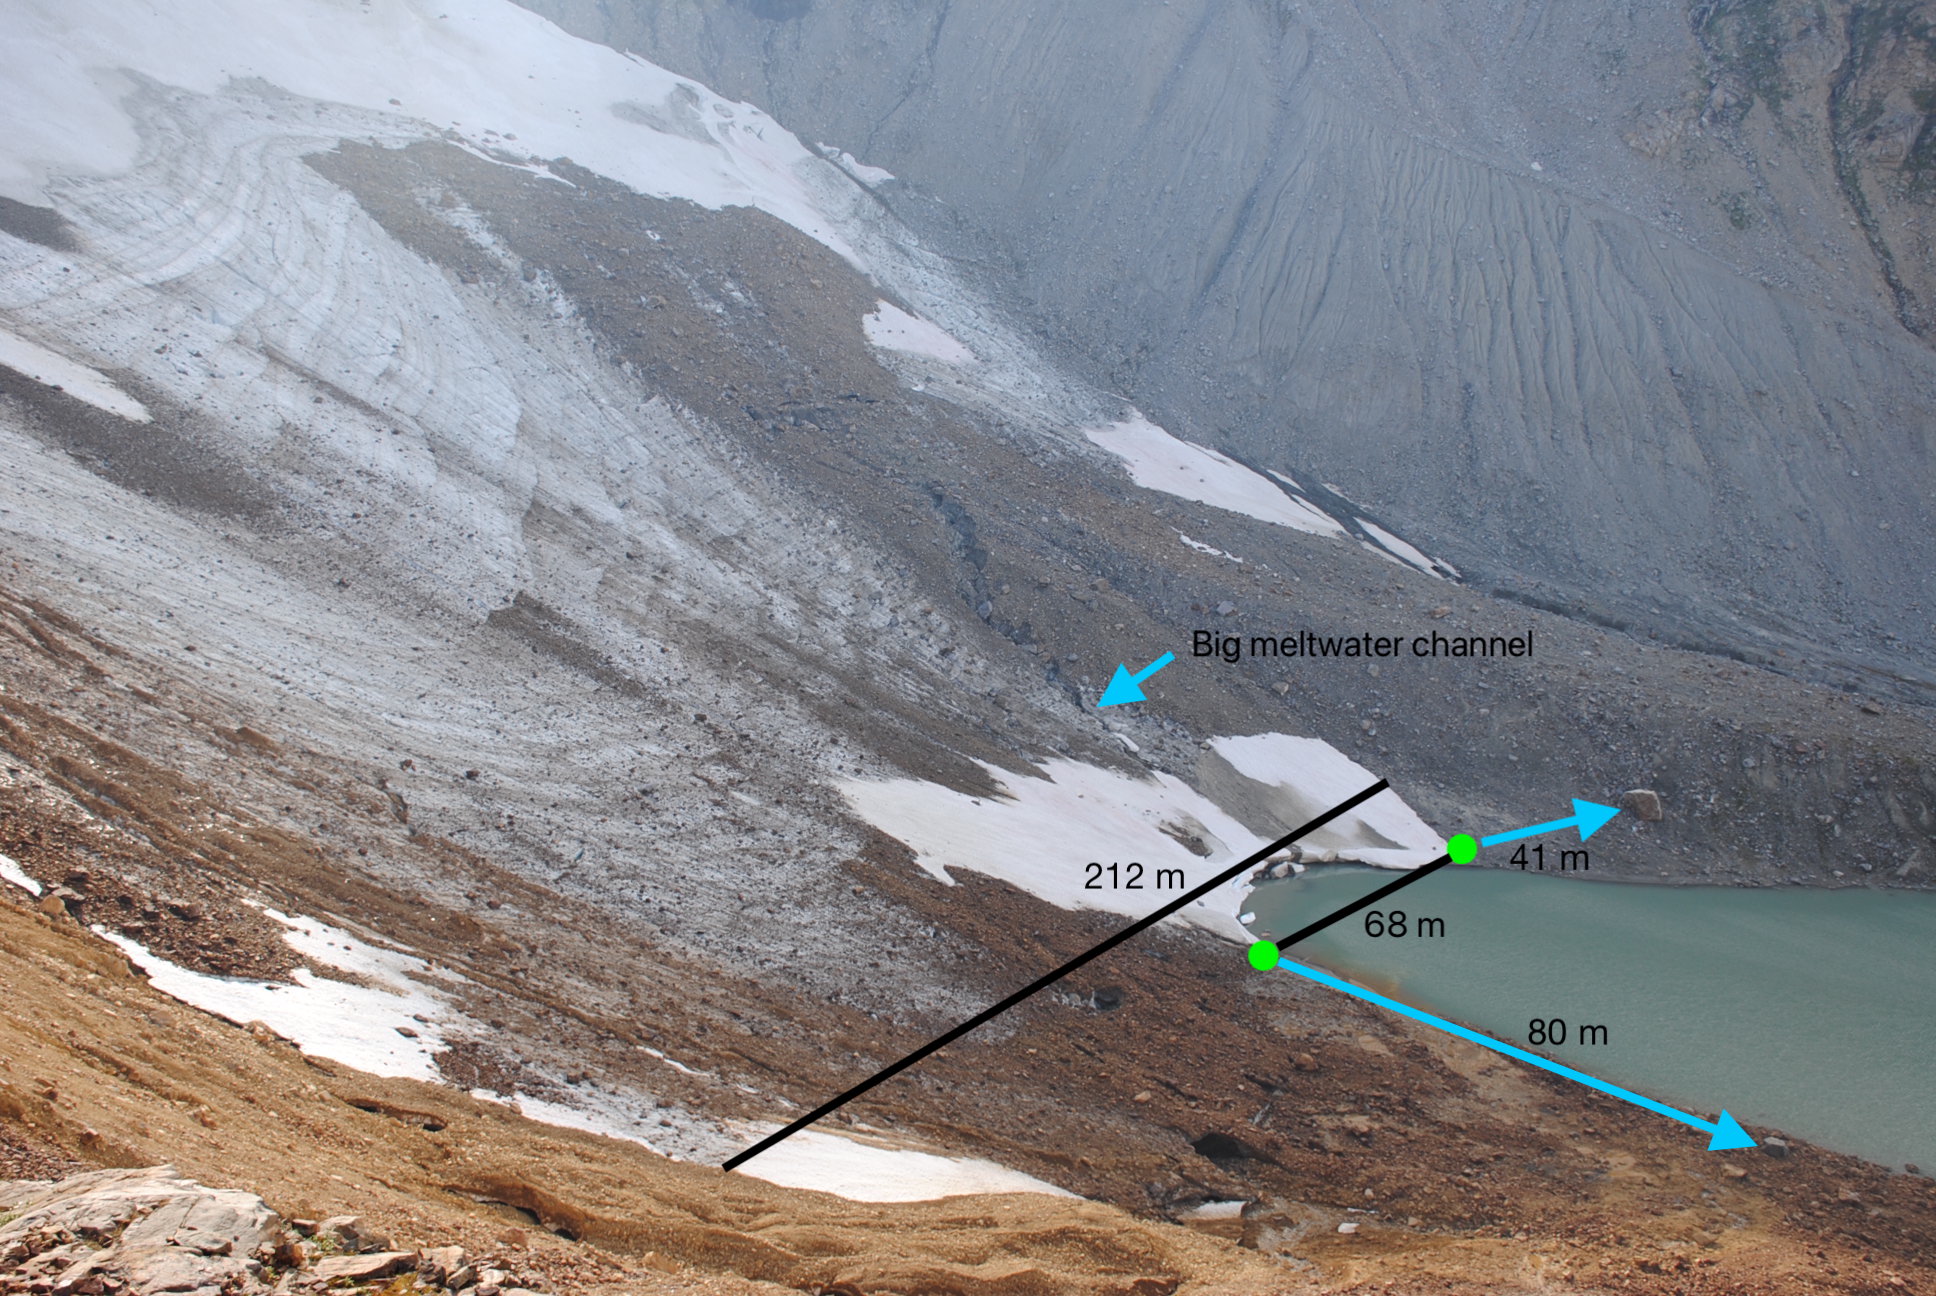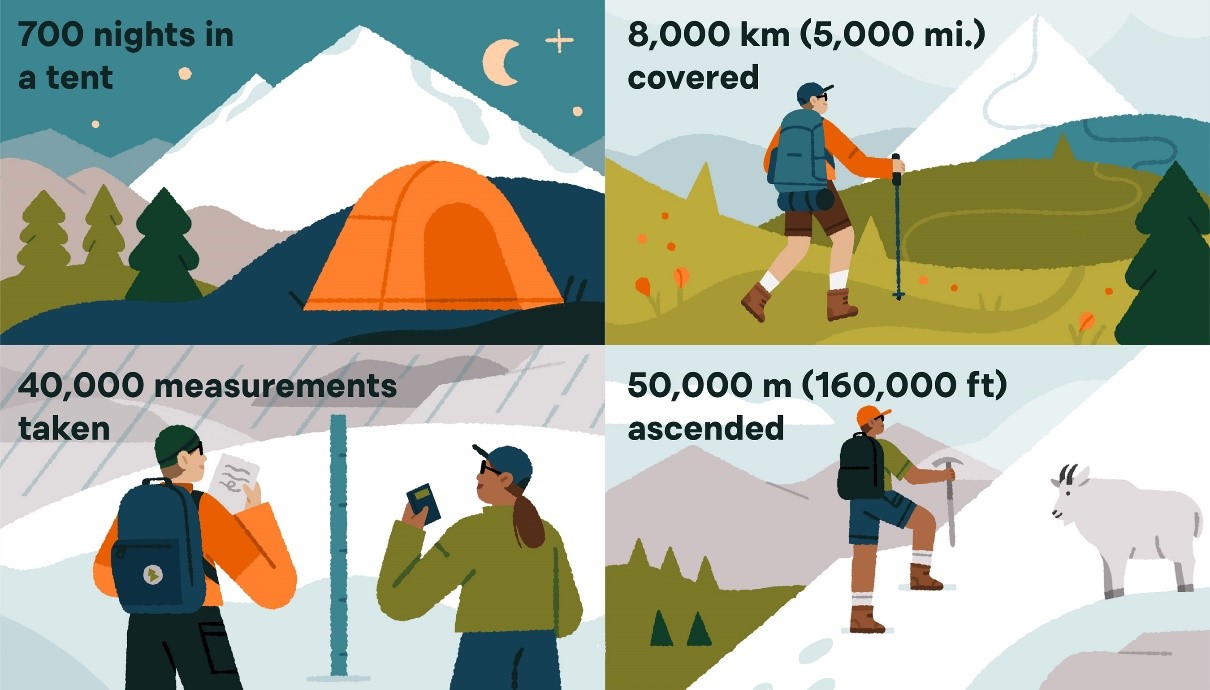
Illustration by Megan Pelto of key numbers behind what it takes to undertake a 40 year field study on glaciers.
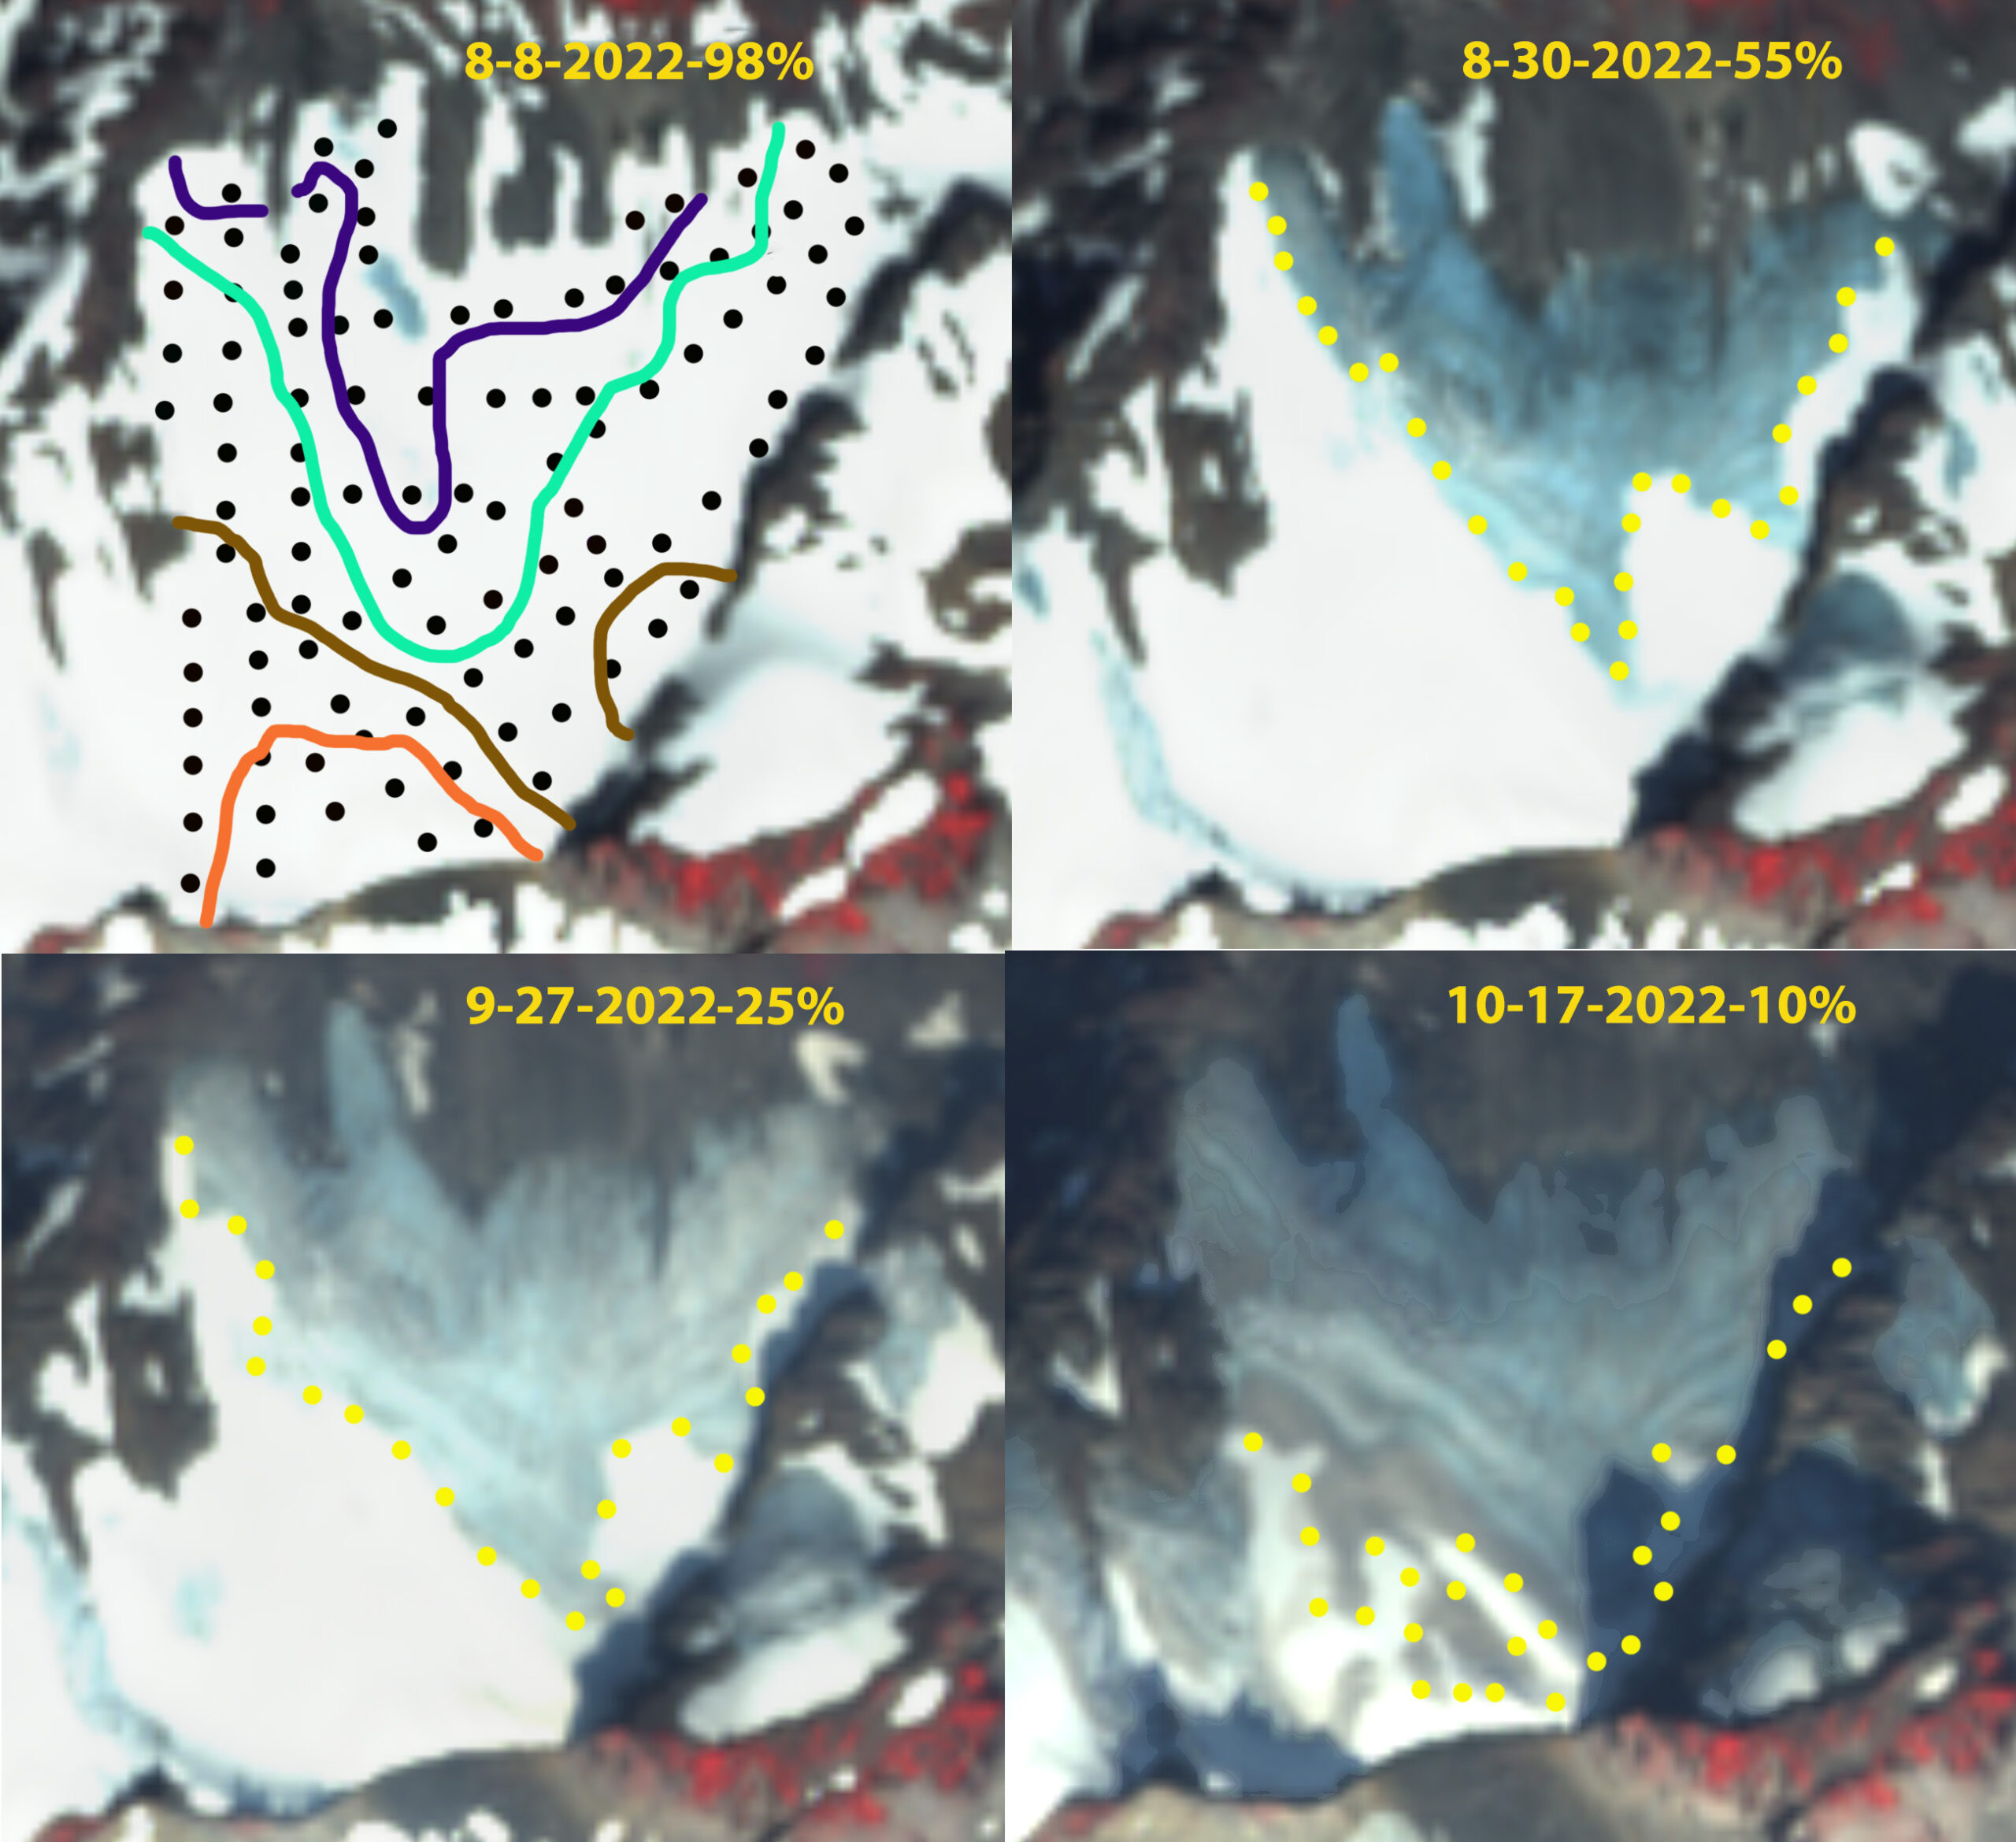
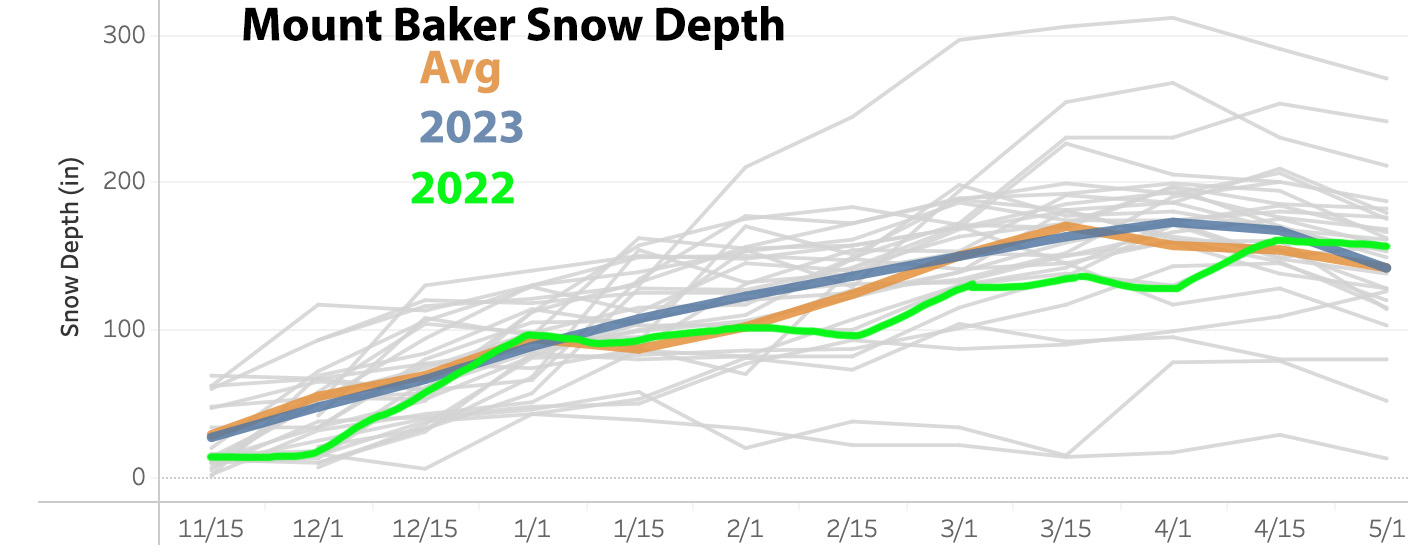
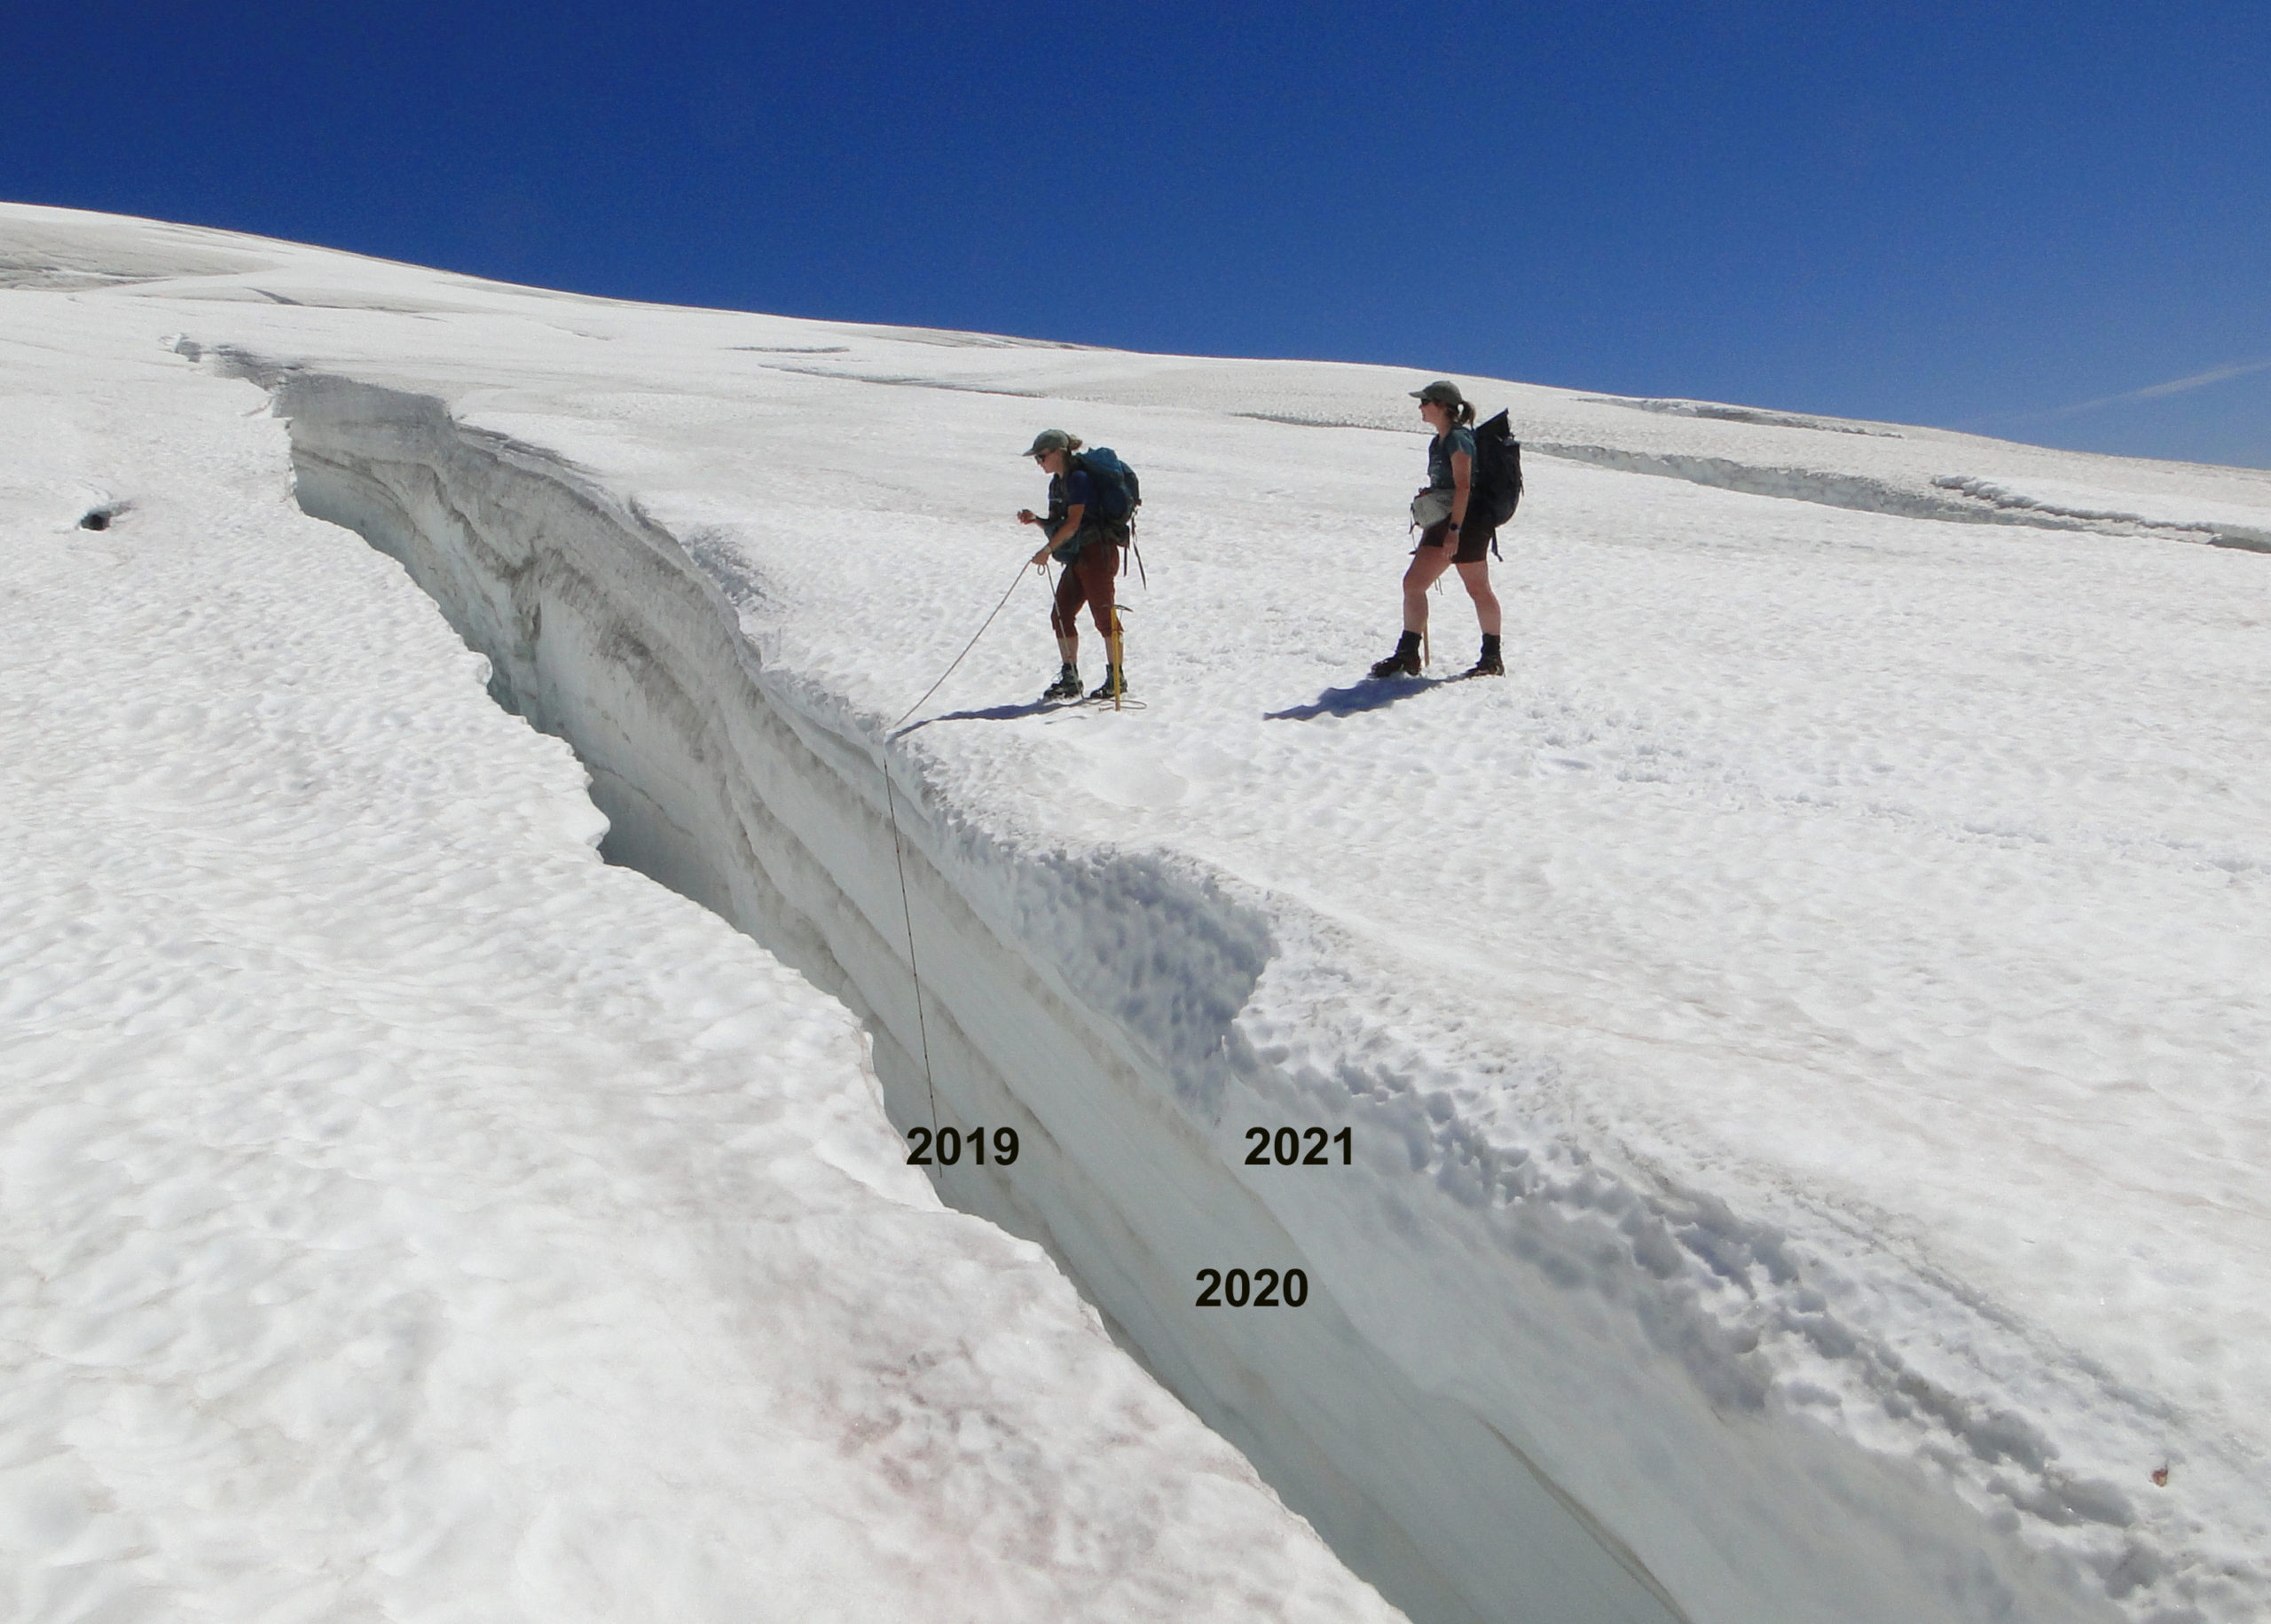
For the 40th consecutive summer the North Cascade Glacier Climate Project is heading into the field to measure and communicate the impact of climate change on North Cascade glaciers. This field season follows the 2021 and 2022 seasons that featured a historic heat wave and periods of extended warm weather. The heat led to a greater exposure of bare ice on glaciers, particularly at higher elevations. For ice surfaces with a higher albedo and greater density the observed melt rates are 7-9 cm per day water equivalent during warm weather events vs 4-6 for snow surfaces. This led to substantial mass losses on North Cascade glacier for the two years of -2.5 m. Winter snowpack in the North Cascades in 2023 was 80-90% of normal on April 1 and May 1.
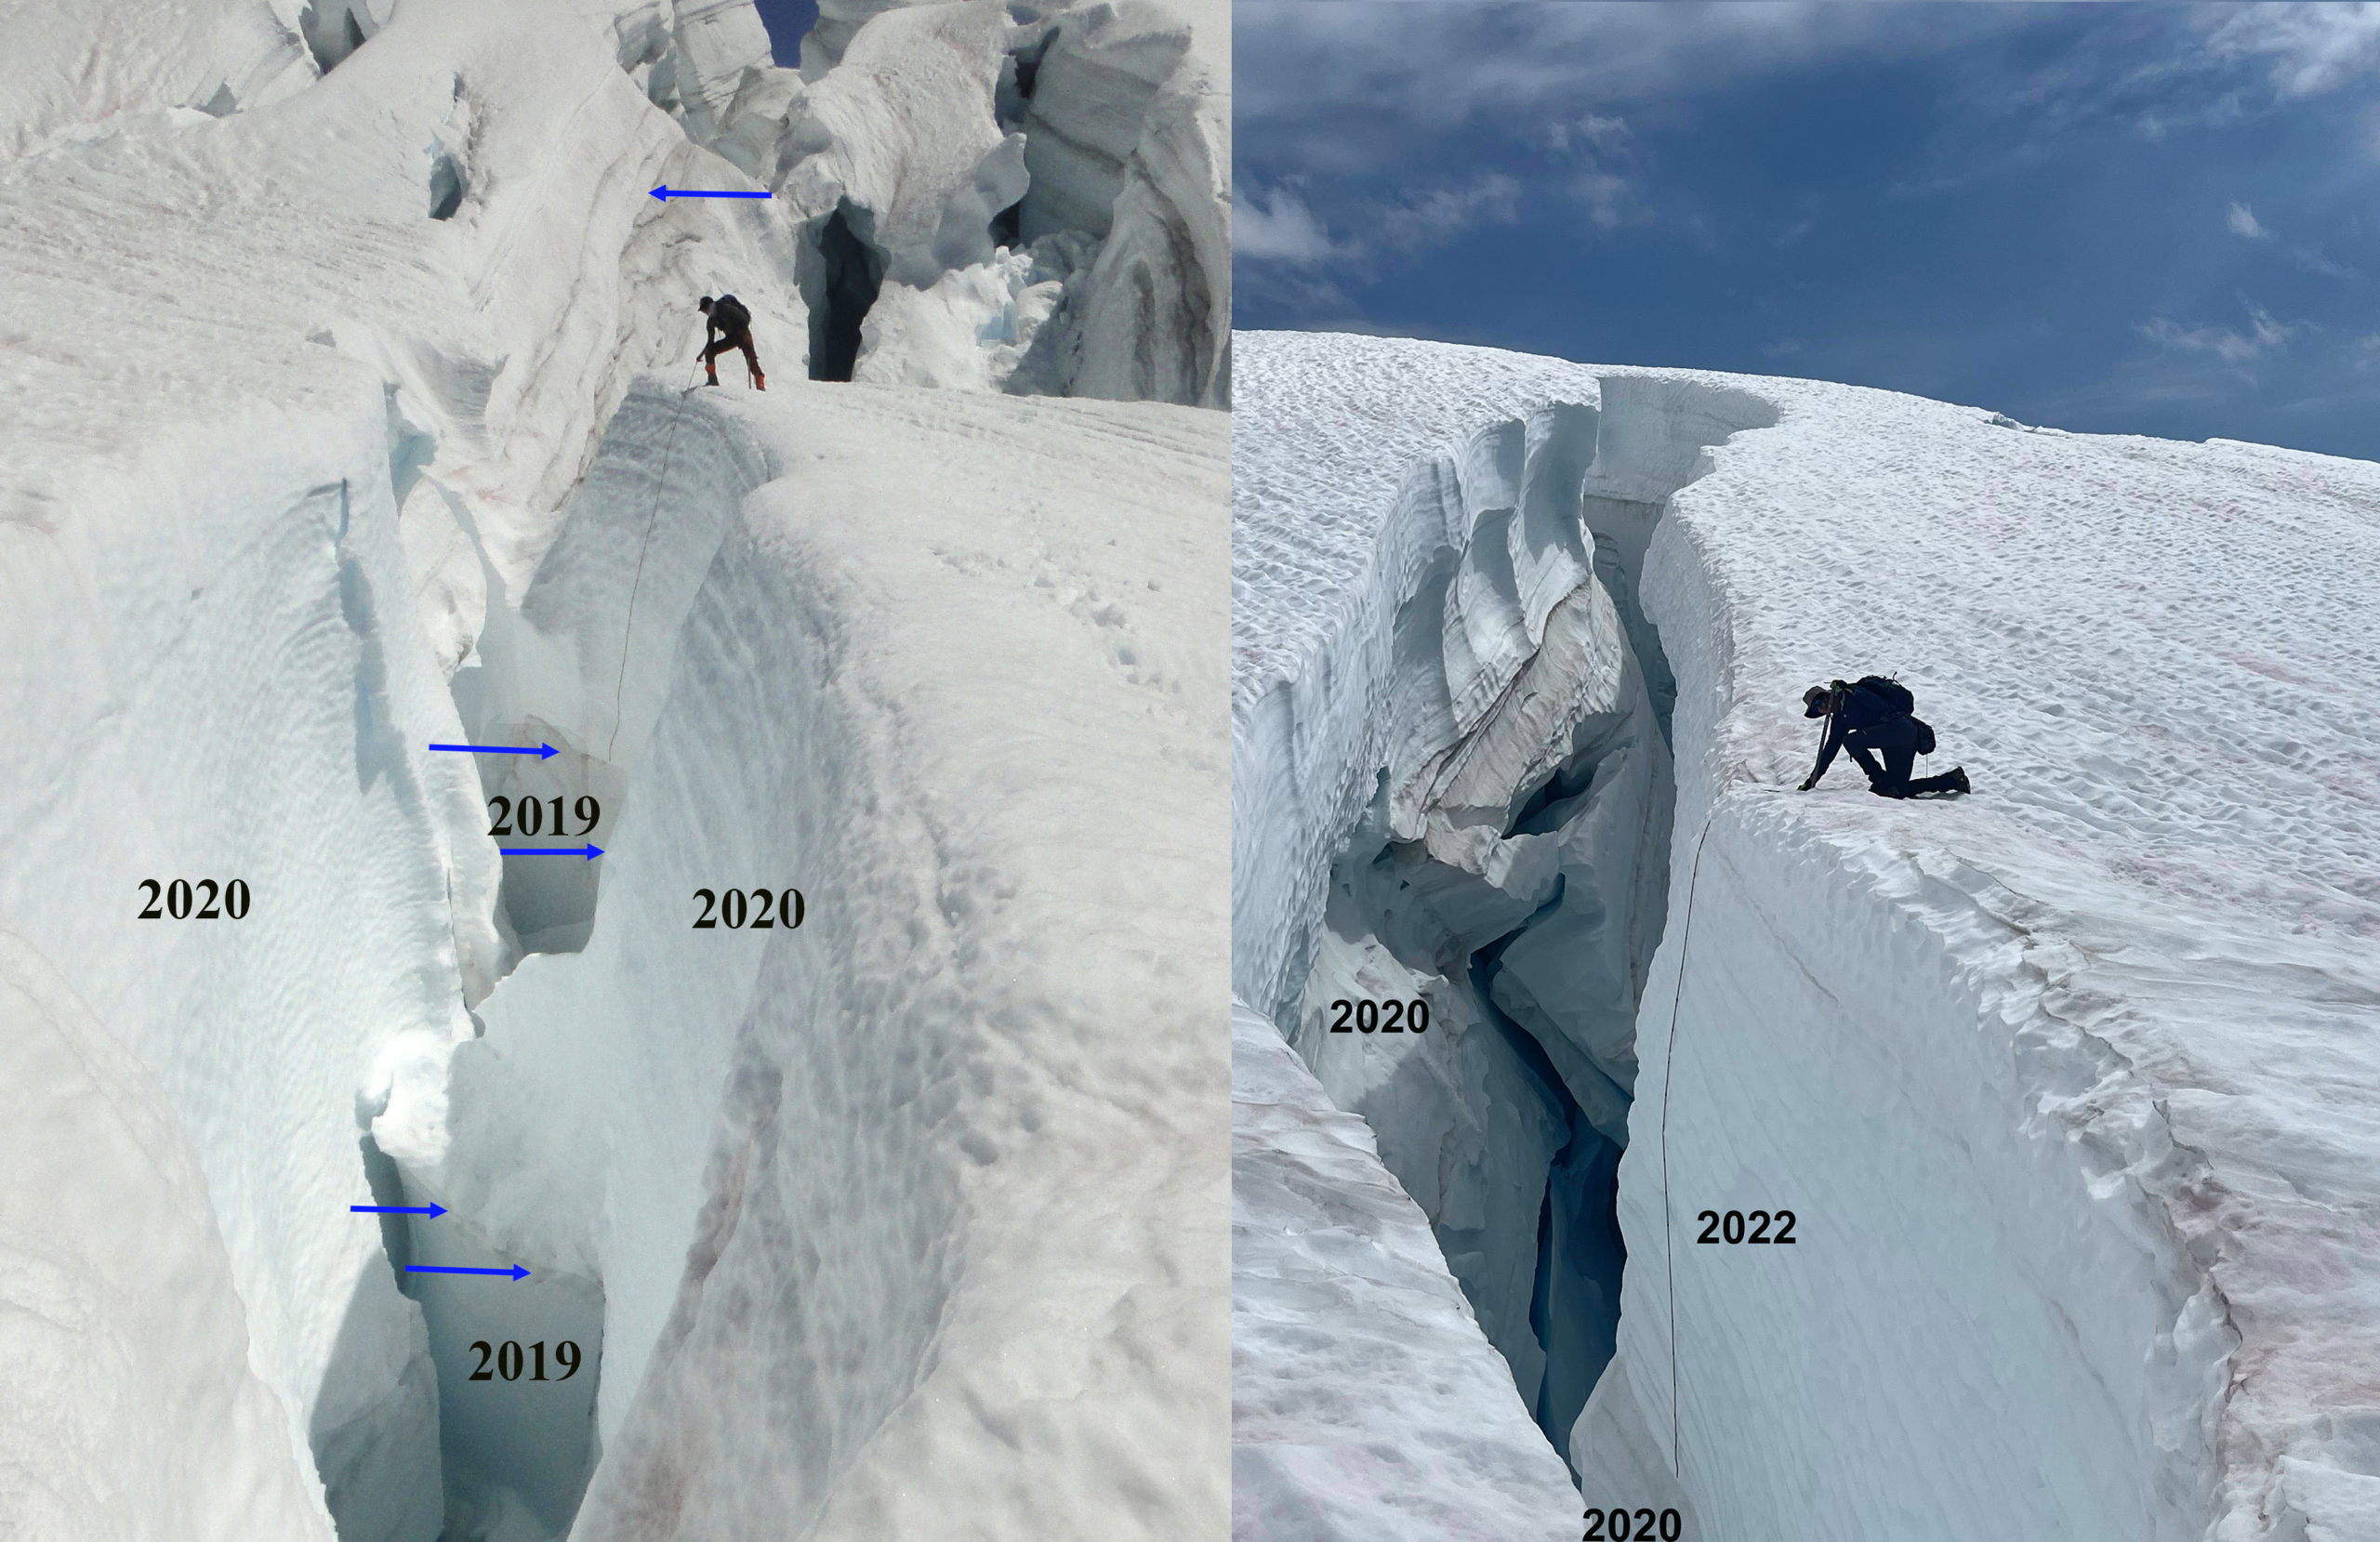
Science objectives: We will complete detailed measurements on 10 glaciers, three of which are part of the World Glacier Monitoring Service reference glacier network (42 glaciers globally), which have 30+ consecutive years of mass balance observations. This summer we will have an opportunity to assess the long-term ramifications of the 2021 and 2022 summers and measure the response of glaciers to the weather of 2023 with detailed mass balance, crevasse depths and glacier surface elevation profiling.
Art Objectives: We will collaborate with several artists who will join us for a portion of the field season. They will be able to create their own work about the landscape and the science or may join us for fieldwork and make plans for future artwork. Potential artists include painters, a podcast creator, a photographer, and a printmaker. We hope to use this art to share our research with a broader audience and highlight the beauty and importance of these places.
Communication Objectives: We are seeking expedition sponsors this year with brands who have a climate change focus. These organizations can help spread our message; we have two so far. We are looking to support the production of podcasts as well.

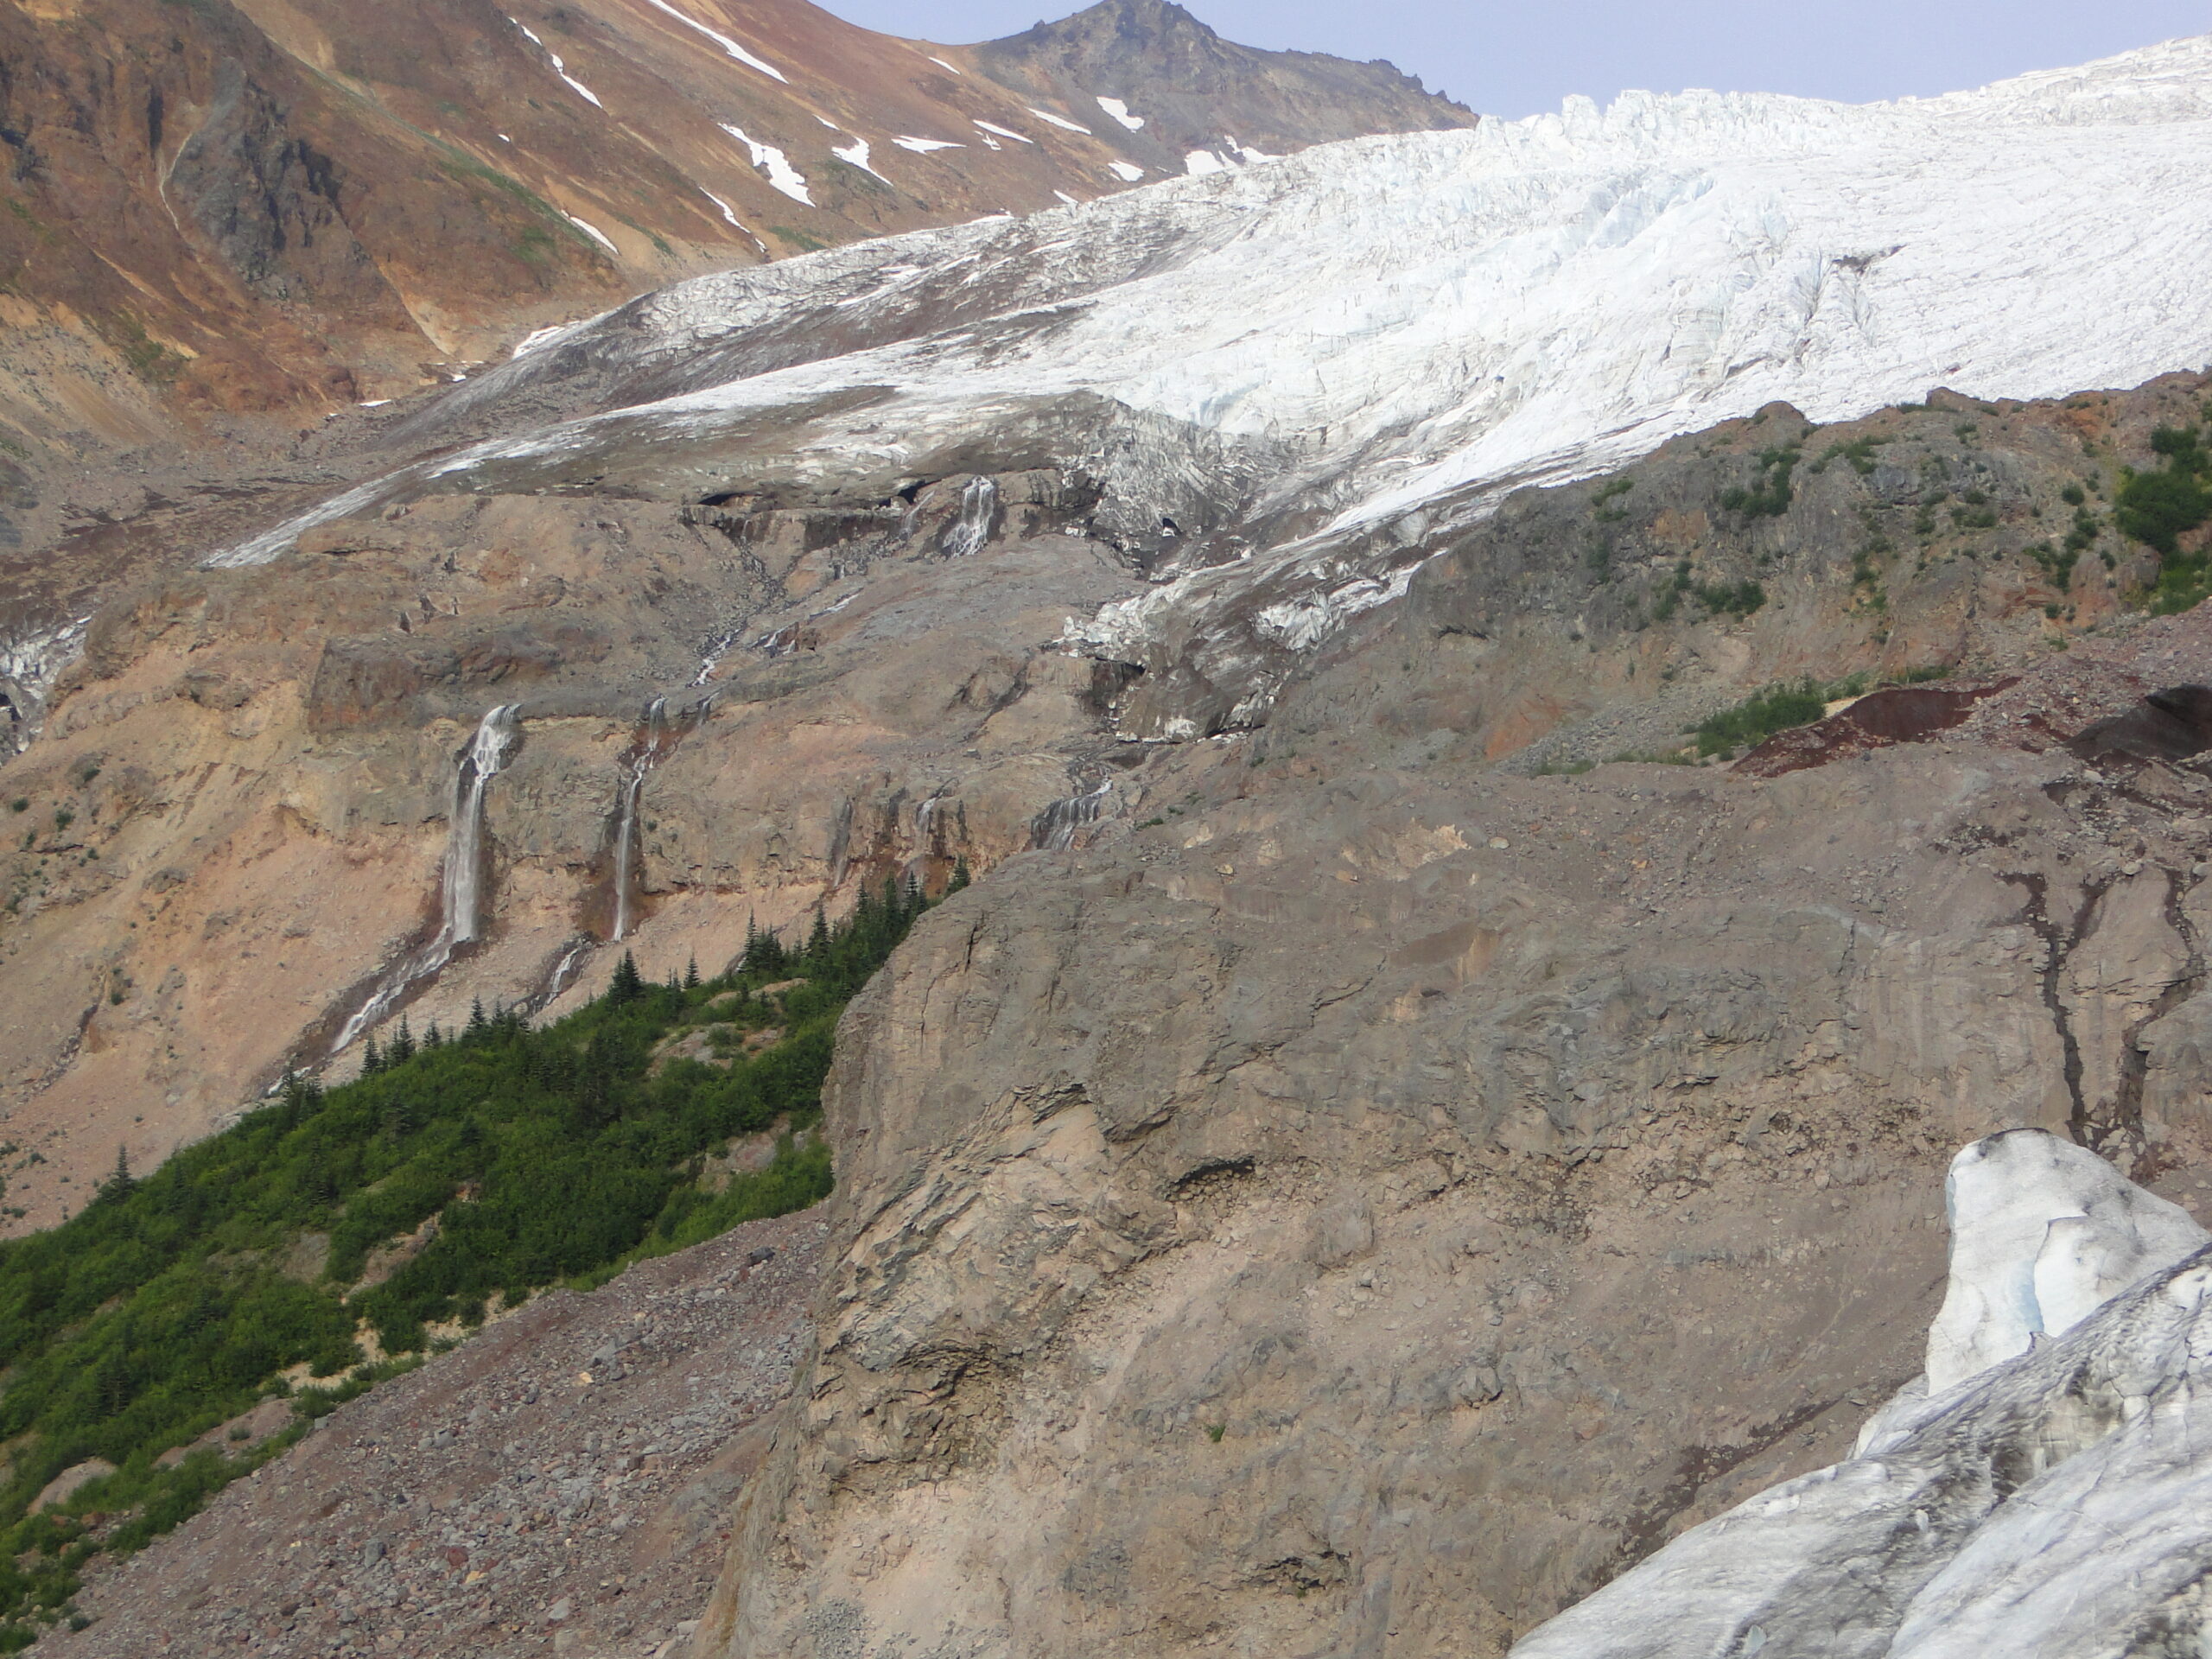
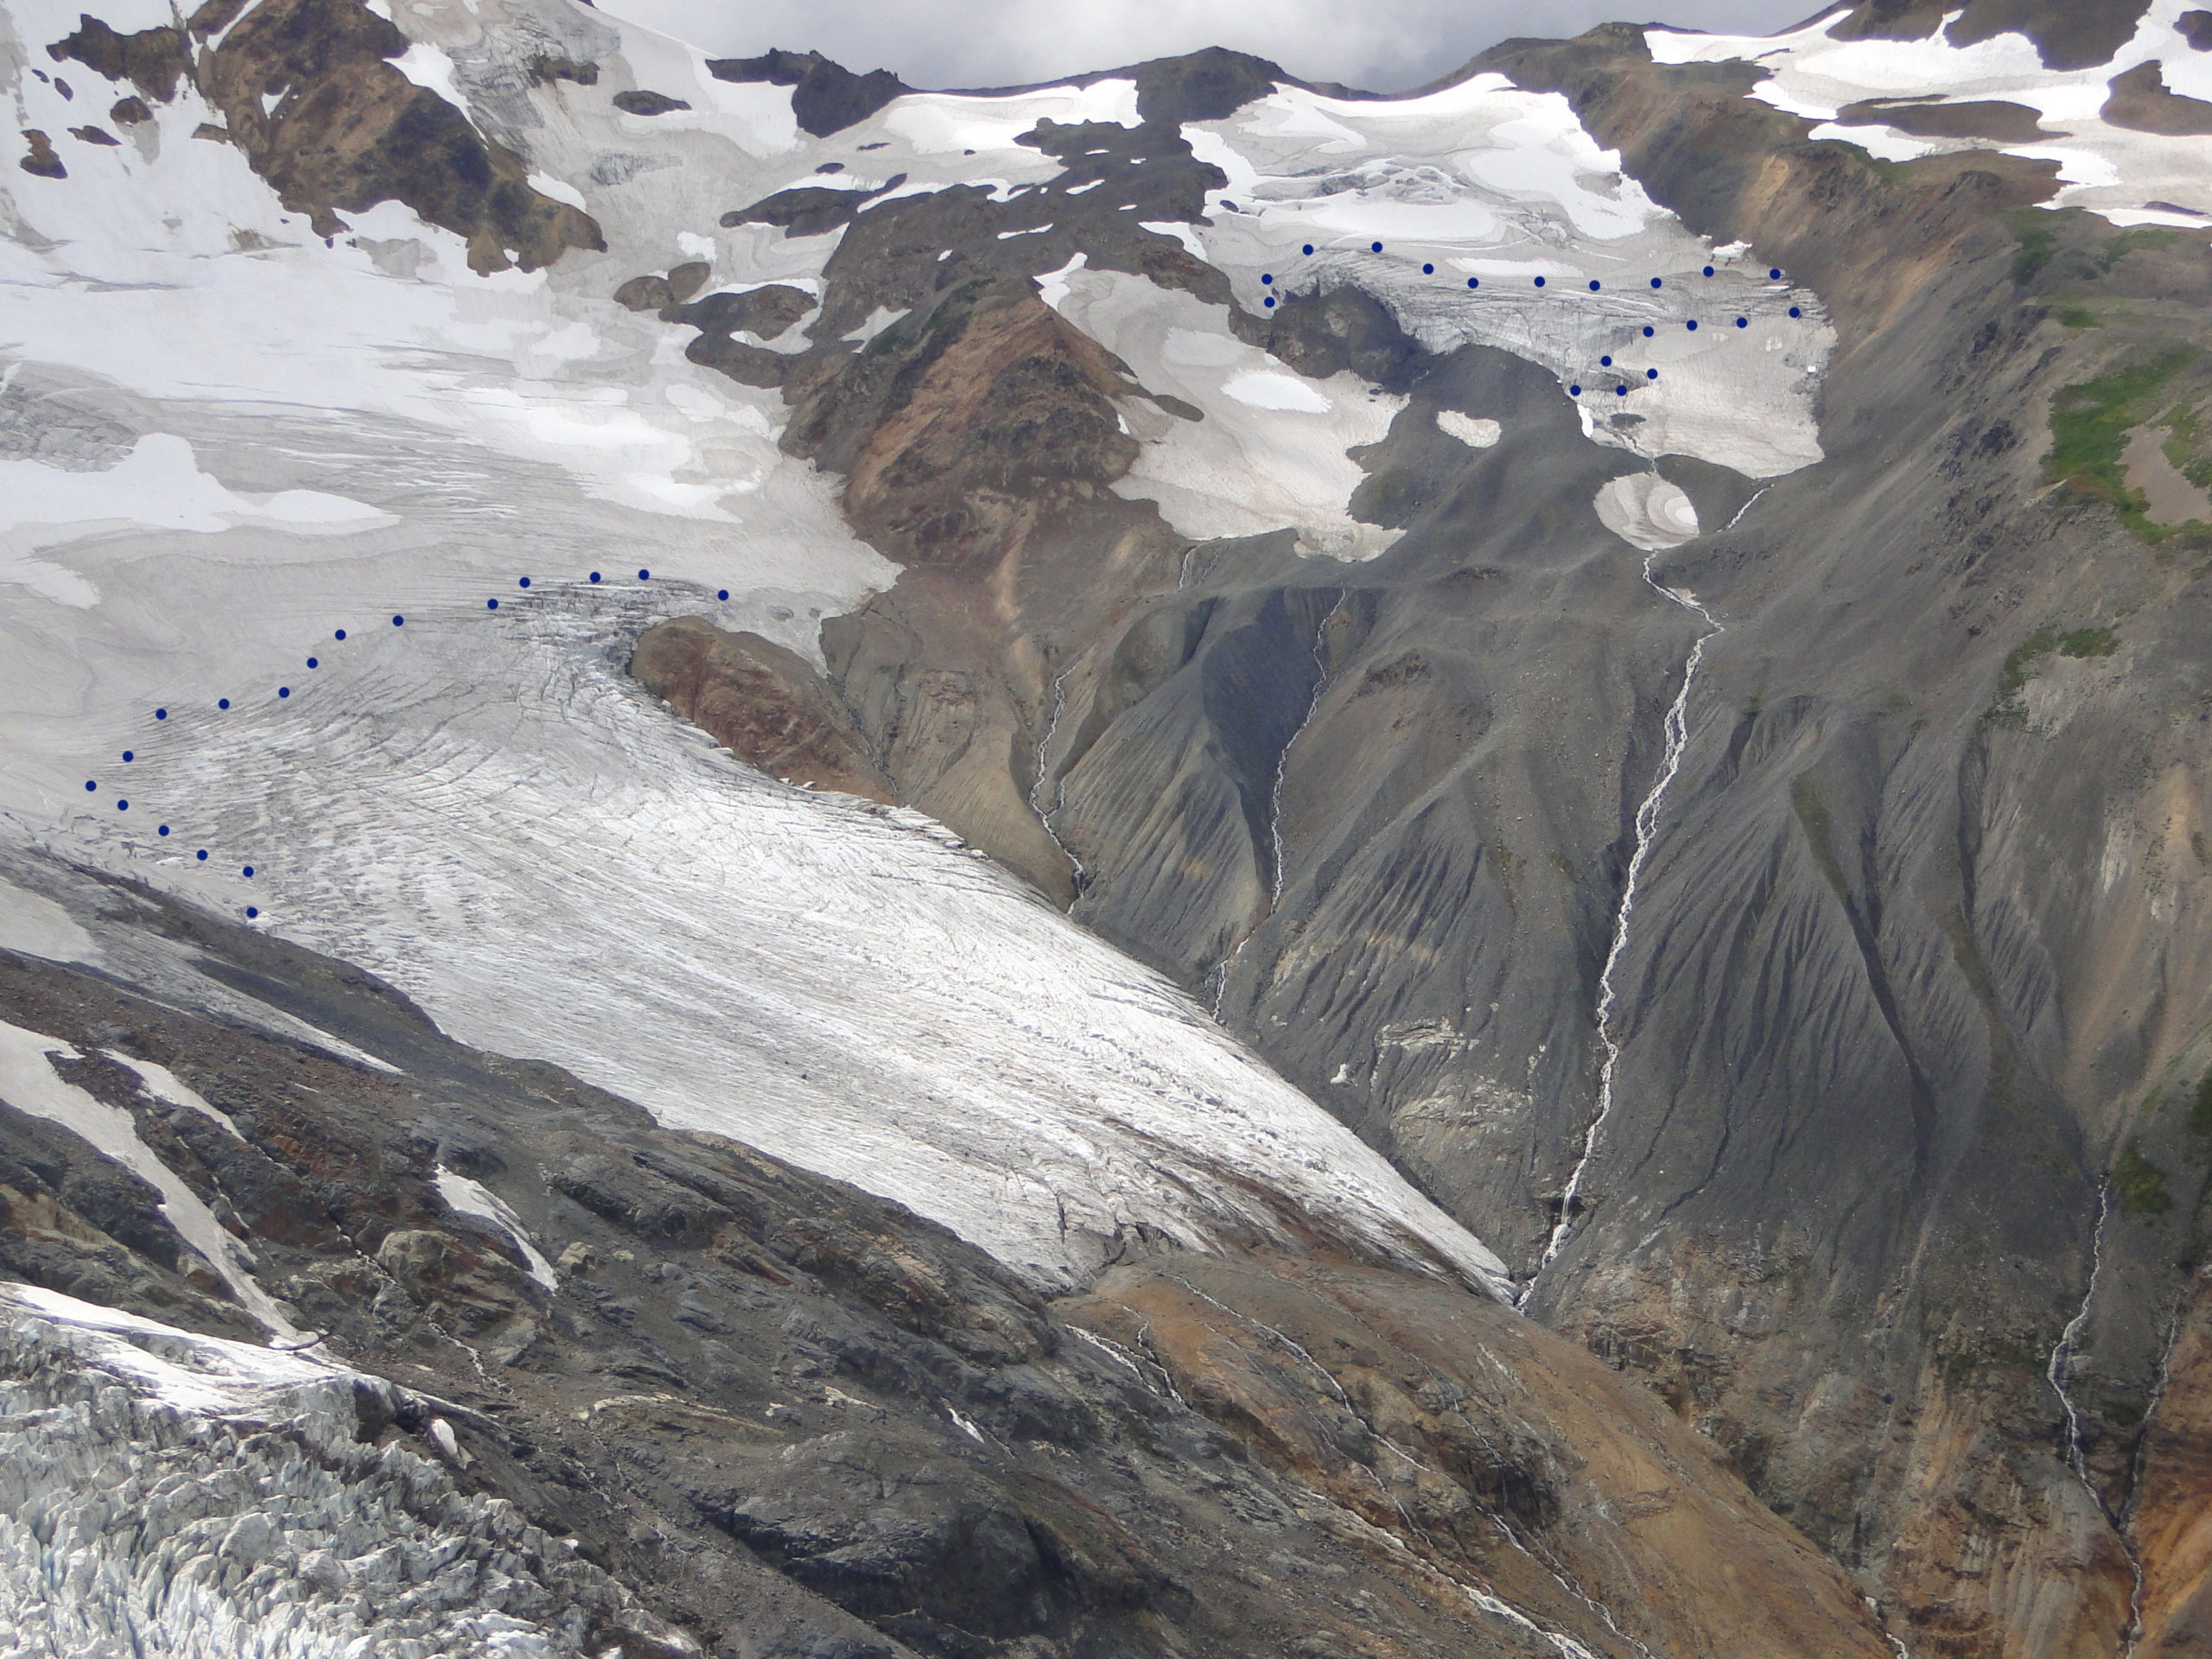
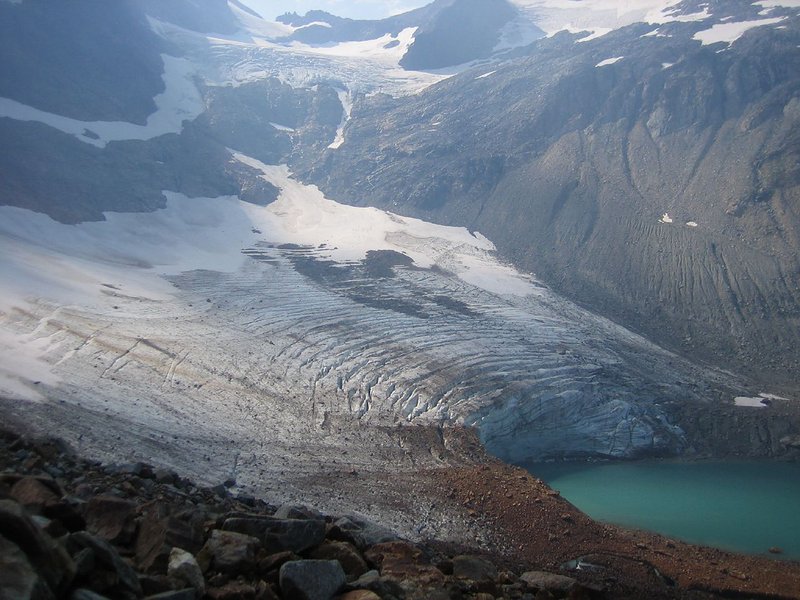
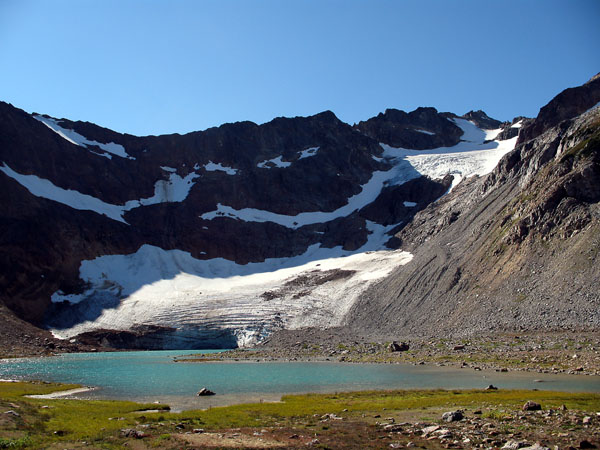
Terminus change at two World Glacier Monitoring Service reference glaciers. Columbia and Eastson Glacier.
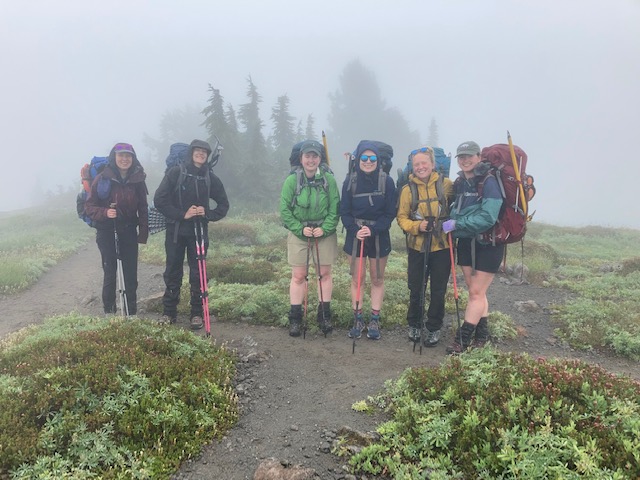
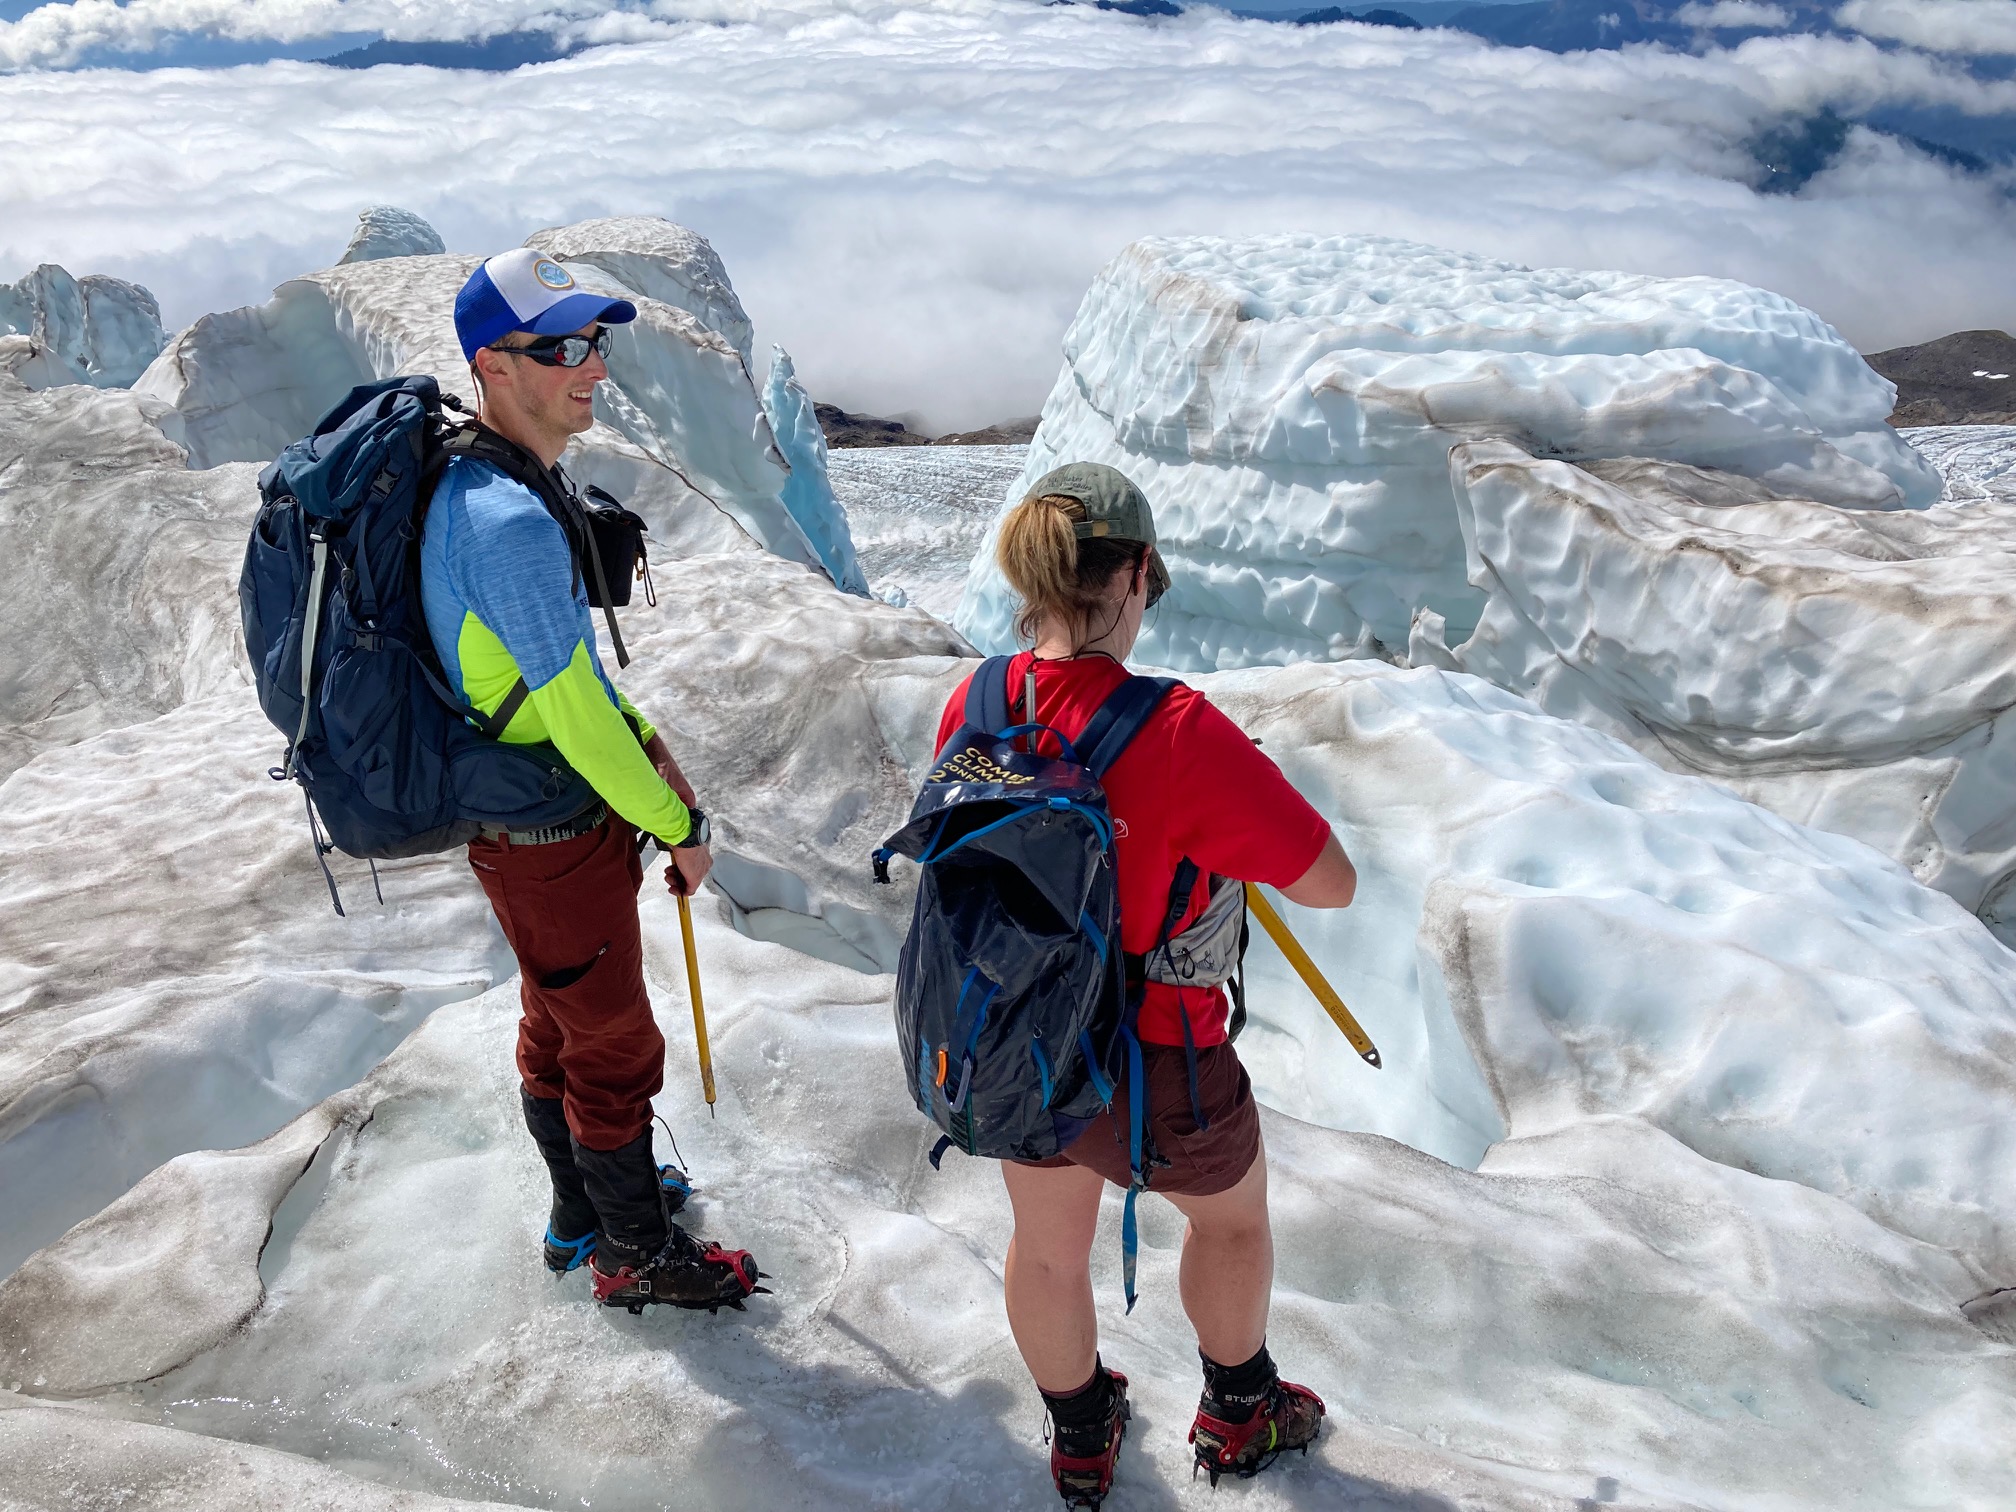
Field Team 2023:
Jill Pelto (she/her)is an artist and scientist from New England who grew up loving winter sports and trips to the mountains. She incorporates scientific research and data into paintings and prints to communicate environmental changes. Her multi-disciplinary work weaves visual narratives that reveal the reality of human impacts on this planet. She completed both her B.A. degrees in Studio Art and Earth and Climate Science, and her M.S. focused on studying the stability of the Antarctic Ice Sheet at the University of Maine, spending two field seasons at a remote camp in the southern Transantarctic Mountains. Jill will be joining the project for her 15th field season. She is excited about continuing to document the change in North Cascade glaciers that she has witnessed each of the last ten years — through science and art.
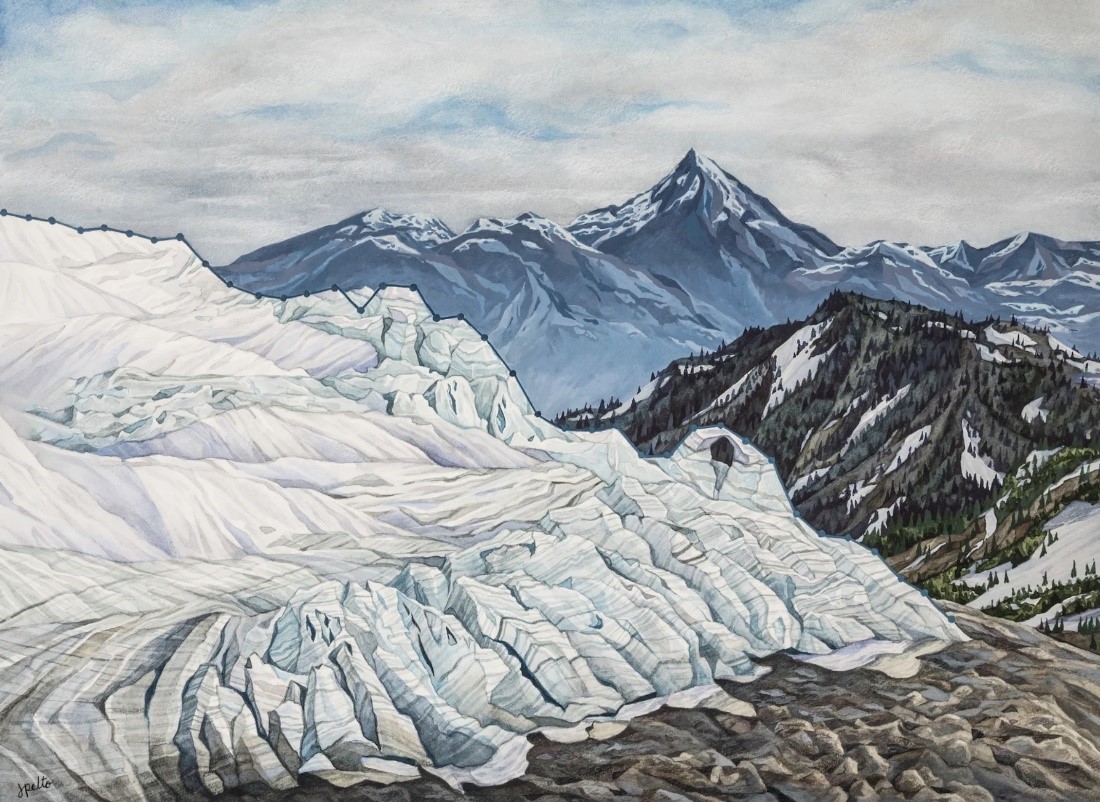
Painting by Jill Pelto that incorporates mass balance data from NCGCP from 1983-2022 along the top of the glacier.
Mauri Pelto (he/him) has directed the project since its founding in 1984, spending more than 800 nights camped out adjacent to these glaciers. He is the United States representative to the World Glacier Monitoring Service. For a decade he has been author of the AGU blog “From a Glacier’s Perspective,” and associate editor for three science journals. He is on the Science Advisory Board for NASA’s Earth Observatory. His primary position is Associate Provost at Nichols College, where he has been a professor since 1989. He either runs on trails or ski’s on trails alpine and cross country everyday.

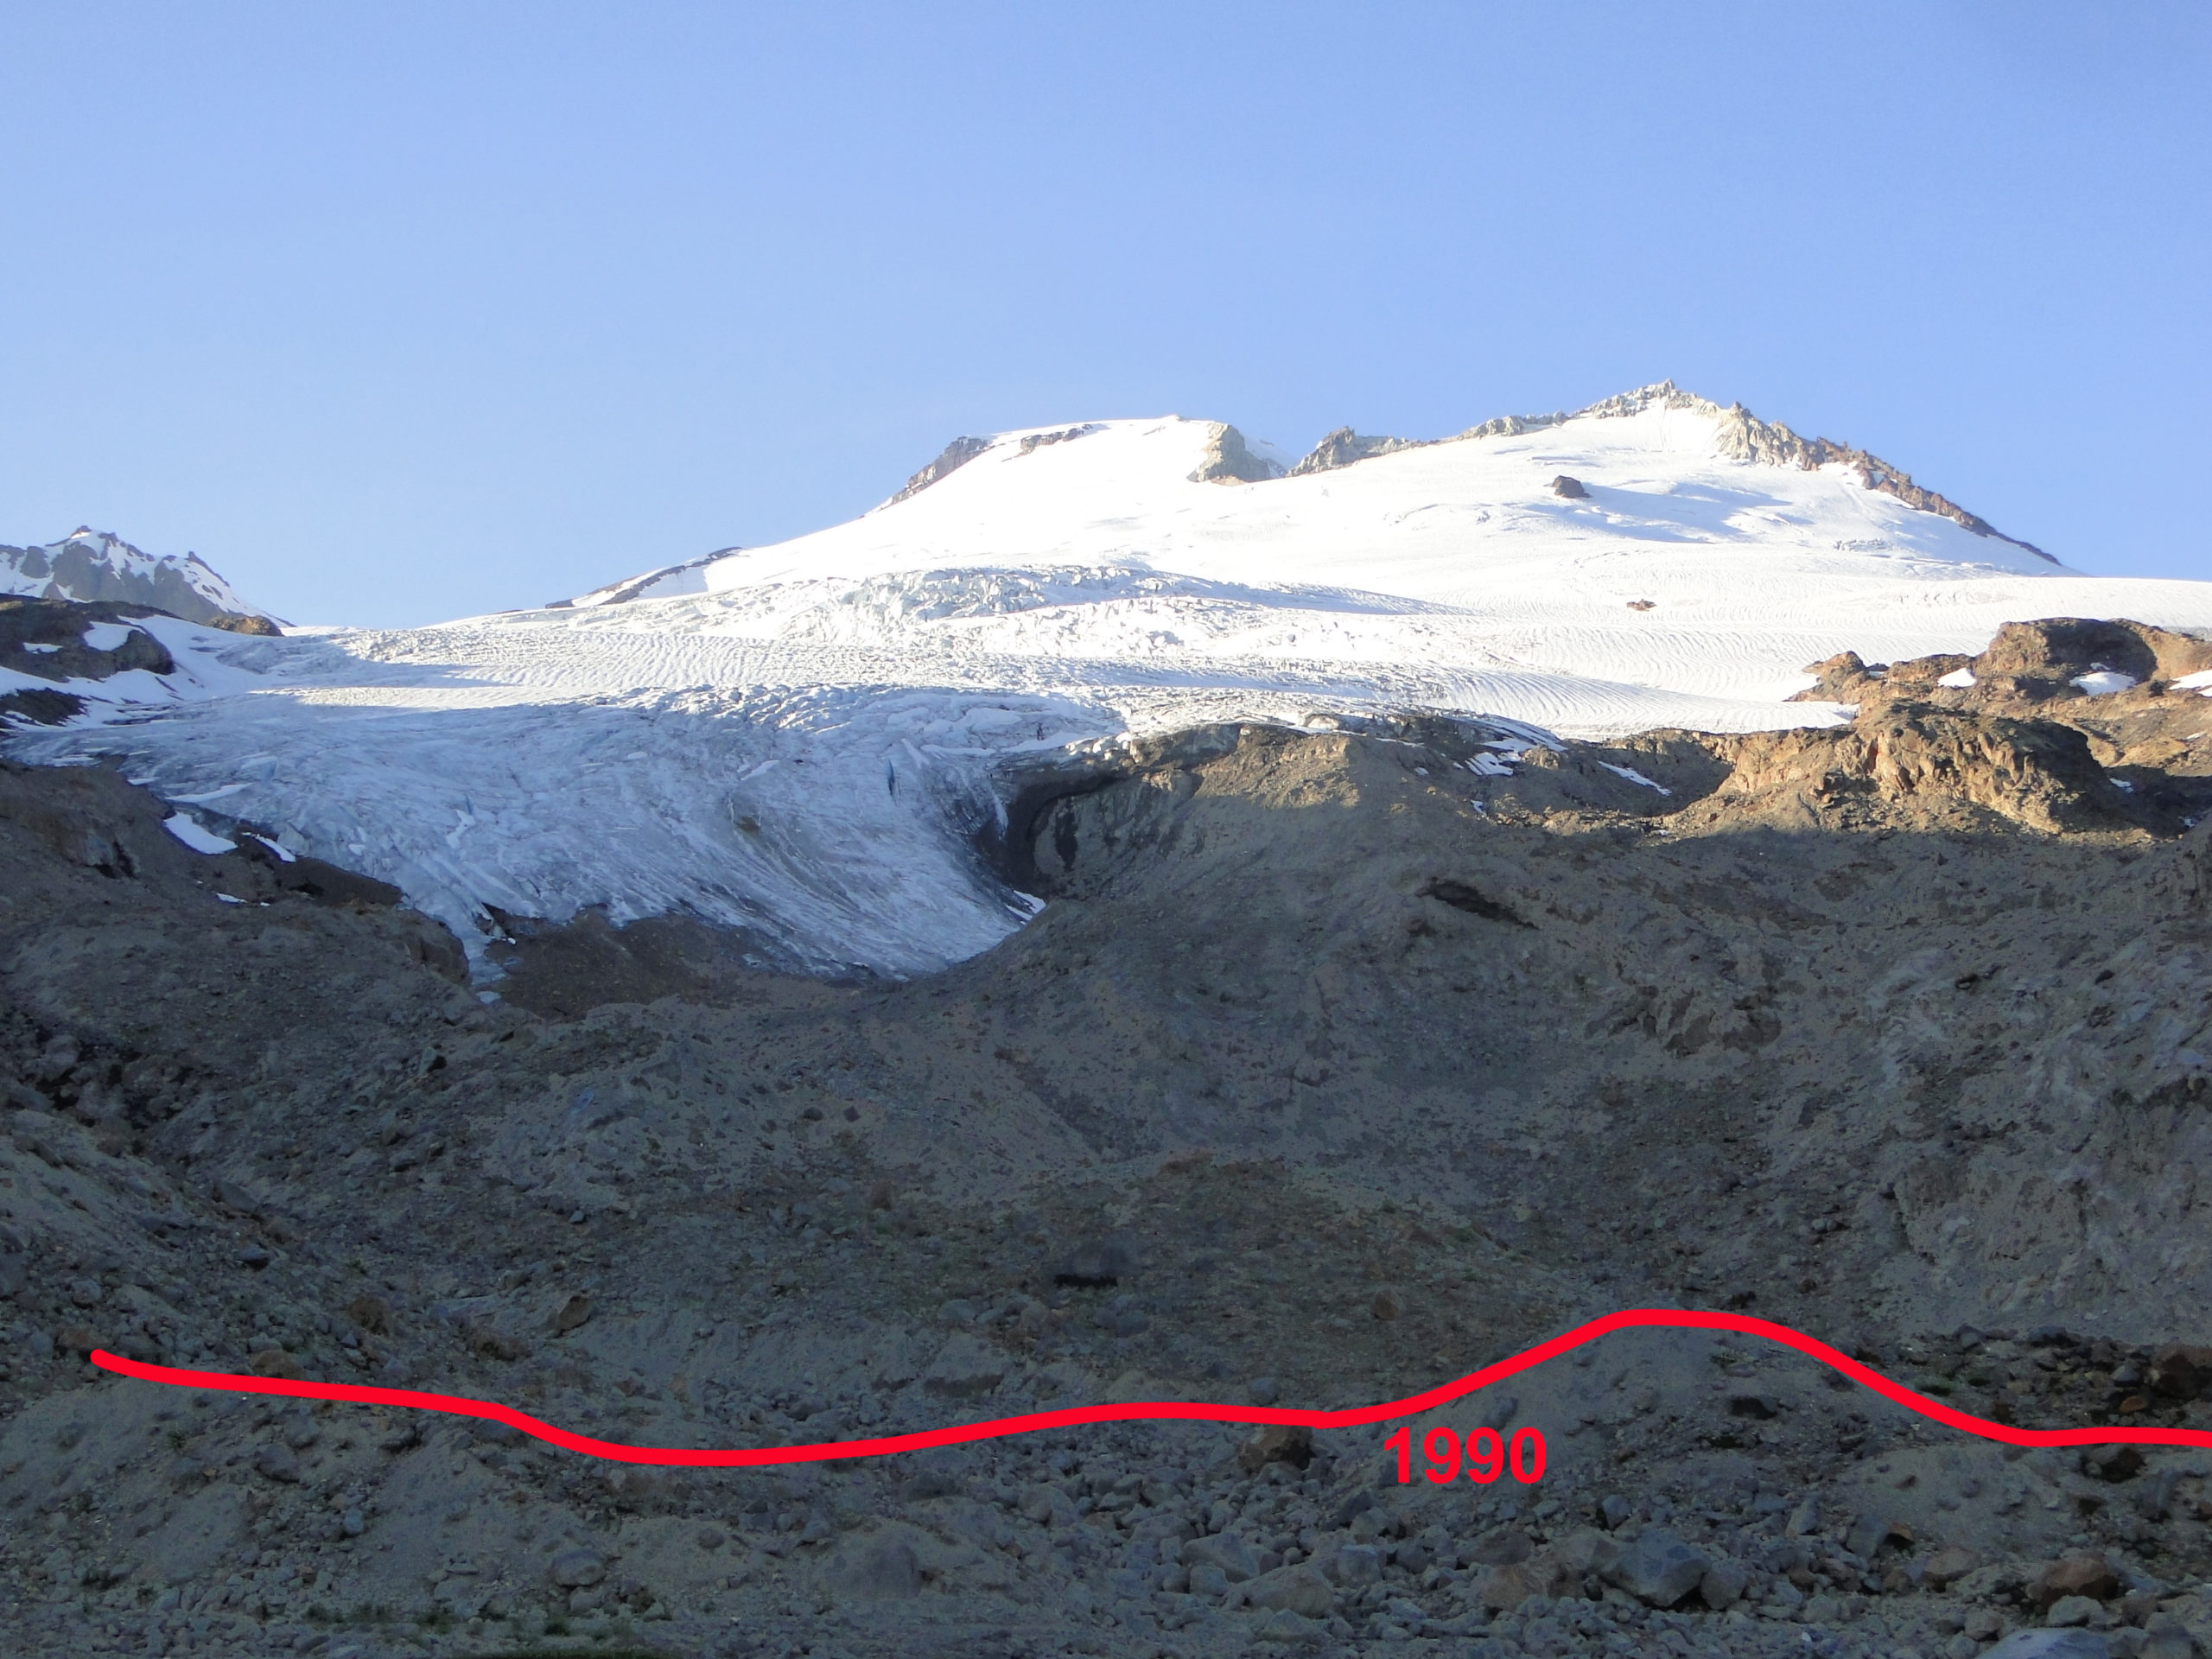
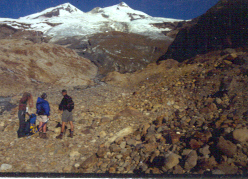
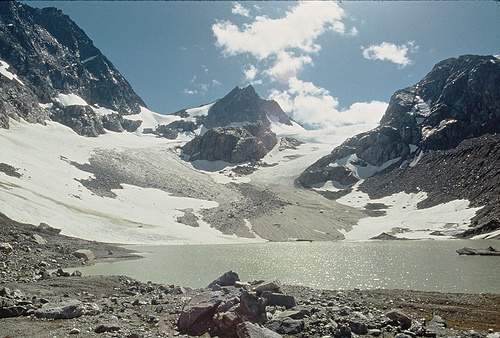
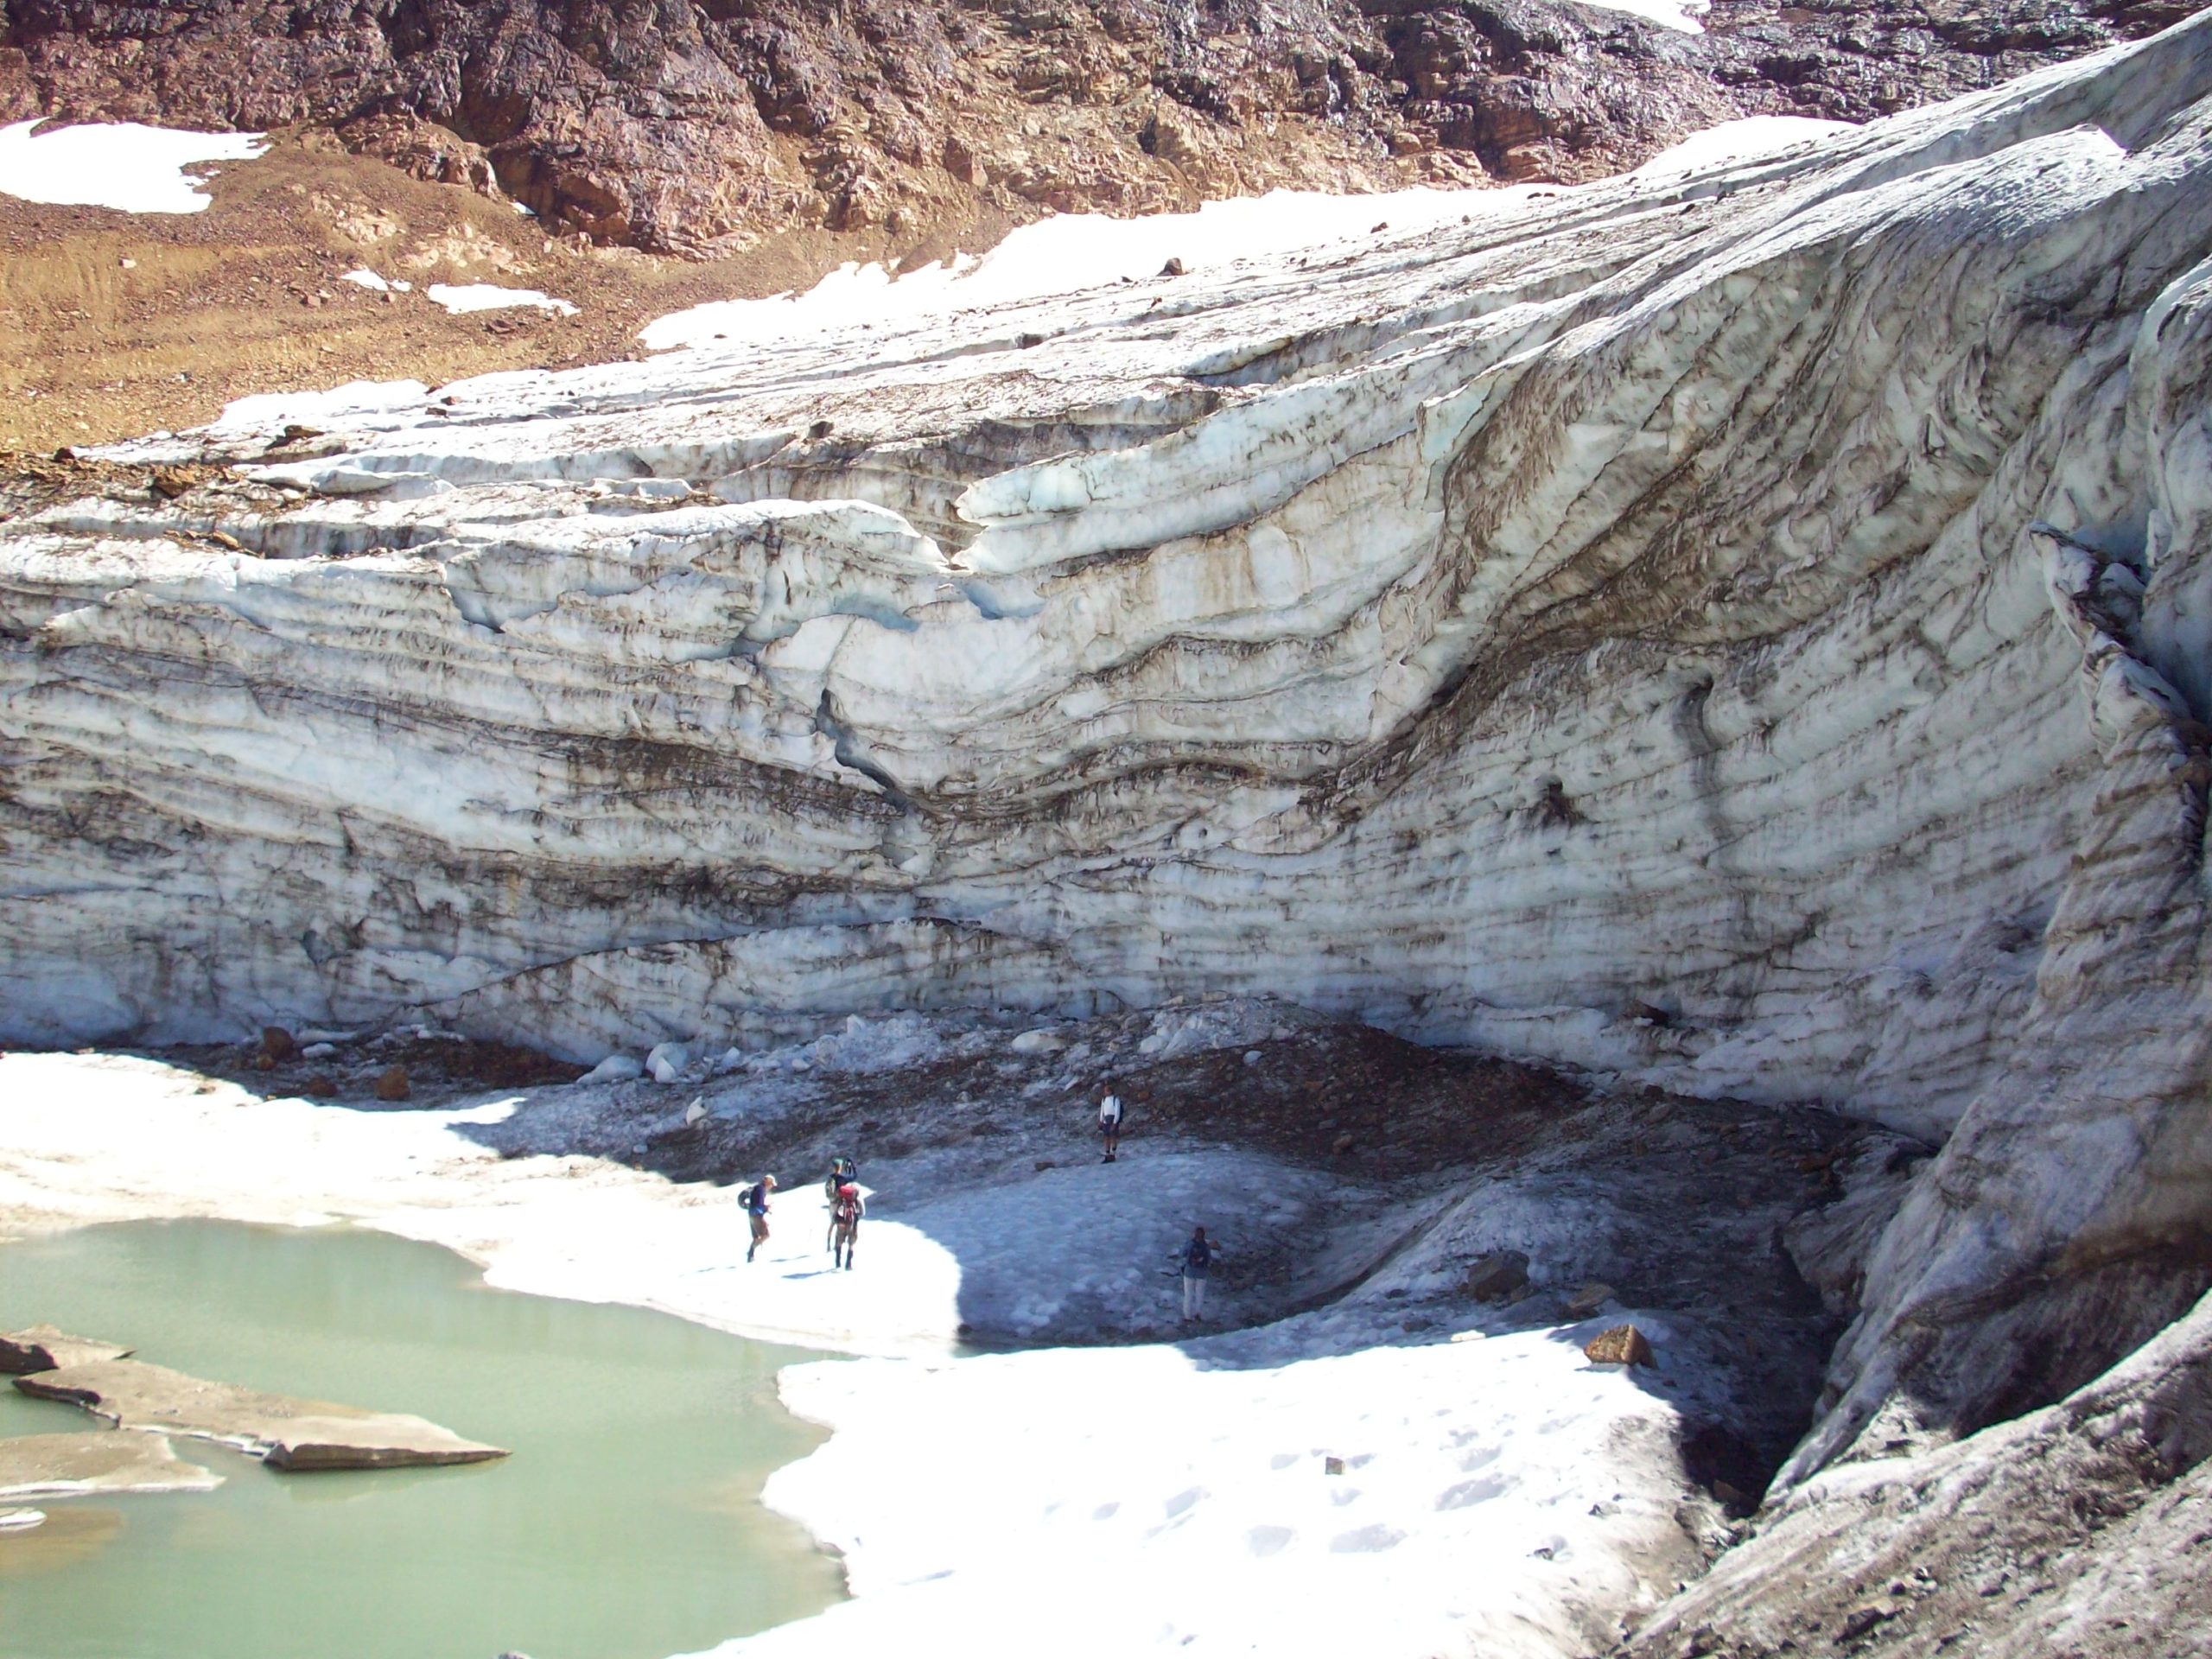
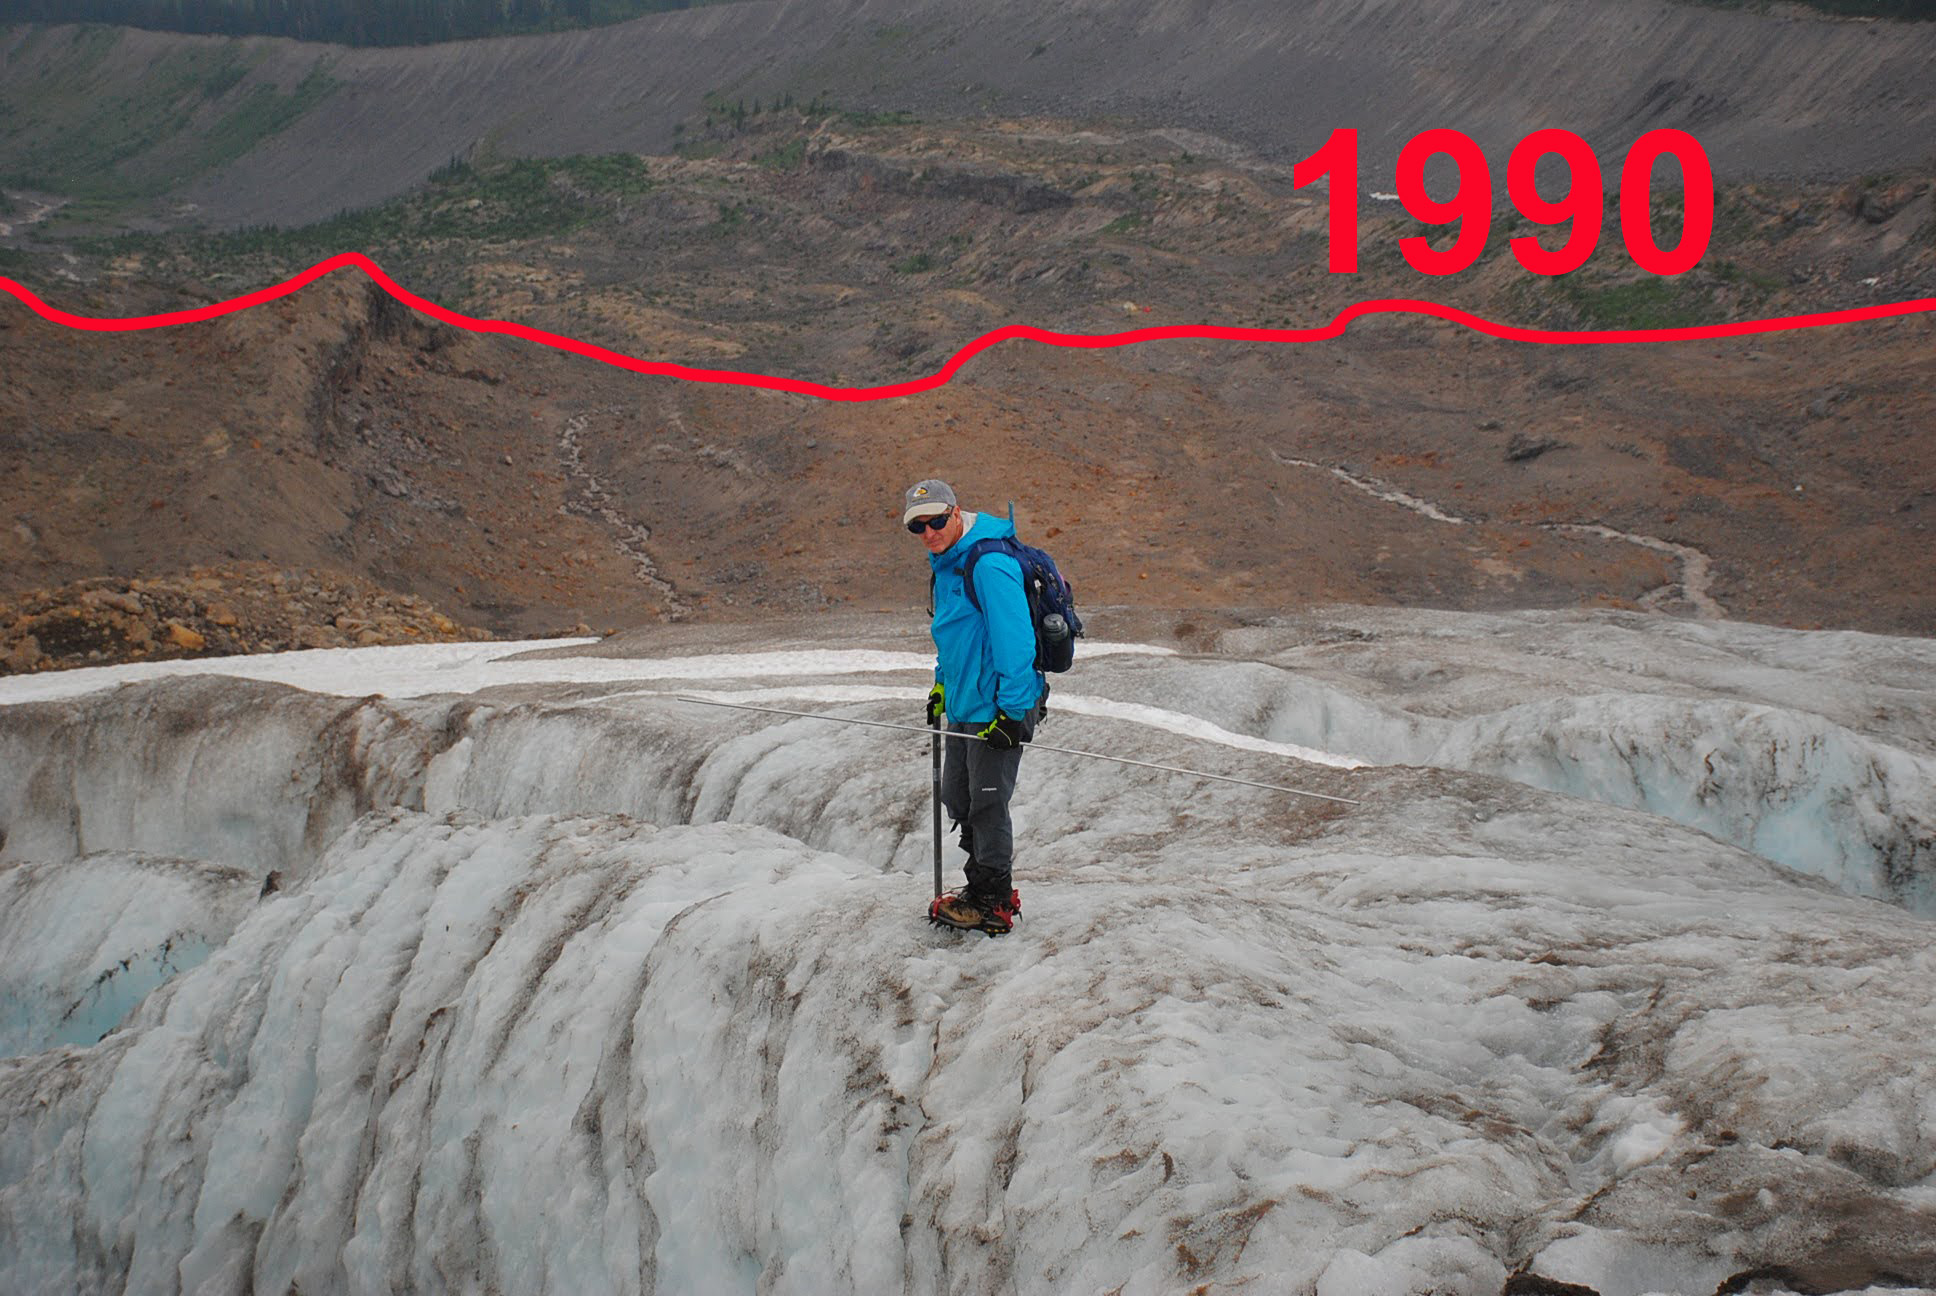
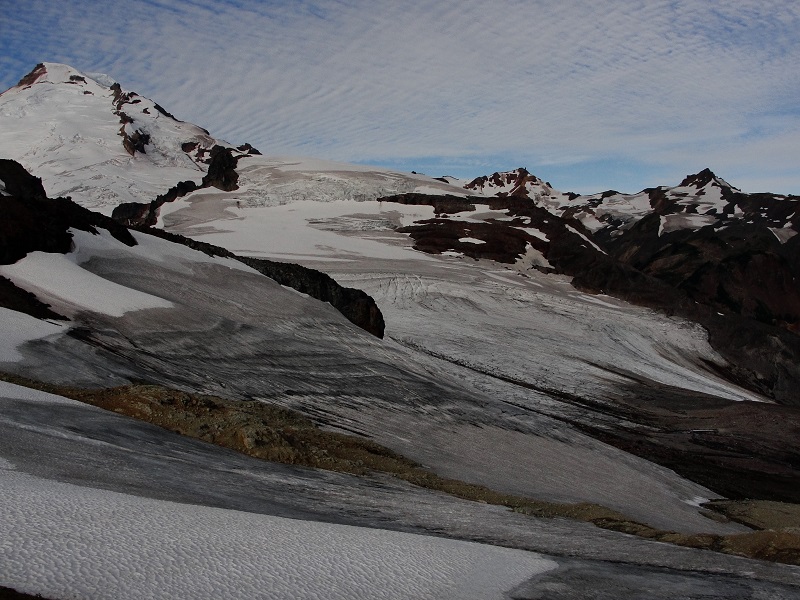
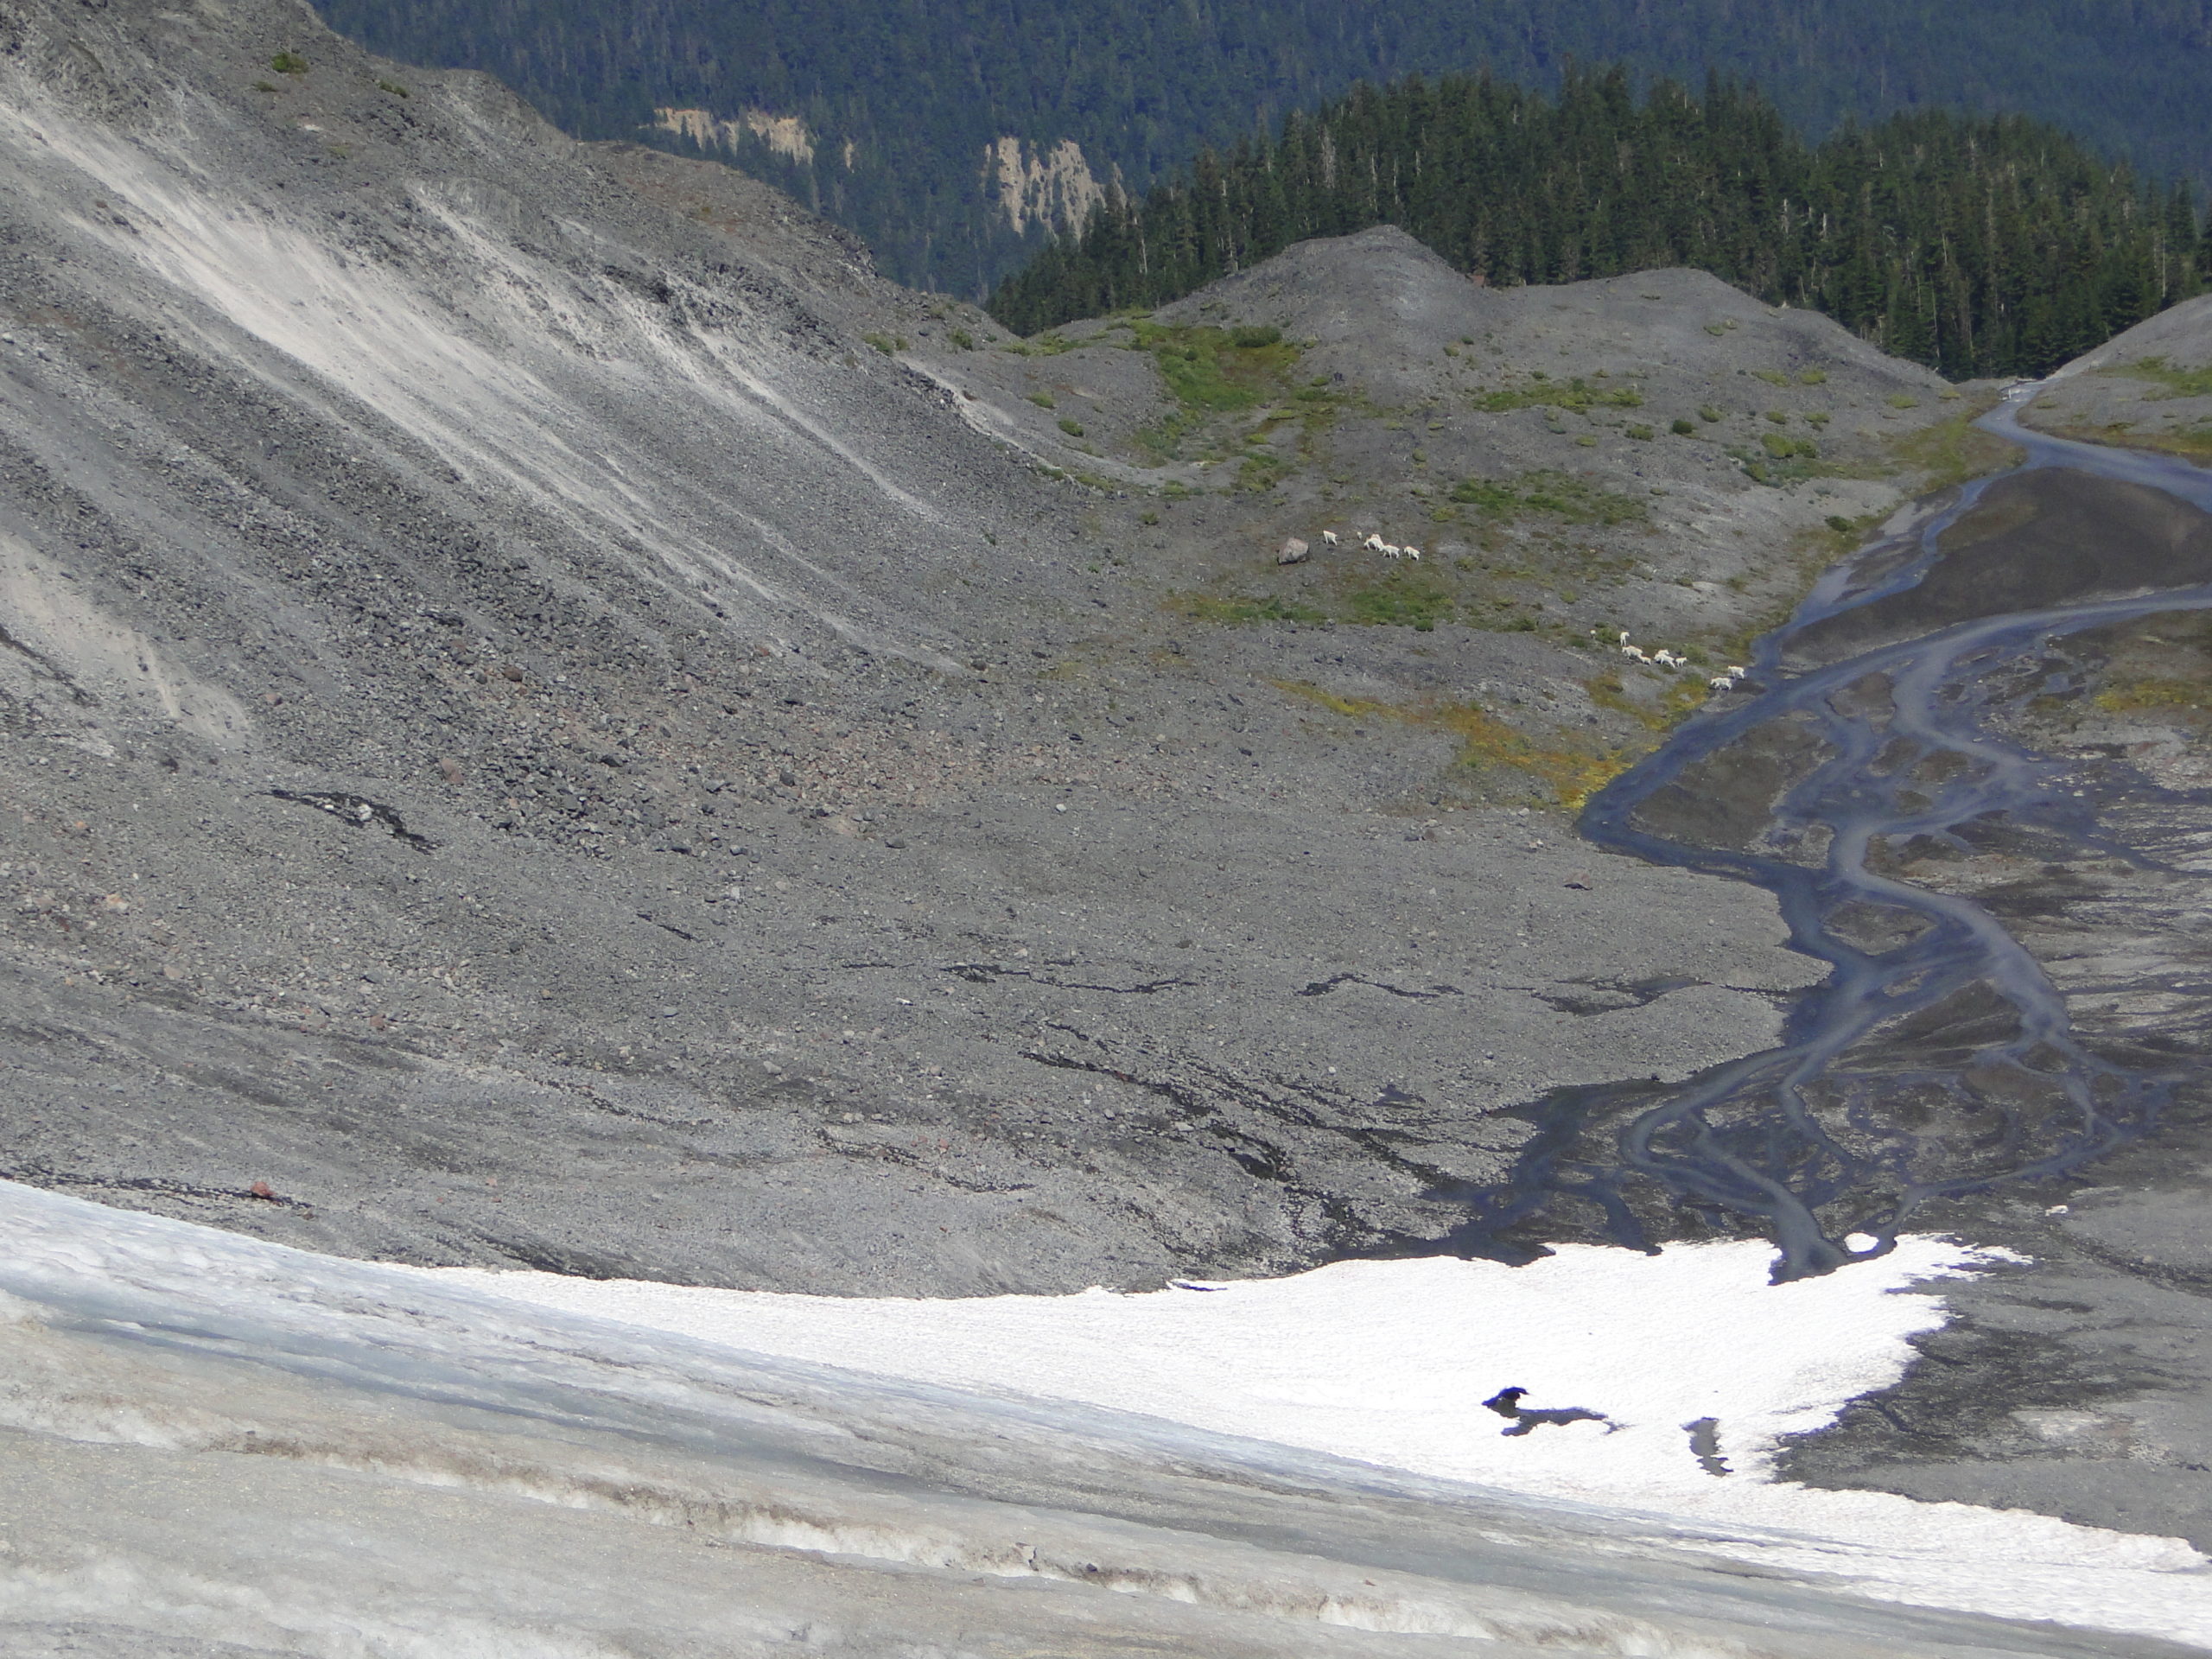
Mauri Pelto looking at deglaciated envioronment below Easton Glacier
Mariama Dryak-Vallies (she/her) is the Director for the Polar Science Early Career Community Office (PSECCO) hosted by CIRES at University of Colorado Boulder. Mariama grew up on a farm in west-central Wisconsin before earning her B.A. in physical geography and archaeology at Durham University (UK)—where her passion for studying, researching, and teaching about glaciers, climate change, and the natural environment was born. She completed her M.S. in Earth and Climate Sciences at the University of Maine, studying Antarctic glaciology and ice-ocean interactions. During graduate school she was actively involved advocating for polar early career scientists as board member and co-chair of the US Association of Polar Early Career Scientists (USAPECS). Mariama is passionate about working towards building accessible Earth and polar sciences spaces for all.
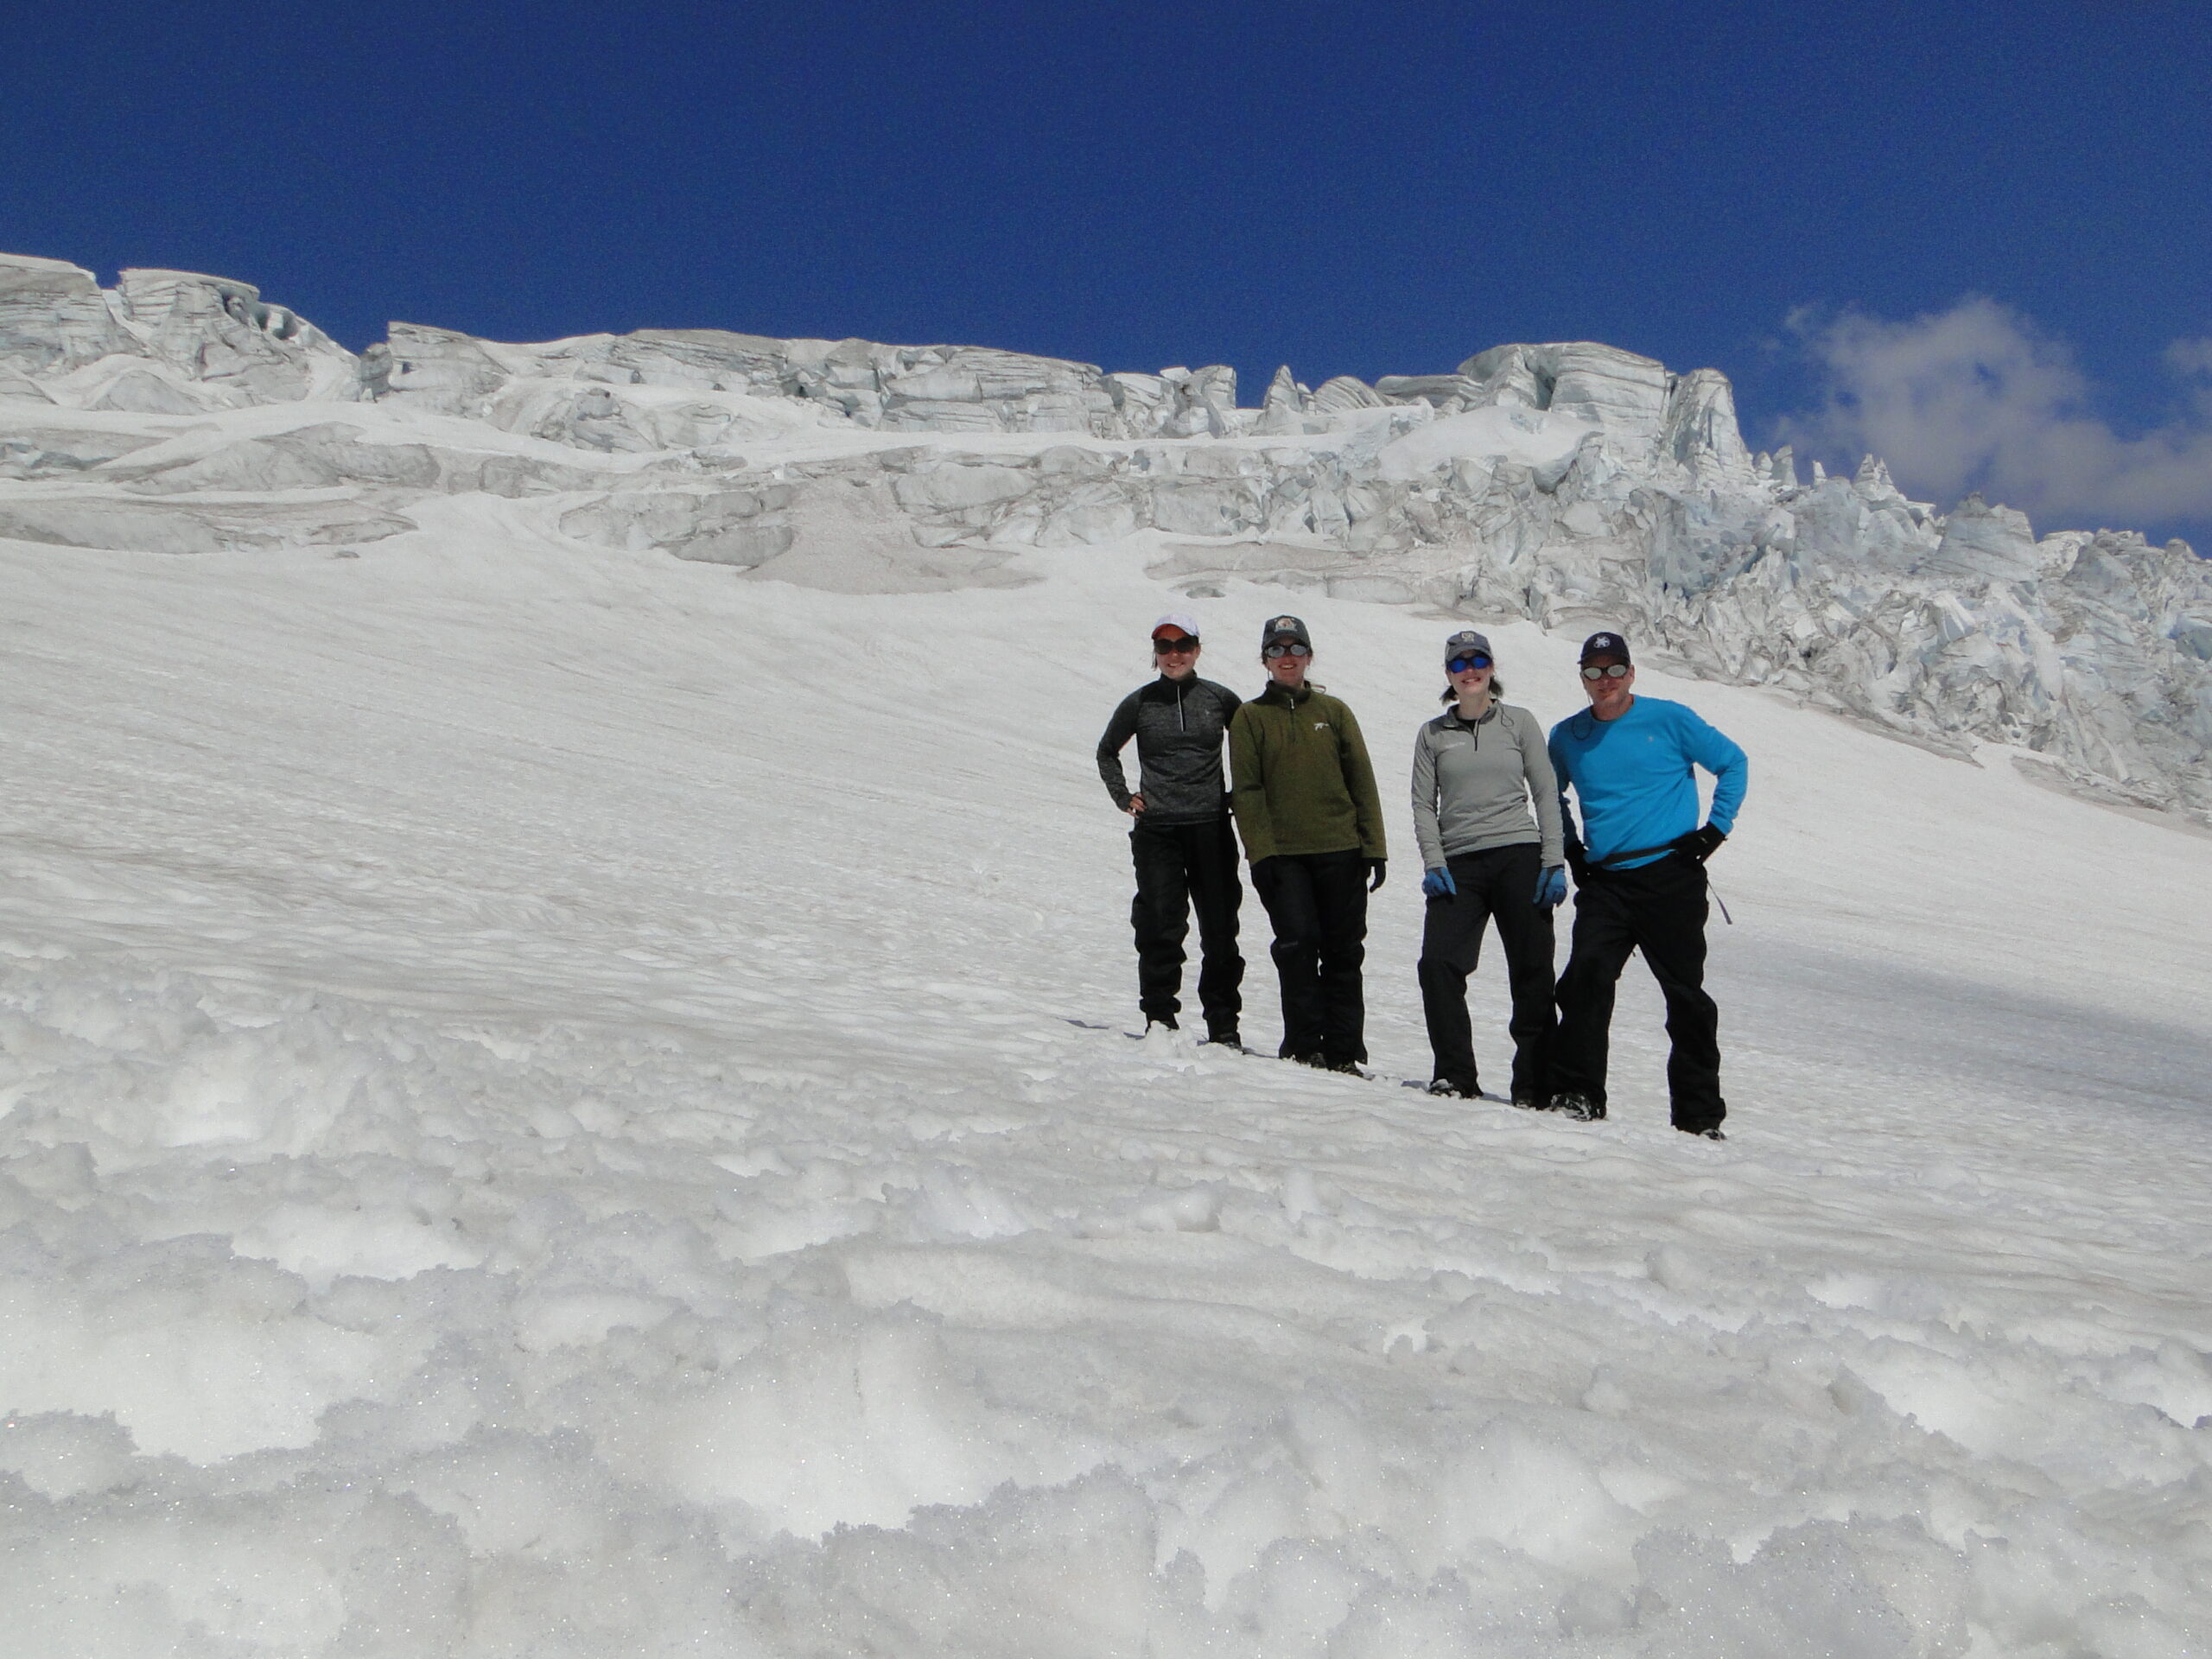
2018 field team including Jill, Mauri, Mariama and Erin
Kaiyuan Wang (he/him) is a recent graduate from McGill University with a B.Sc in Honours Physical Geography, a minor in Geology. Originally from China, he developed an aspiration for Geoscience in the Great White North while living on the former bed of the Laurentide Ice Sheet. His passion for the cryosphere has led him to fieldwork on glaciers in the Kluane National Park in Yukon, Jasper National Park in Alberta, and a glaciological conference in Iceland. He will be doing his Ph.D. in Arctic Hydrology at the Northern Change Research Laboratory at Brown University. Kai is thrilled to be part of the 40-year-long effort of documenting glaciers as a living testimony to a warming world.
Shivaprakash Muruganandham (he/him) is currently a PhD candidate in Ocean Science and Engineering at the Georgia Institute of Technology, Atlanta, USA. He is back in school after a few years as a strategy consultant, during which time he specialized in satellites and space applications: earth observation and satellite communications in particular. Prior to this, he graduated with Master’s degrees in Space Technology and Cybernetic Systems/Control. Shiva is fascinated by ice, and his research focus on ice sheet/glacier modeling is motivated by his interests in the downstream impacts of cryosphere-climate interactions on coastal and mountain communities..
Field Partners 2023
Lizz Ultee (she/they) is an Assistant Professor of Earth & Climate Science at Middlebury College, Vermont. They earned a B.Sc. in mathematical physics at Queen’s University (Canada) and a Ph.D. in climate science at the University of Michigan, specializing in mathematical methods to understand and predict glacier change. Lizz finds ice endlessly inspiring. Beyond inspiring, though, glaciers are important for downstream communities — motivating Lizz’s present research focus on glacier contributions to sea-level rise and water resource availability.
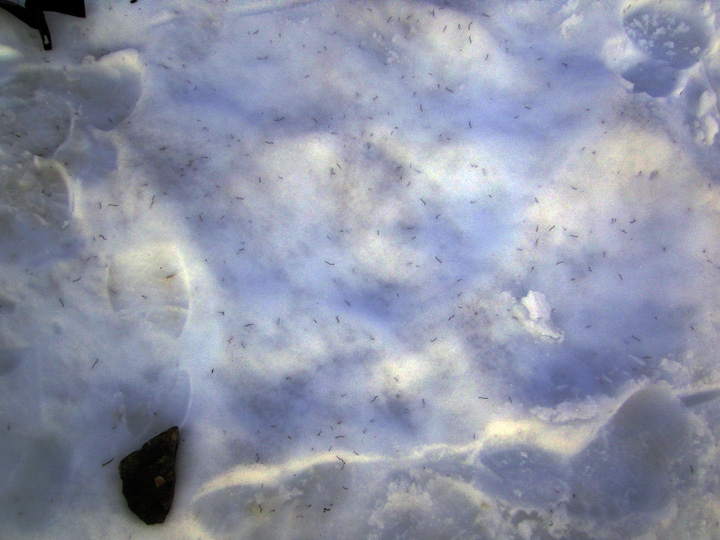
Alia Khan’s research team including grad students Sally Vaux, Colby Rand, and Anne Wilce focus on environmental chemistry in the cryosphere, including black carbon and snow algae to document global change of glacier and snow melt in mountainous and polar regions.Western Washington University Cryosphere Studies and Aquatic Biochemistry Lab.
Claire Giordano is an environmental artist, writer, and educator creatively telling the stories of science, climate change, and the modern experience of nature. From creating rain-dappled sketches in an old growth forest to filming a watercolor class beside a glacier, careful observation of nature inspires her goal is to connect people and place through art. In 2021 she founded the Adventure Art Academy – a series of virtual watercolor classes filmed outside – to invite others into the joy of painting outside.

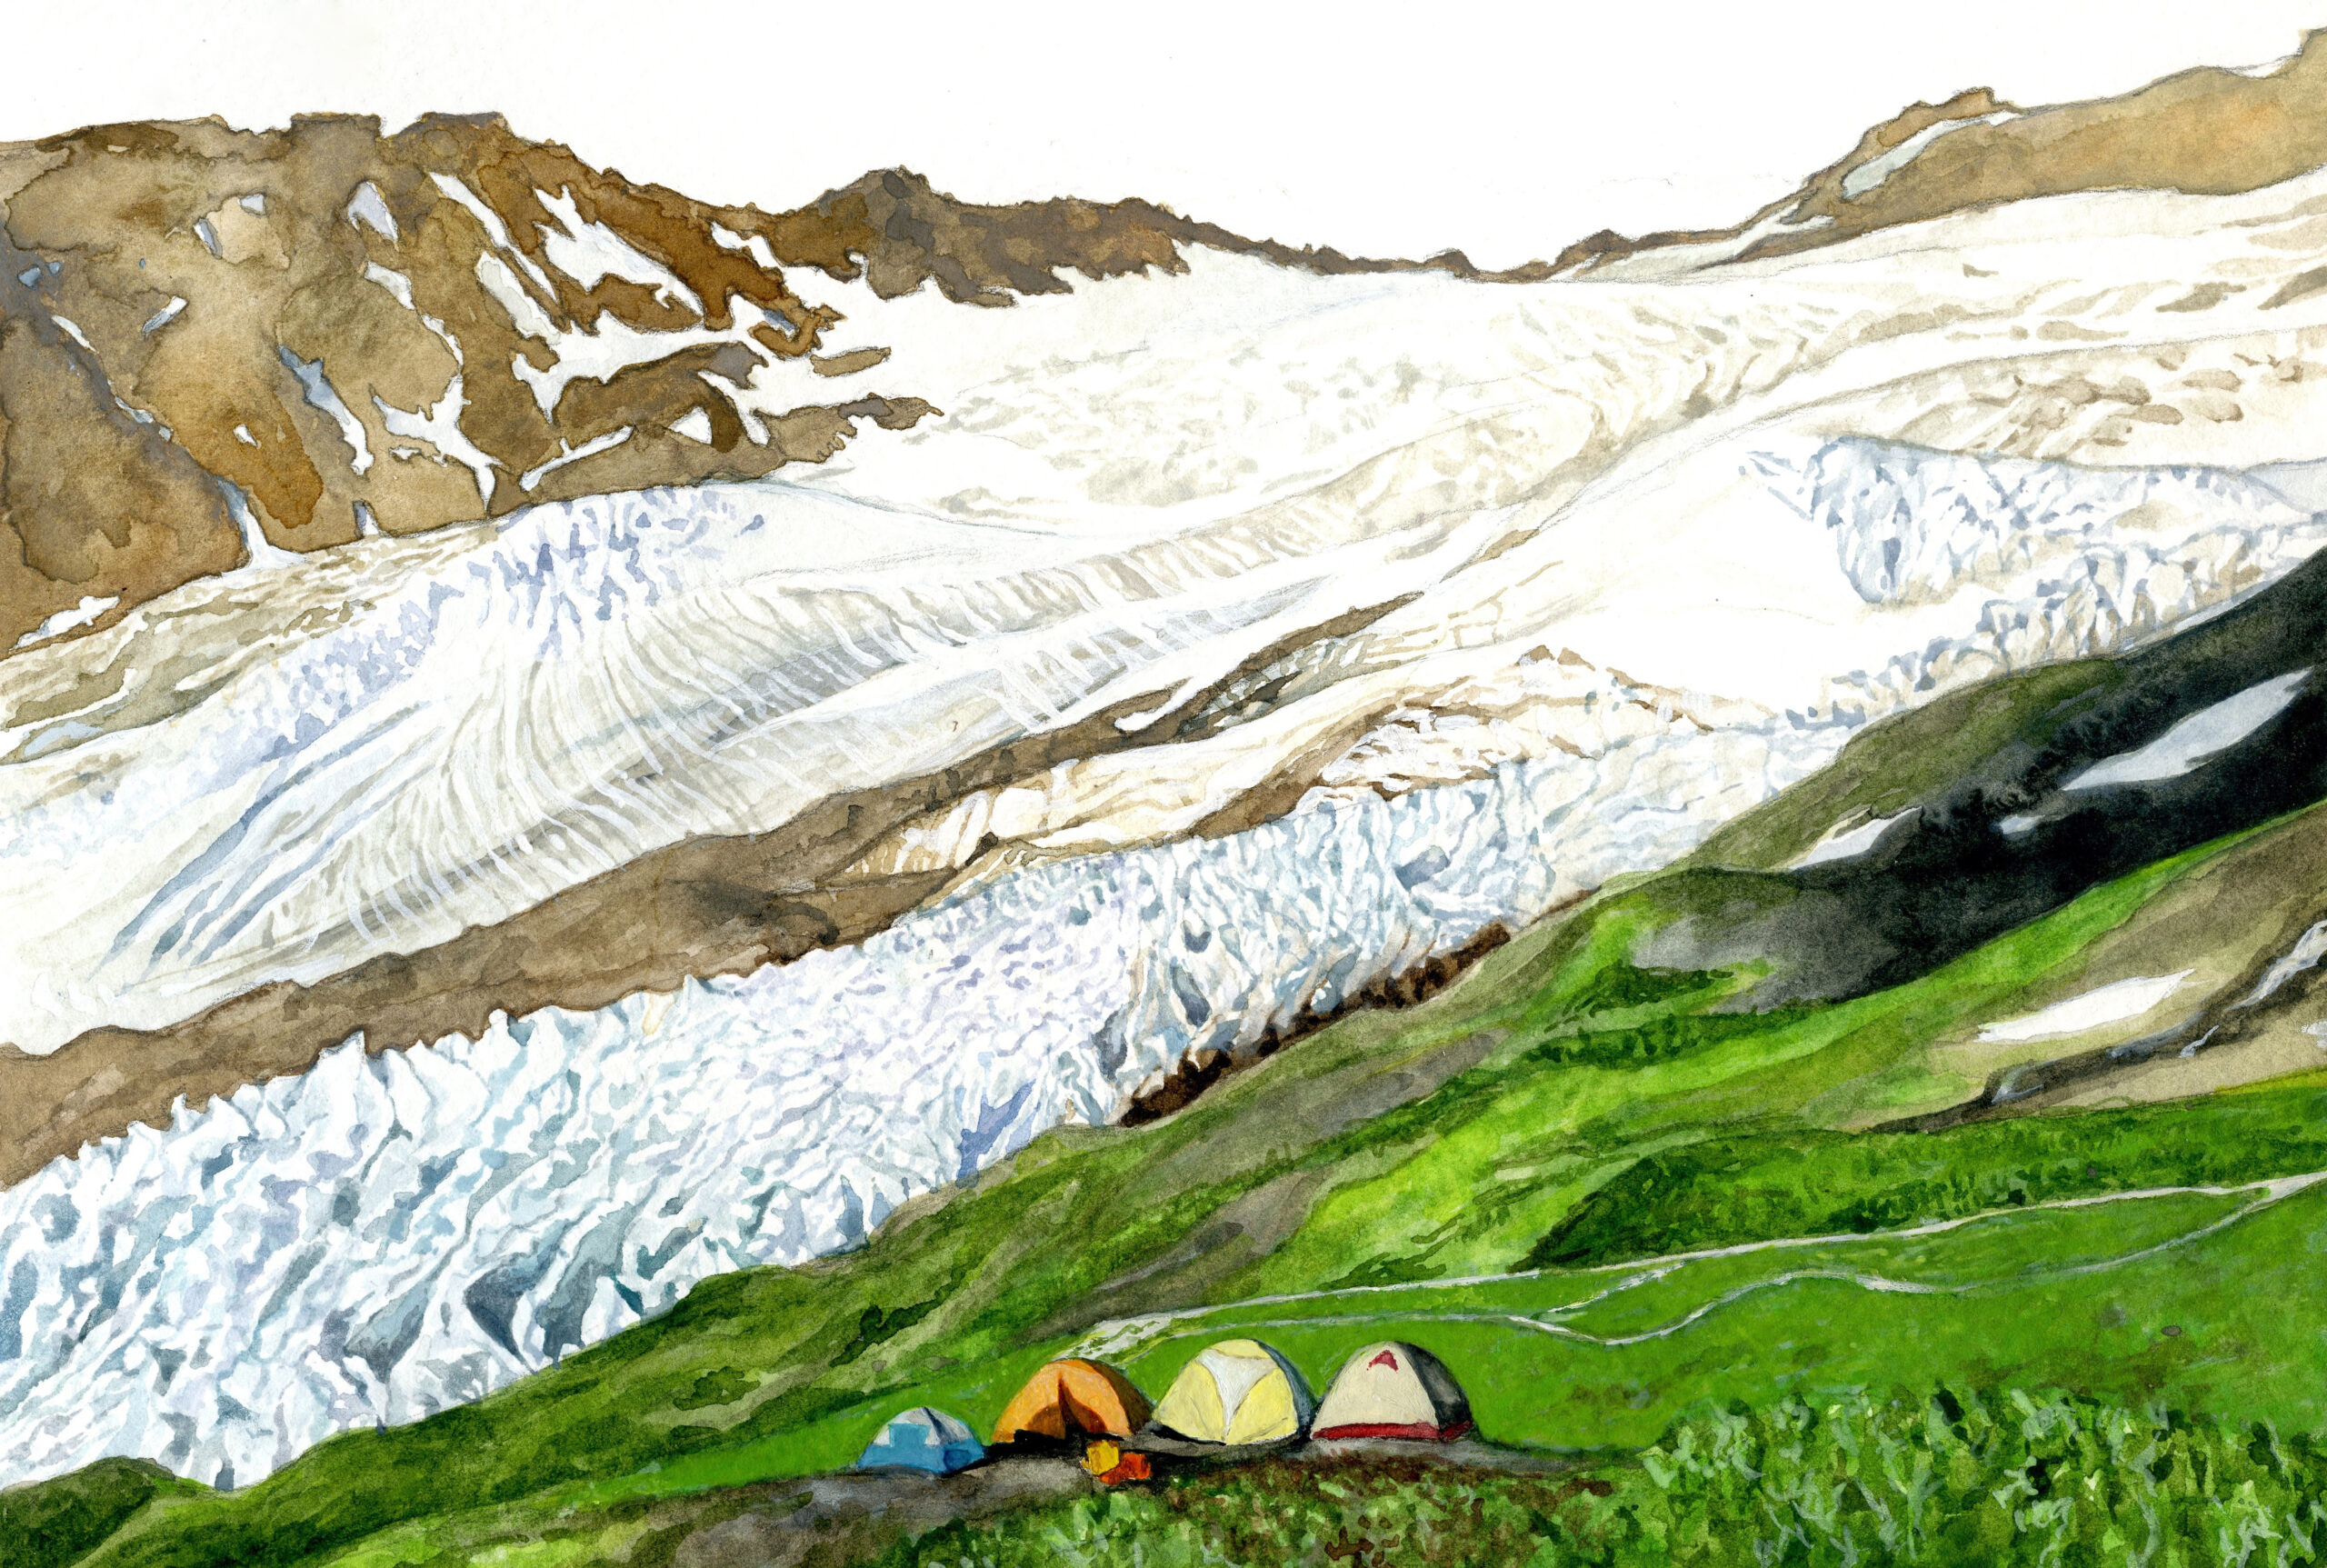
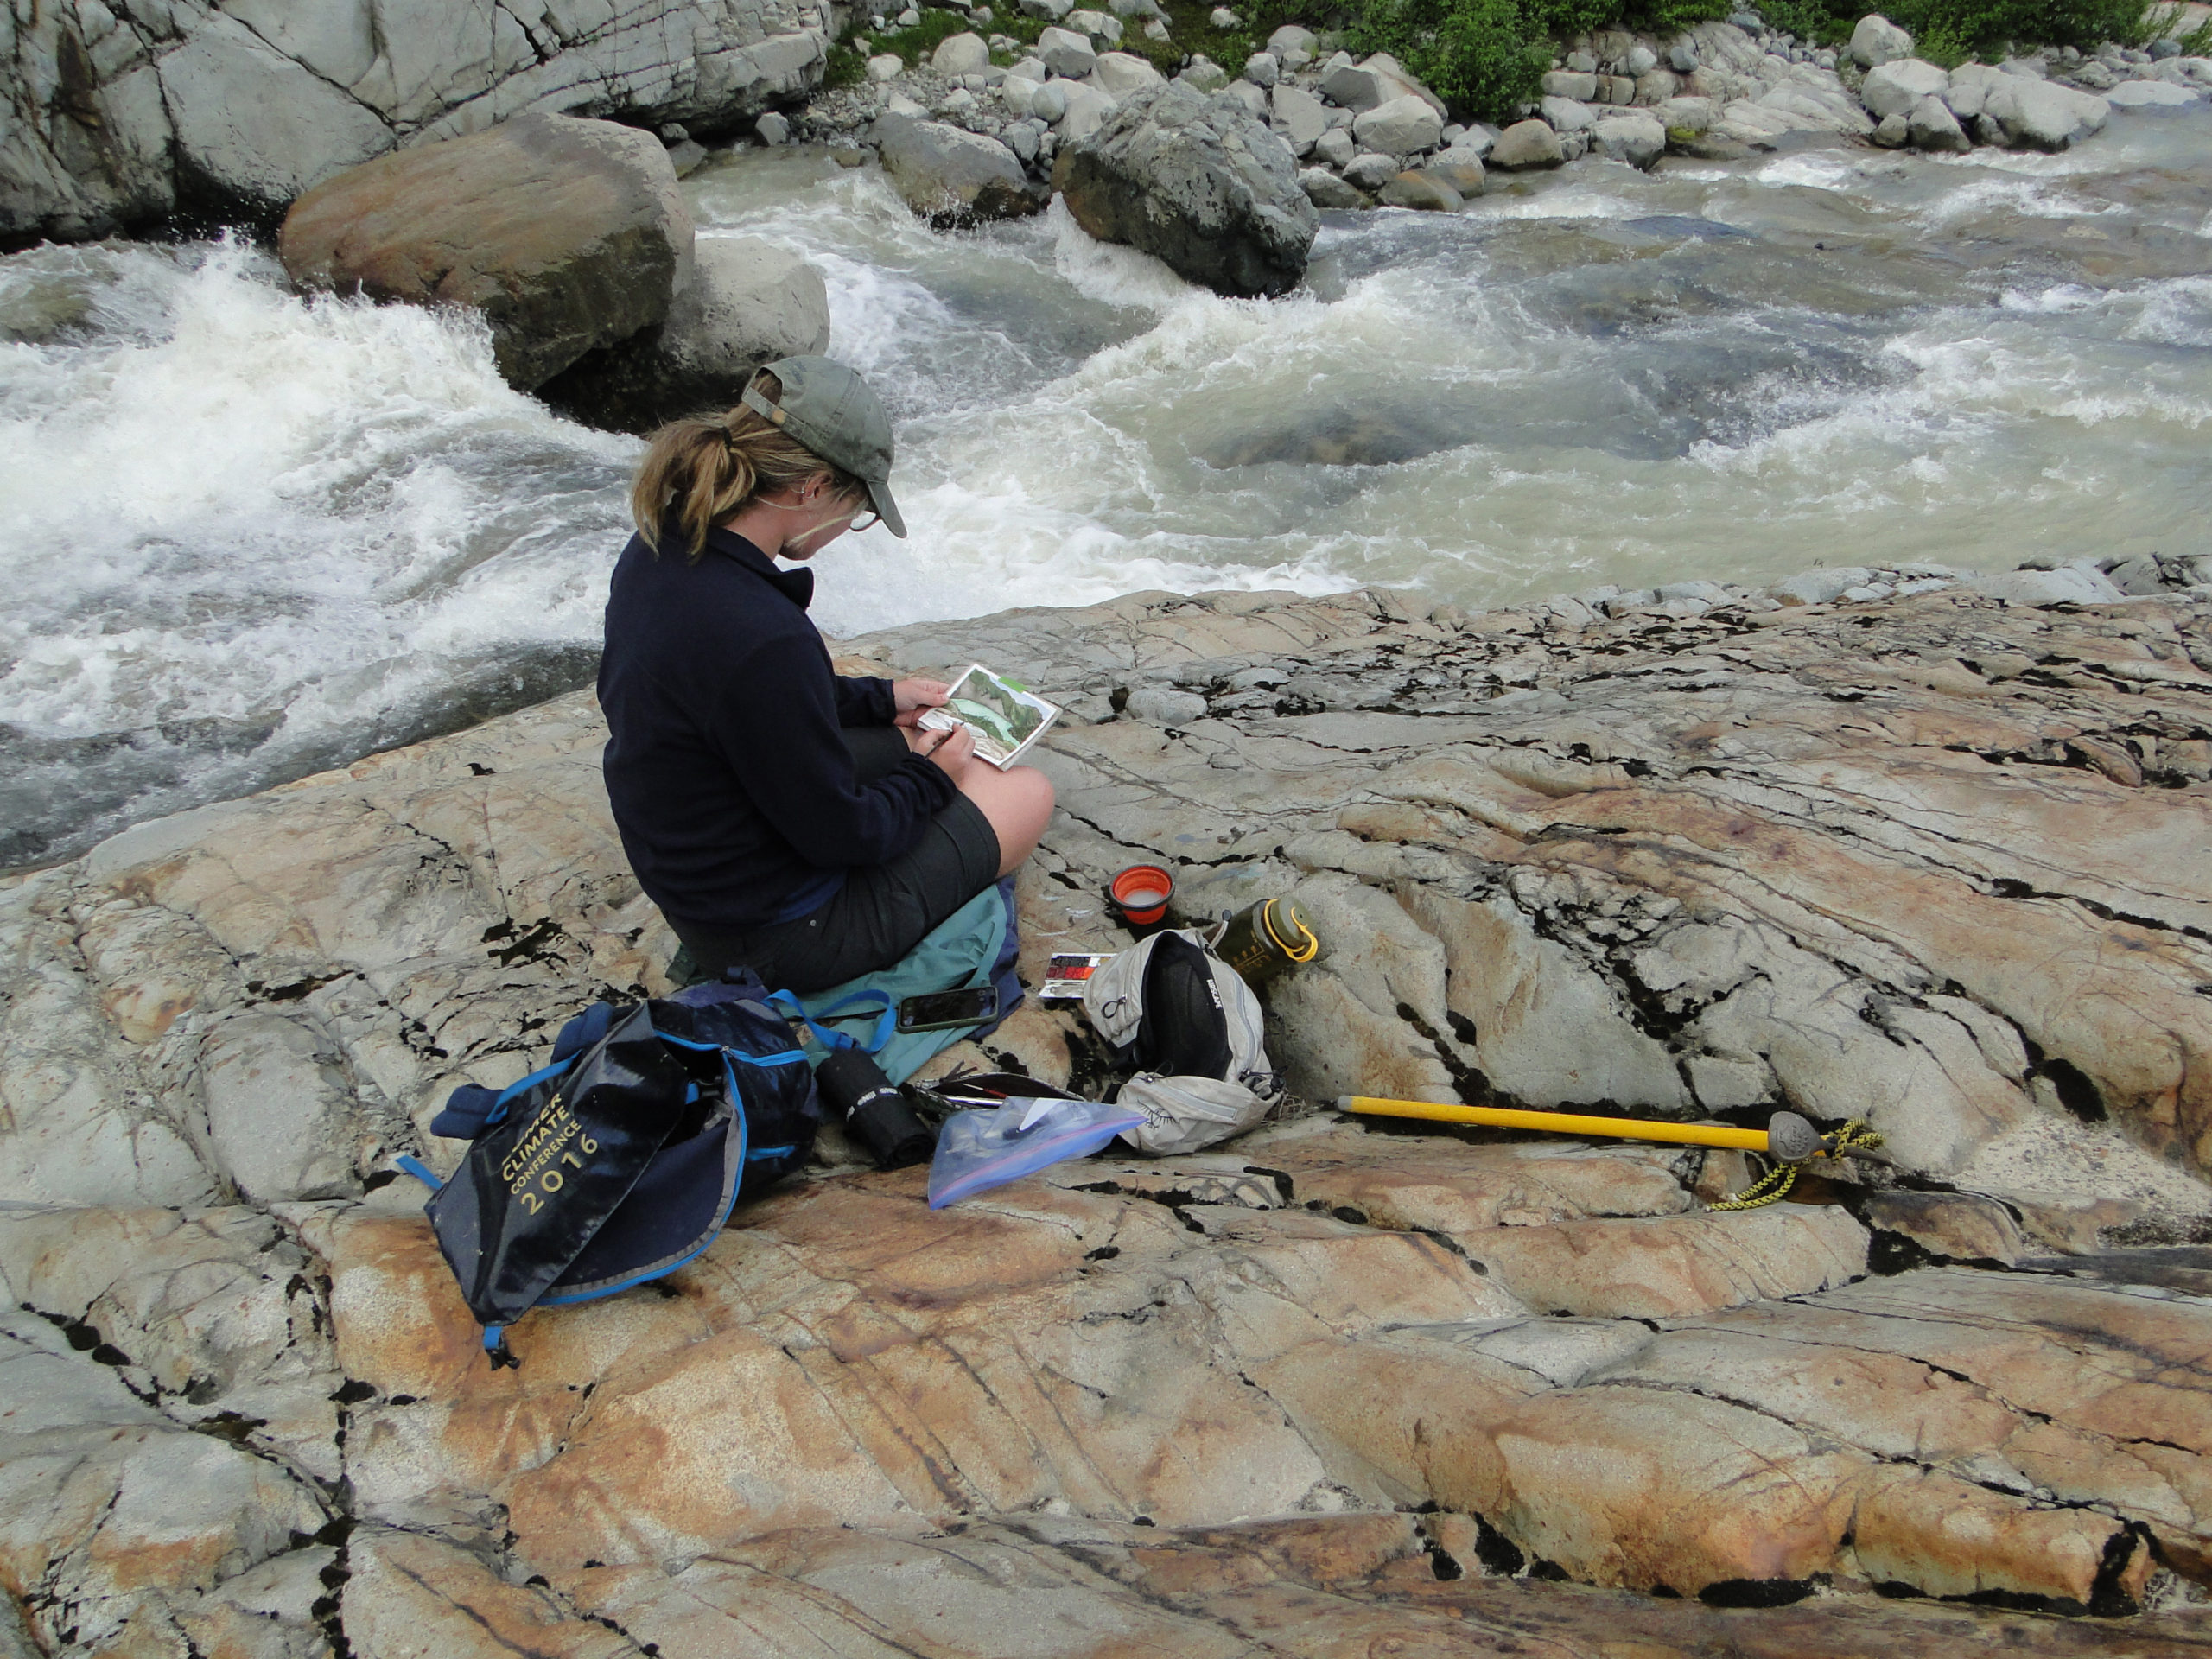
Field study by Claire Giordano, artist in residence with the NCGCP for her 4th year. She creates these incredible pages with notes, paintings, and sketches from her days out exploring the landscape.
Kathleen Shannon is a freelance journalist & radio producer telling science and environmental justice stories across the West. She is based in Missoula and earned a master’s degree in Environmental Science and Natural Resource Journalism from the University of Montana in 2023. Her work has appeared on NPR, in High Country News and elsewhere.
Julia Ditto is a science illustrator from Anchorage, Alaska who specializes in environmental and ecological graphics. Julia spends much of her time recreating in the backcountry, which inspires much of her work. She has always used art as a tool for observing and communicating her experiences, both inand out of the field. She is currently attending CSU Monterey Bay’s Graduate Science Illustration Program.
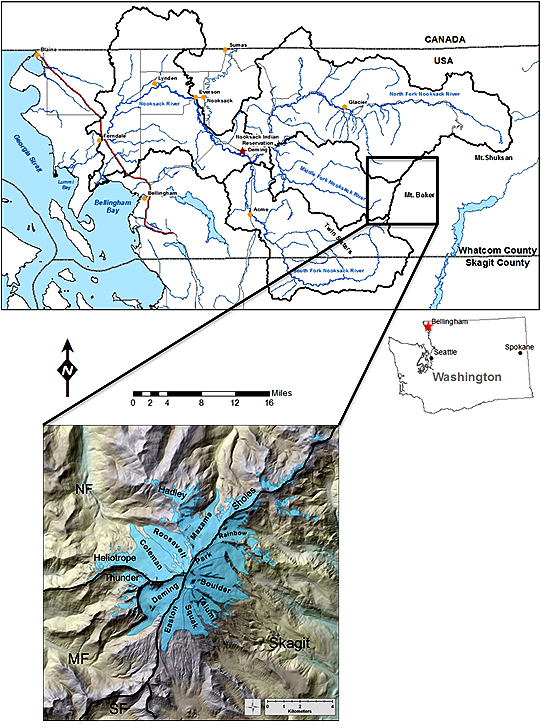
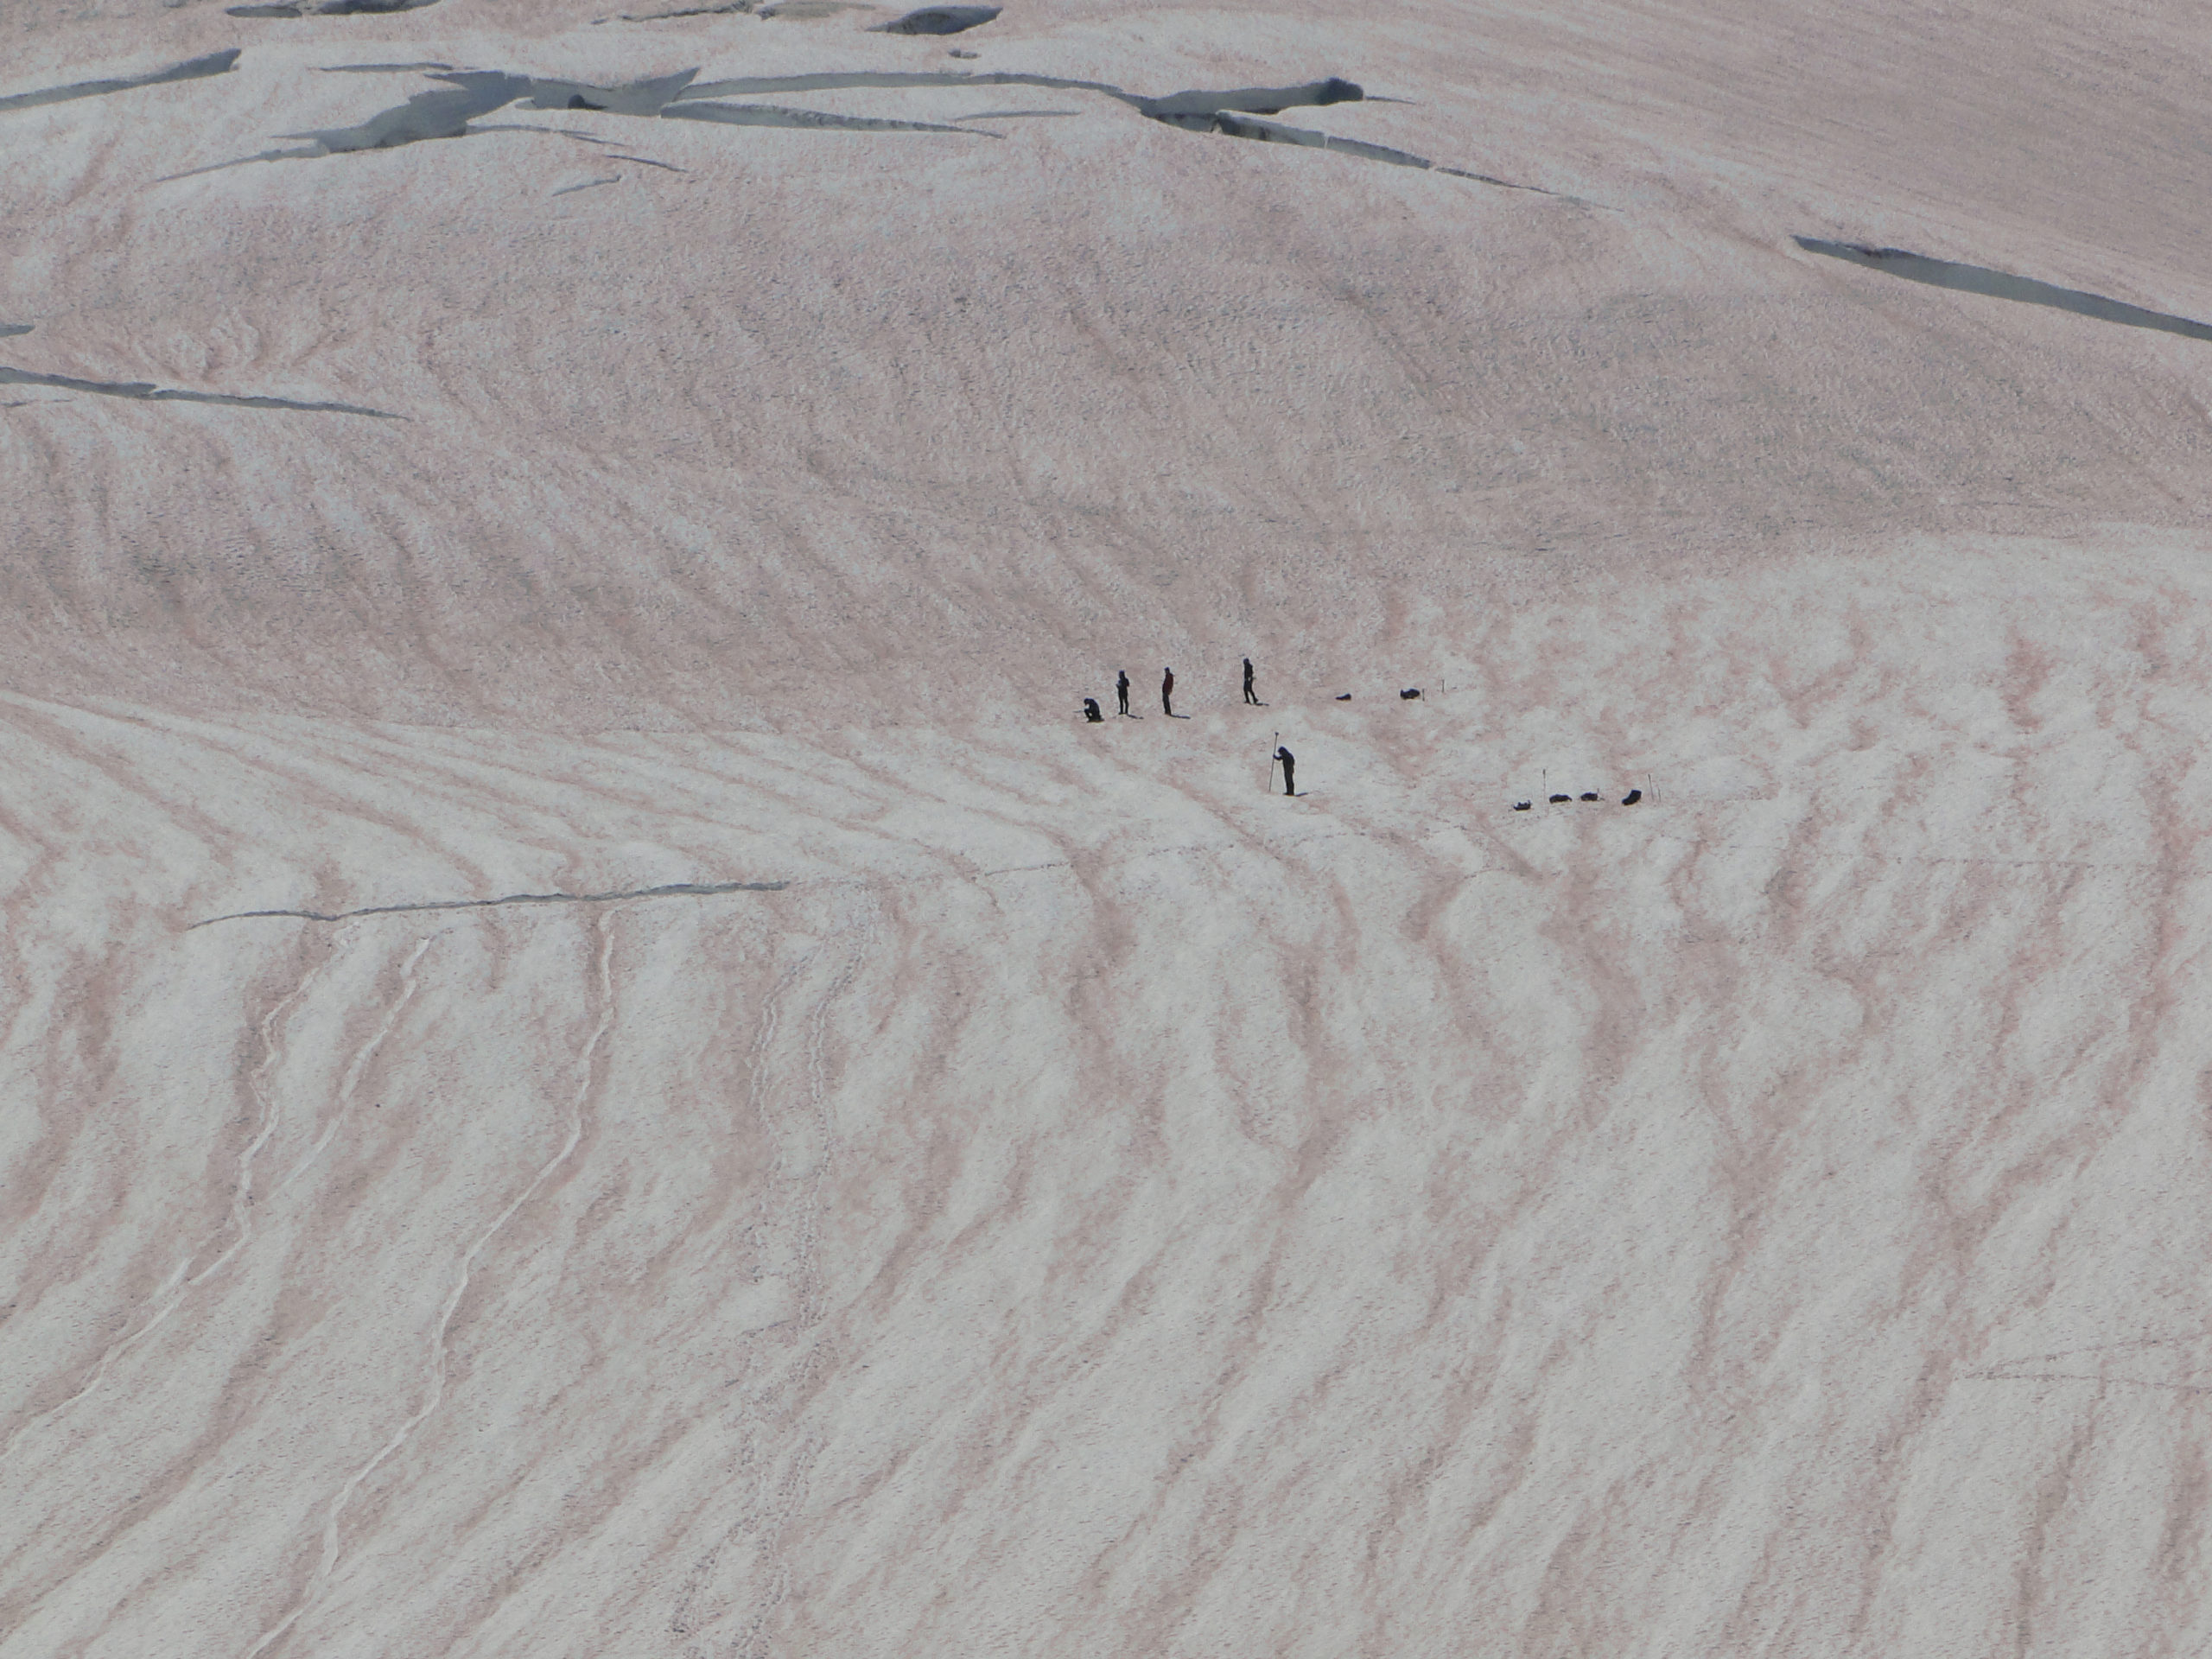
Who are we? NCGCP was founded in 1983 to identify and communicate the response of North Cascade glaciers to regional climate change. NCGCP is a field project including scientists and artists that has a broad interdisciplinary scope and examines more glaciers than any other program in North America. We do so cost effectively relying on no permanent camps or helicopter support. The field season includes no days off and each day is spent completing measurements on glaciers. The focus is on glacier mapping, mass balance measurement, terminus observations, glacier runoff monitoring and capturing the environment with art.
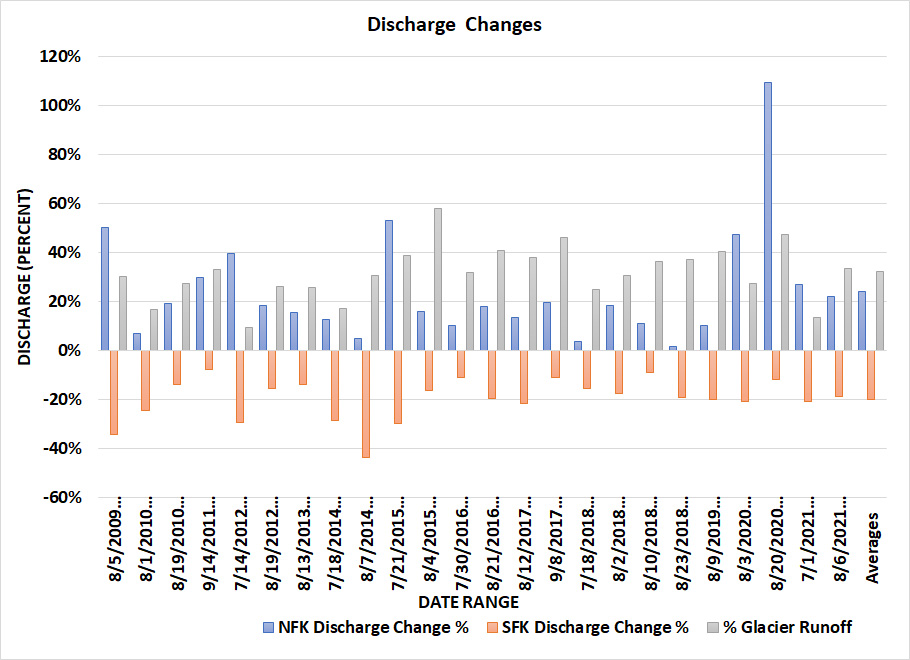
Why study glaciers in the North Cascades? Glaciers are one of the world’s best climate monitors and are a critical water resource to many populated glaciated regions. This is particularly true in the North Cascades where 700 glaciers yield 200 billion gallons of summer runoff and glaciers have lost 30 % of their area in the last century. This has reduced glacier runoff in late summer in the region as the reduction in glacier area has exceeded the increase in melt rate. During heat waves this role is even more profound with the glacier fed North Fork Nooksack River discharge rising ~24% due to greater melt, while unglaciated South Fork Nooksack River discharge declines by ~20%. The increased discharge limits the rise in river temperature during heat waves to 0.7 C in the North Fork, with the South Fork increasing by 2 C, increasing stress on the salmon in the South Fork (Pelto et al., 2022).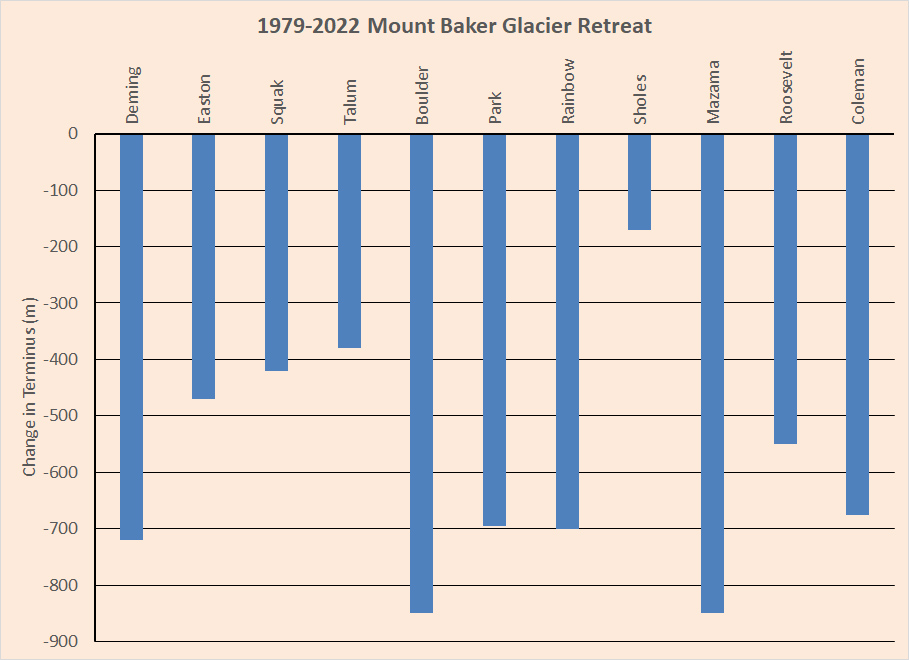
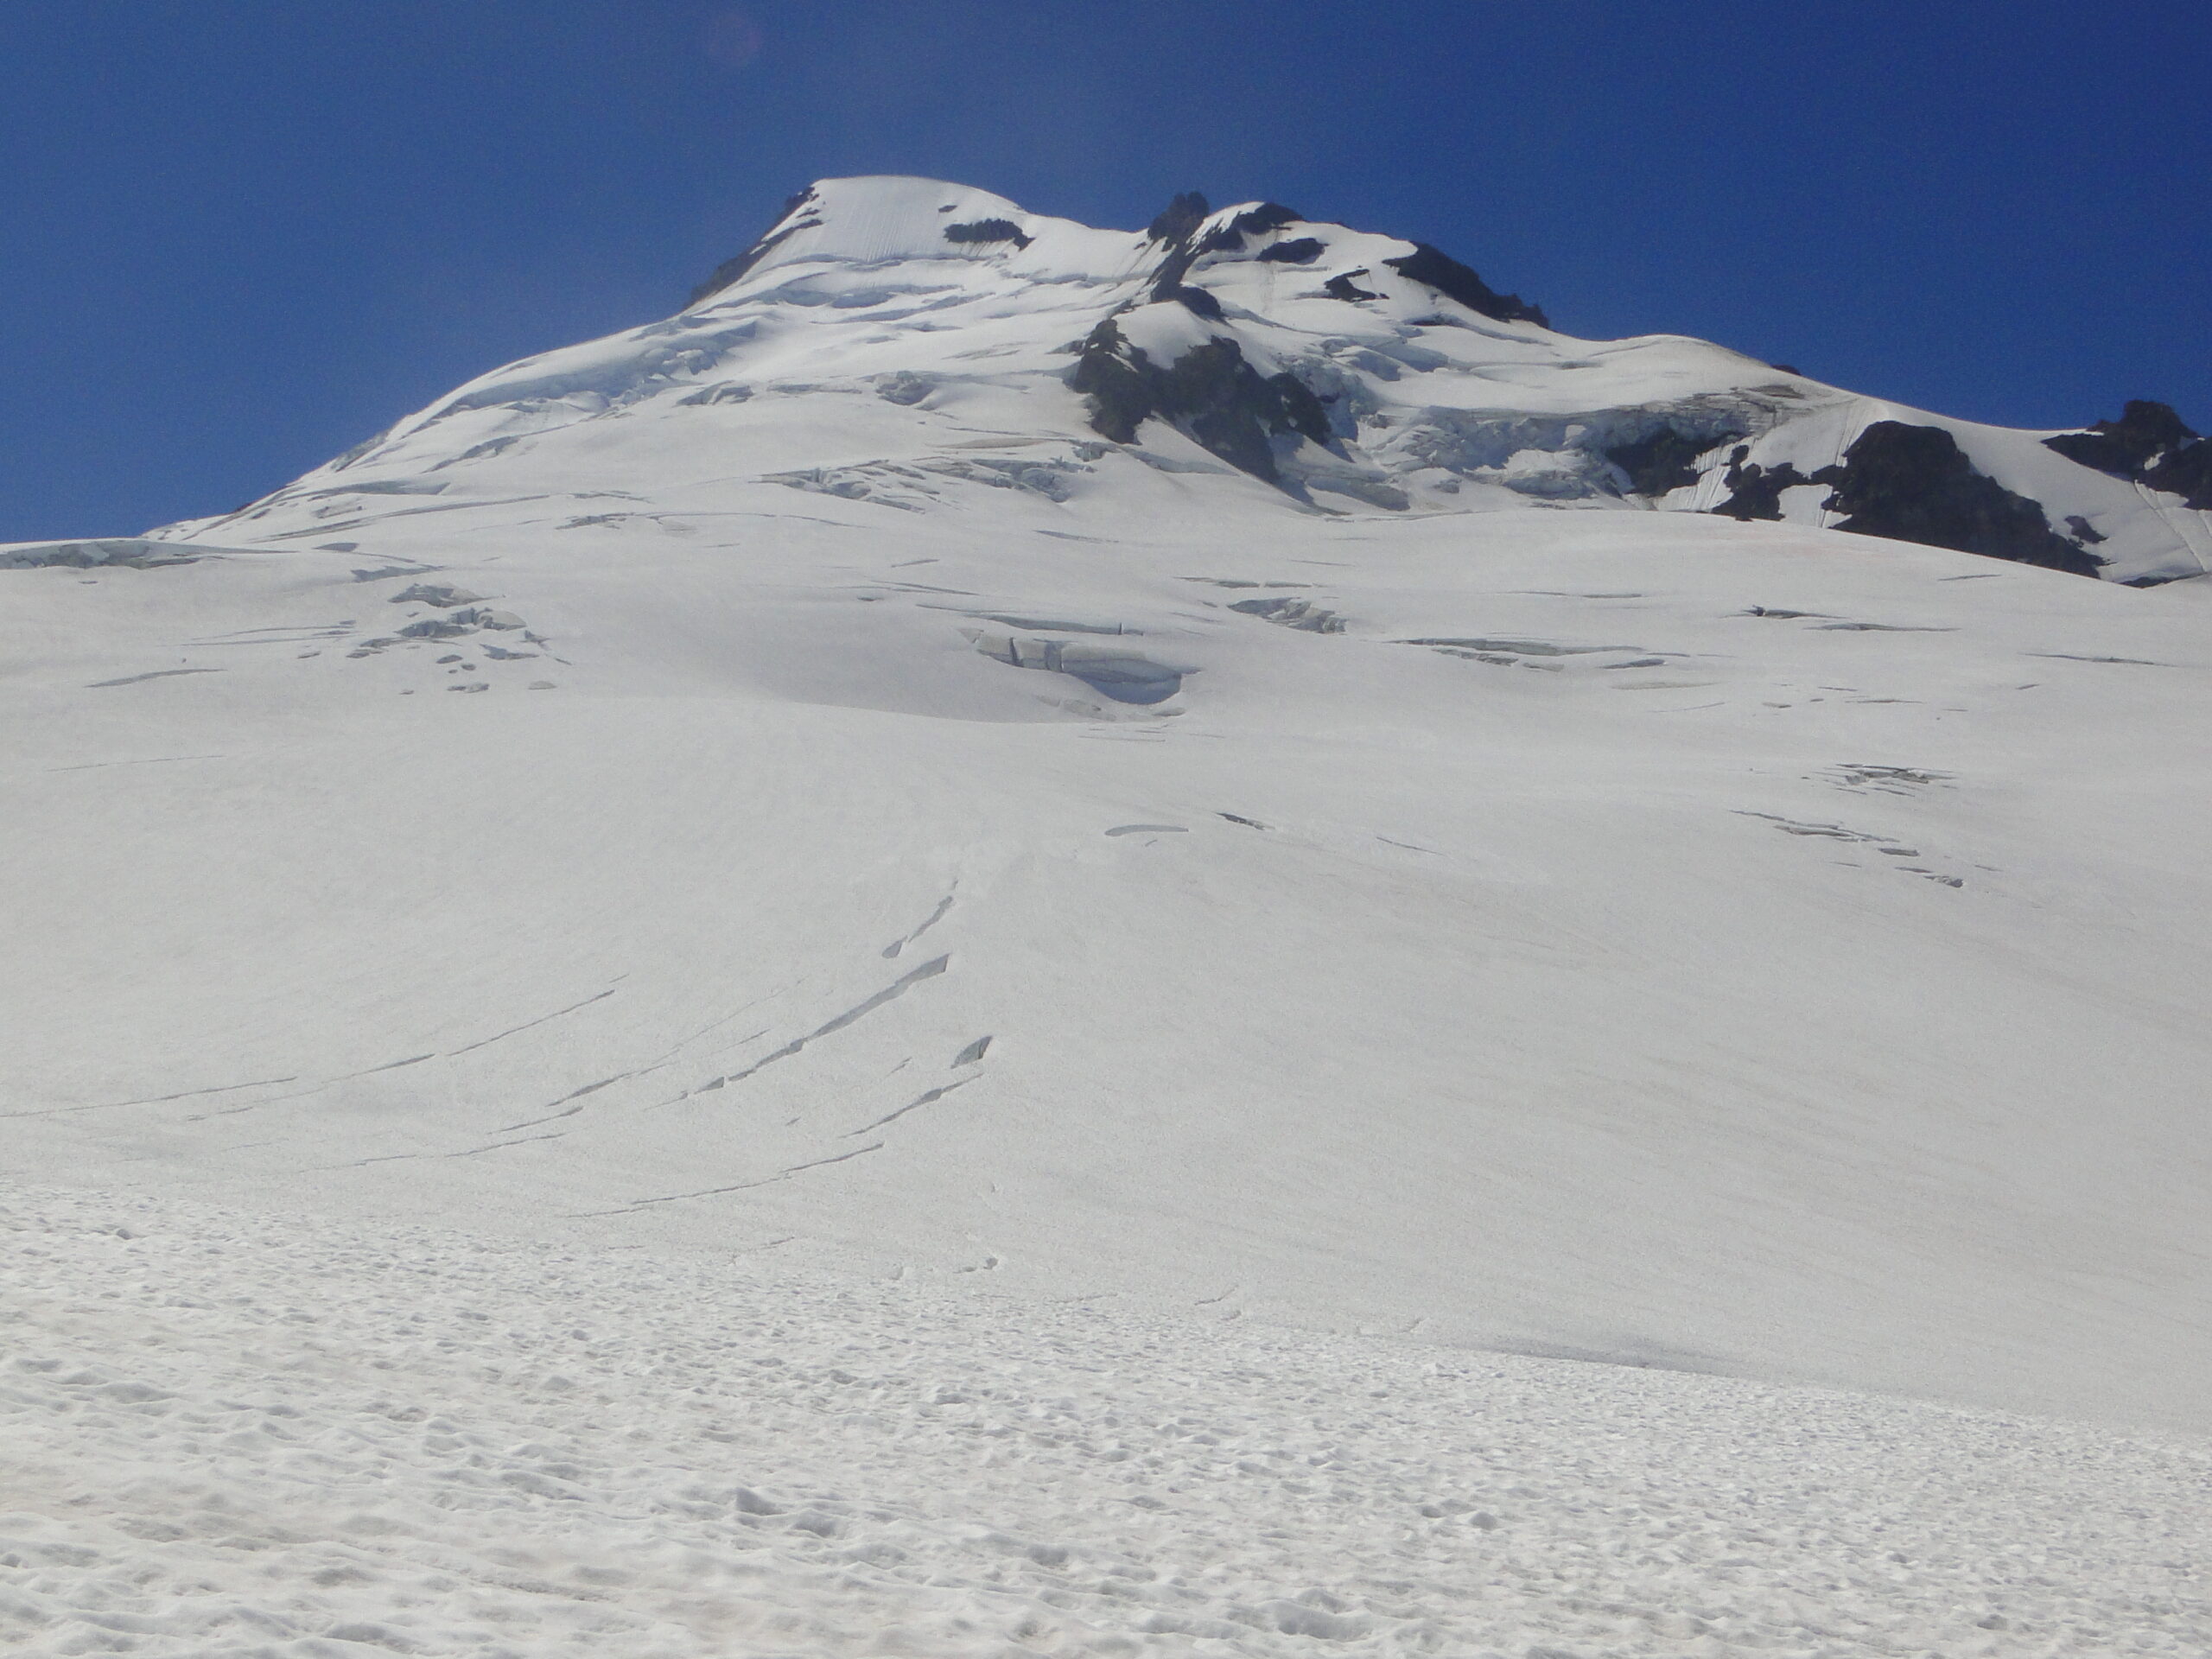
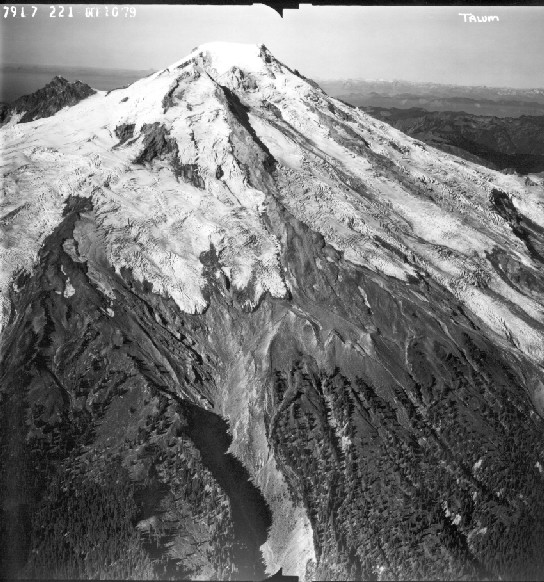
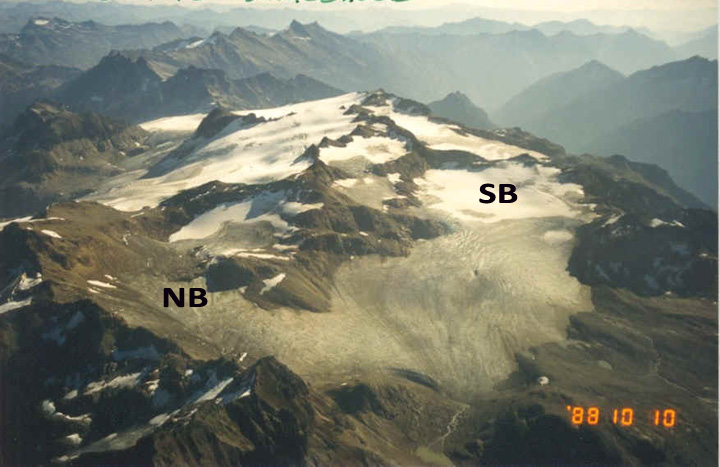
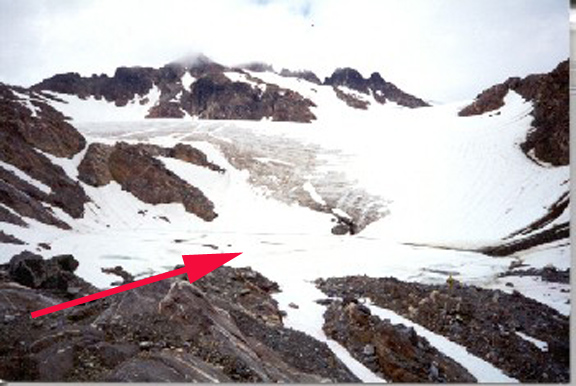
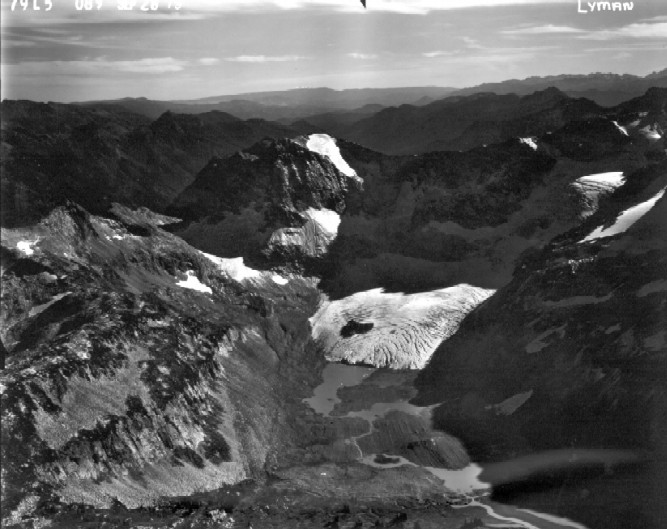
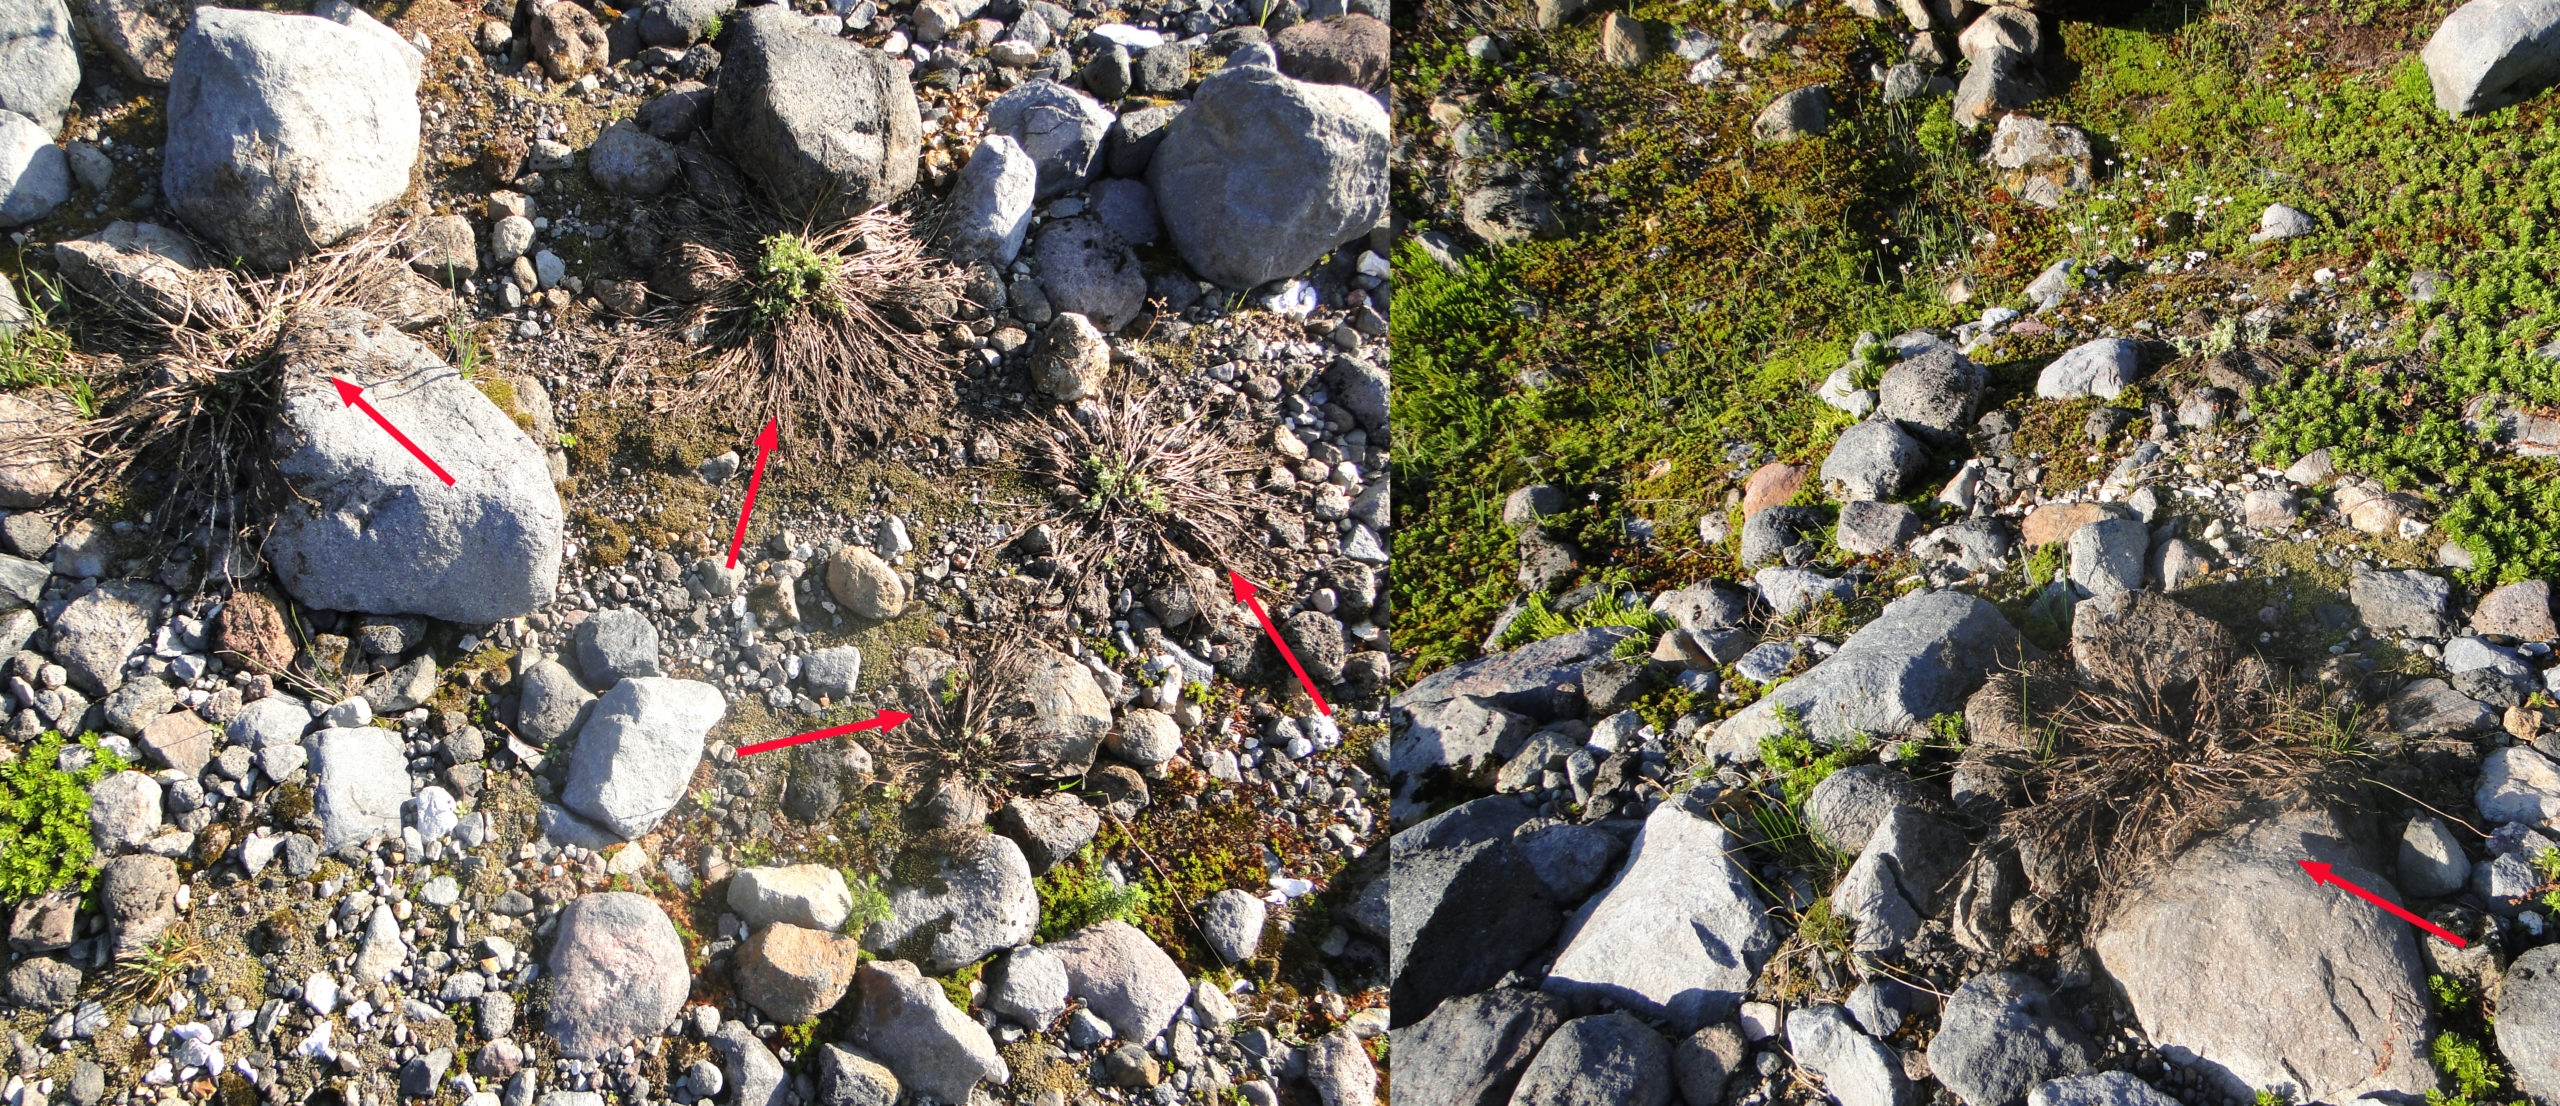
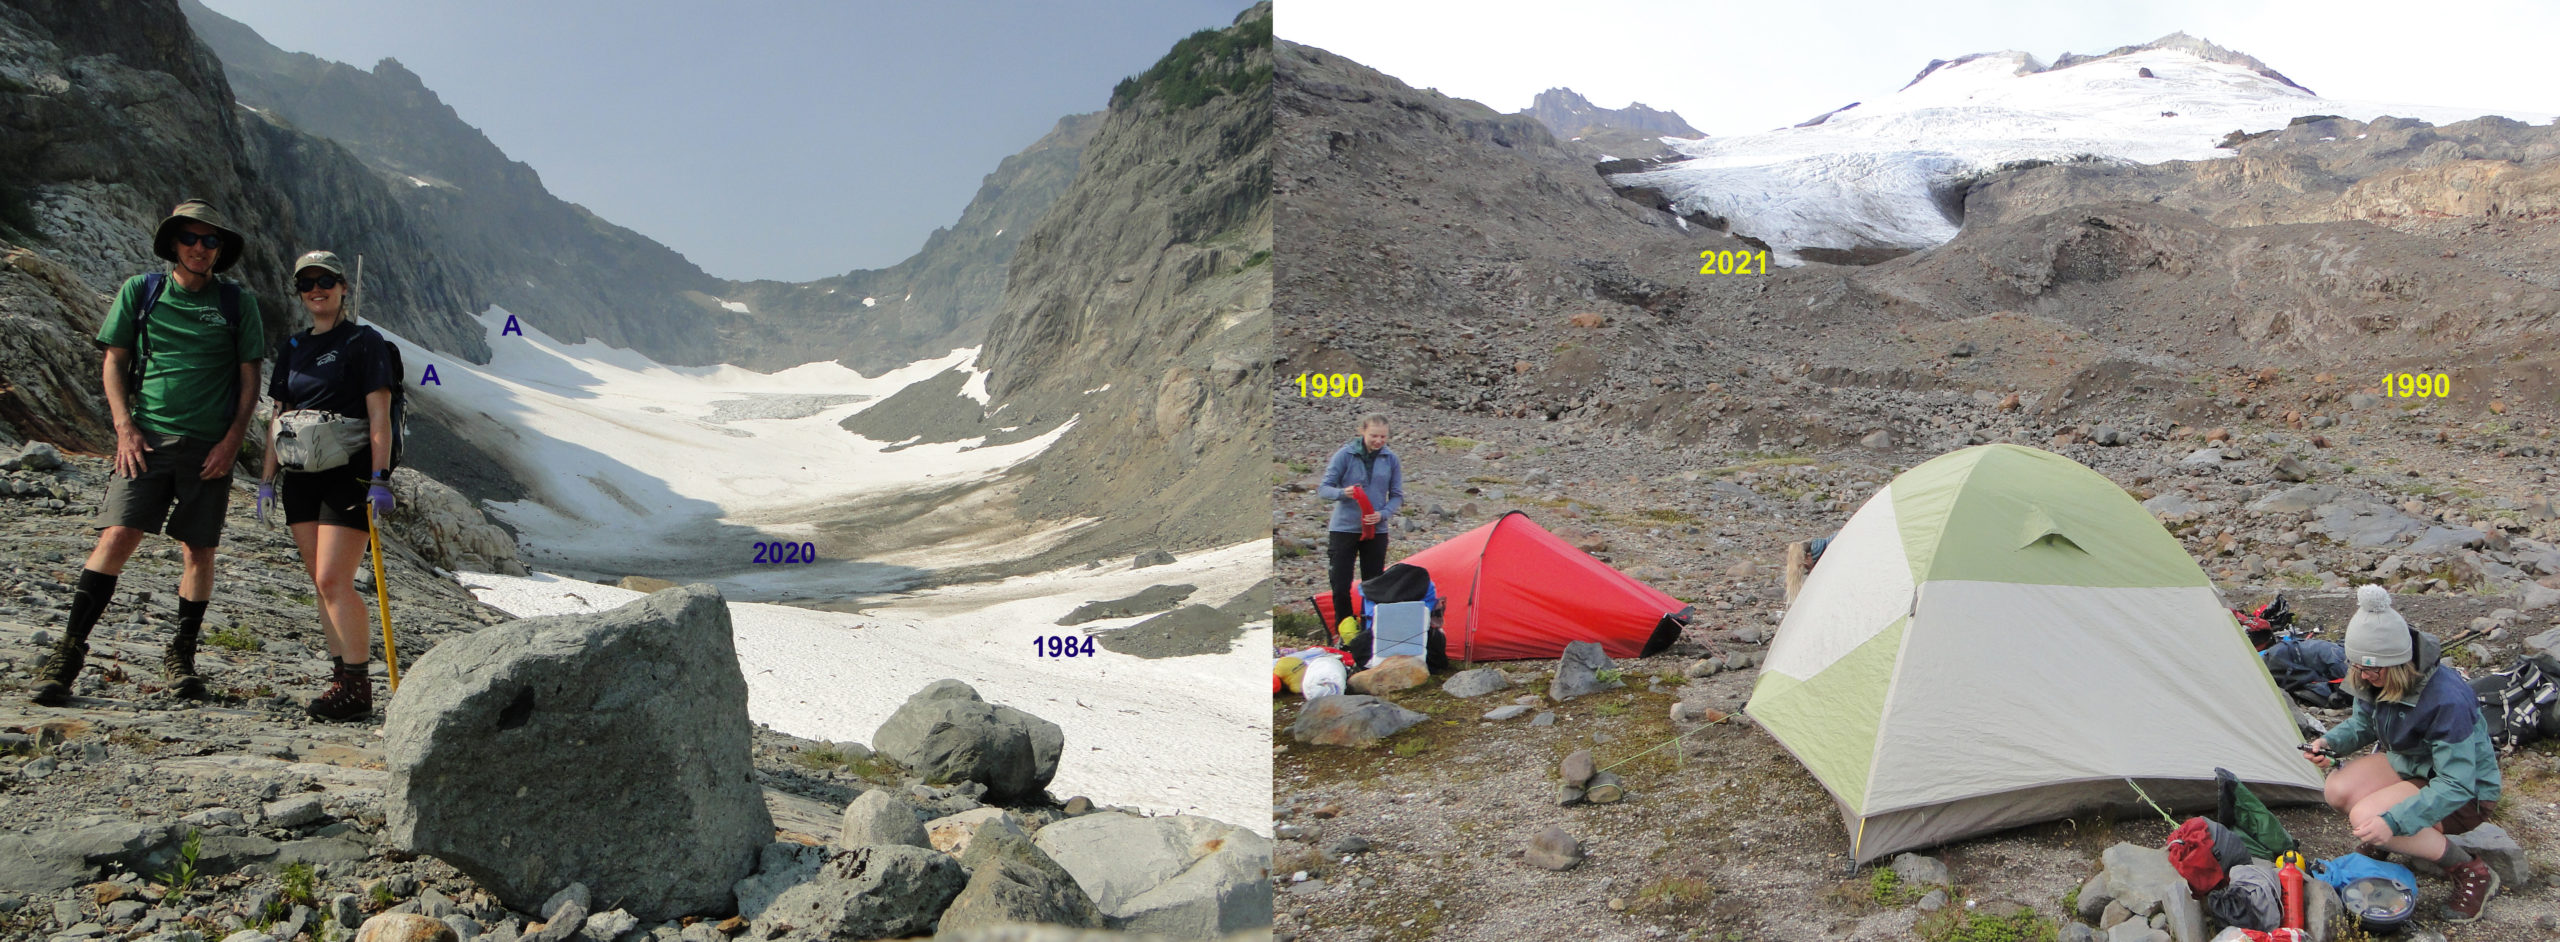
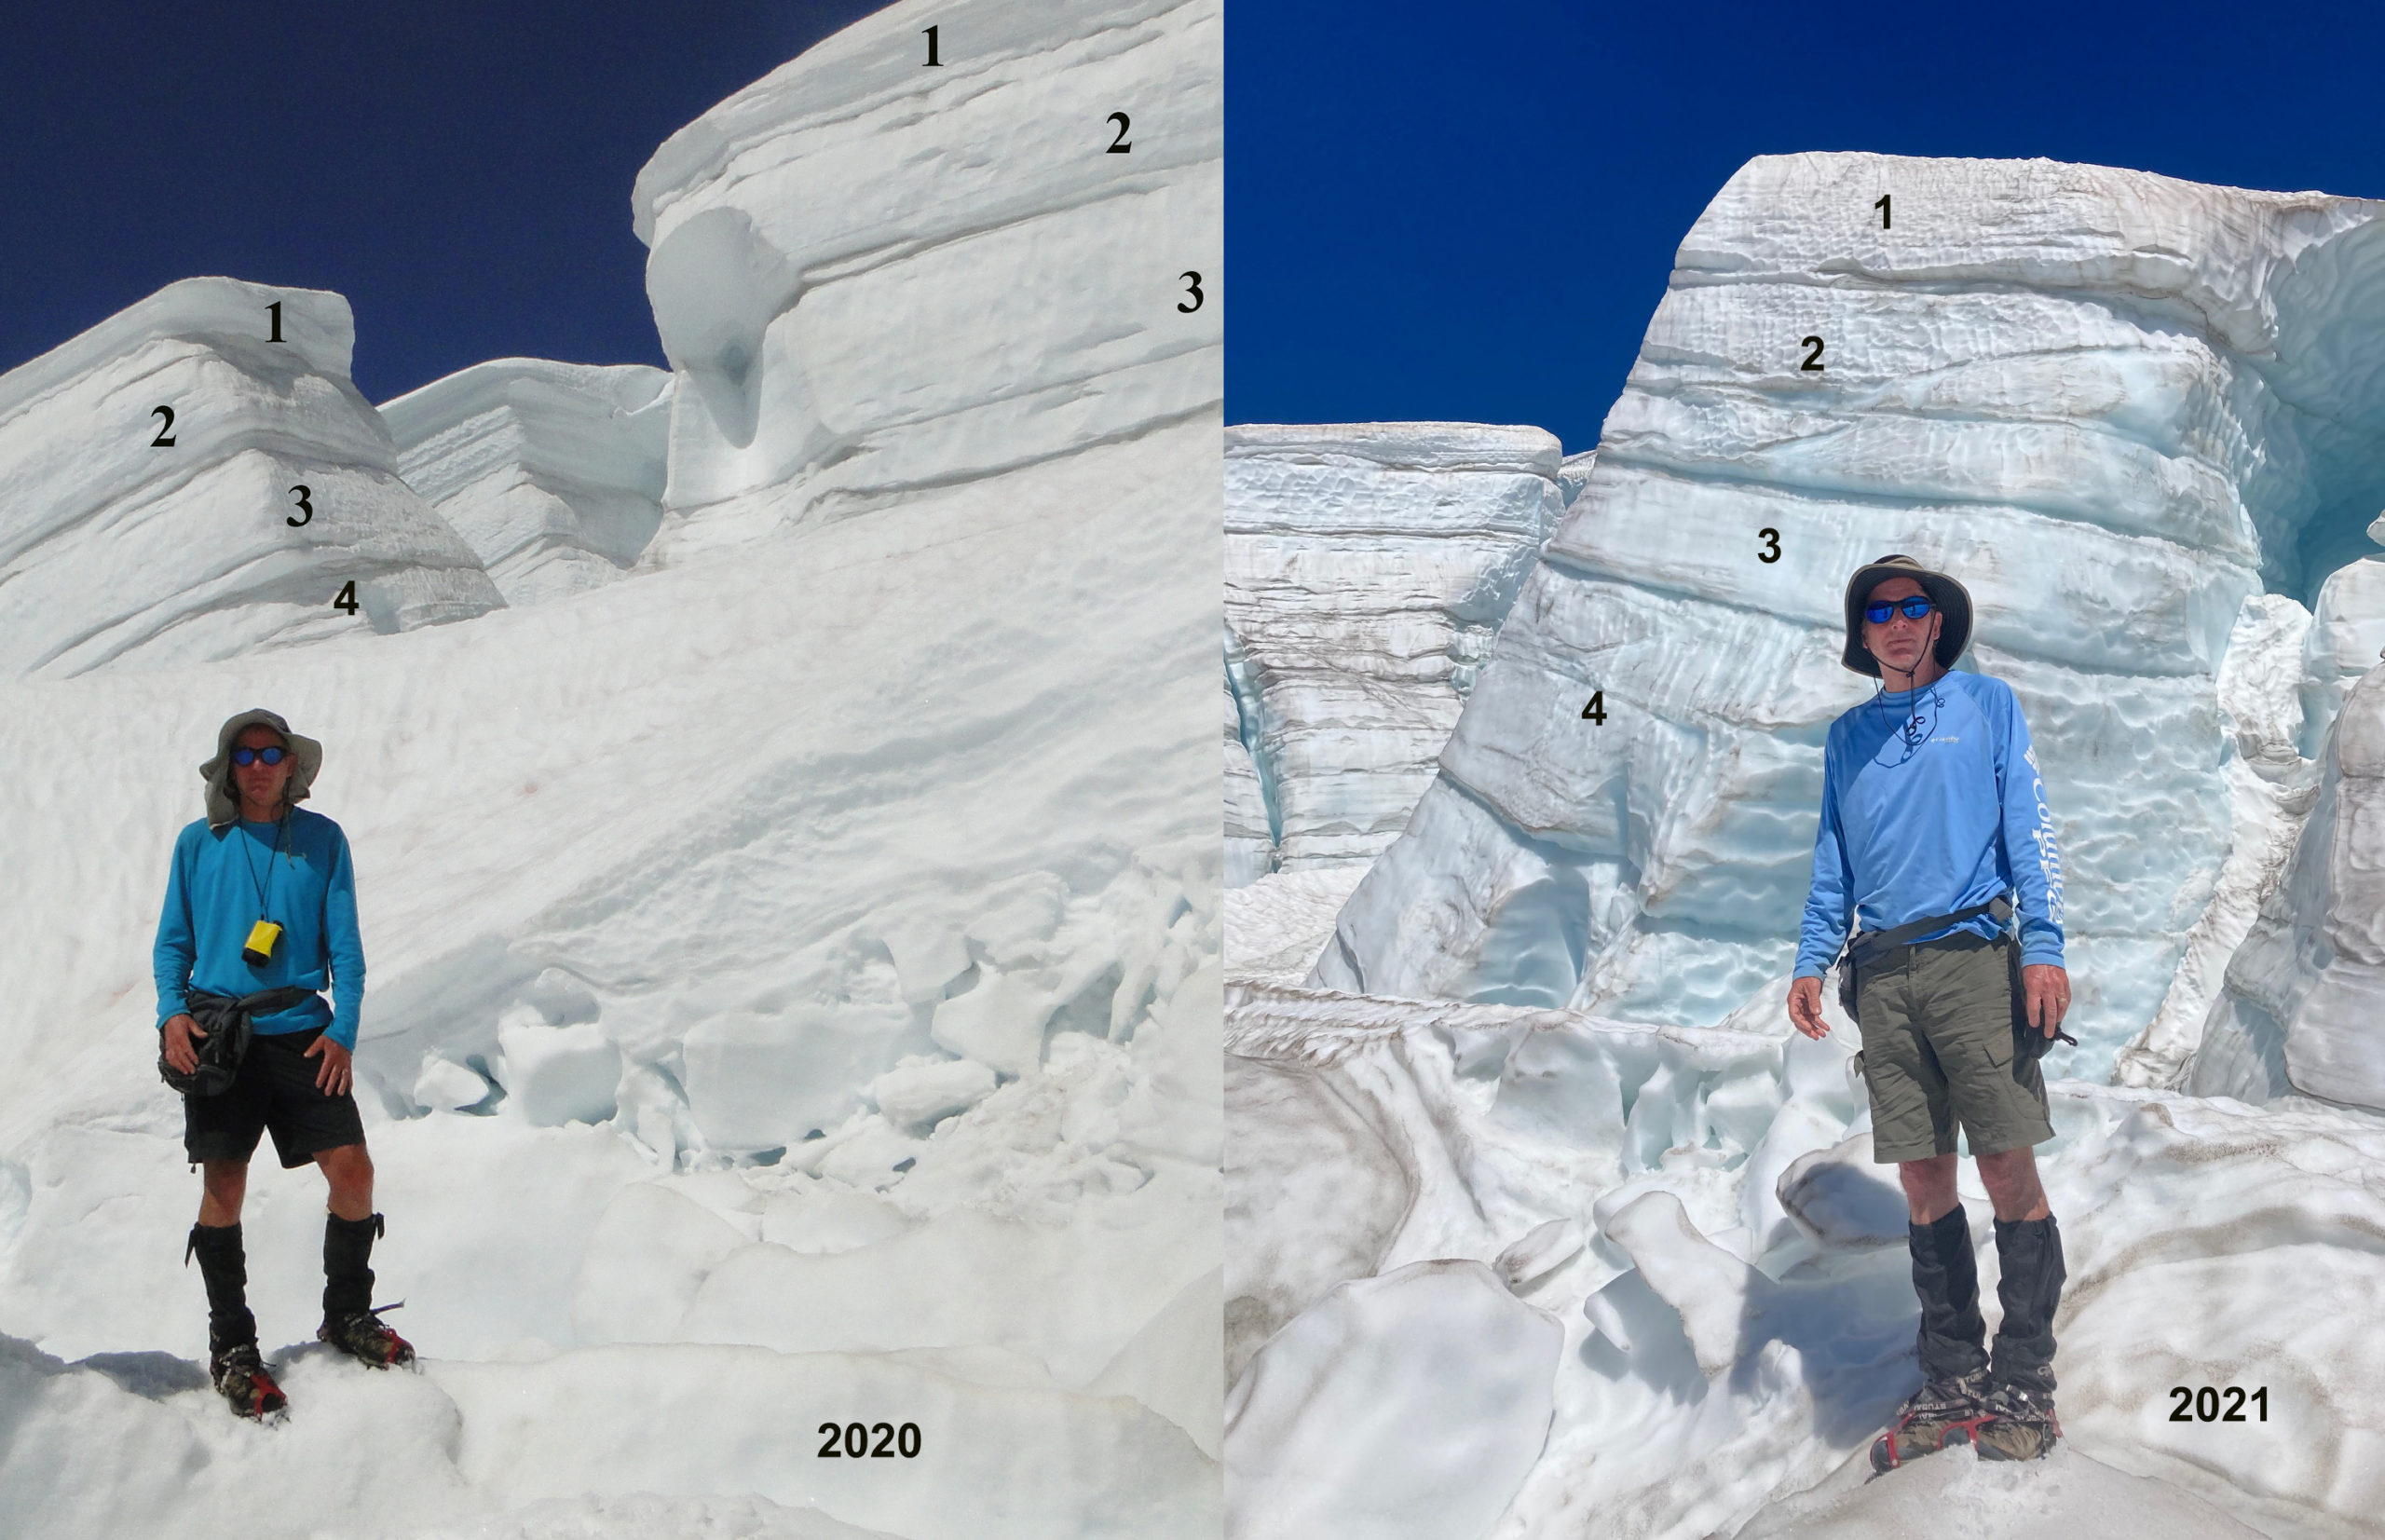
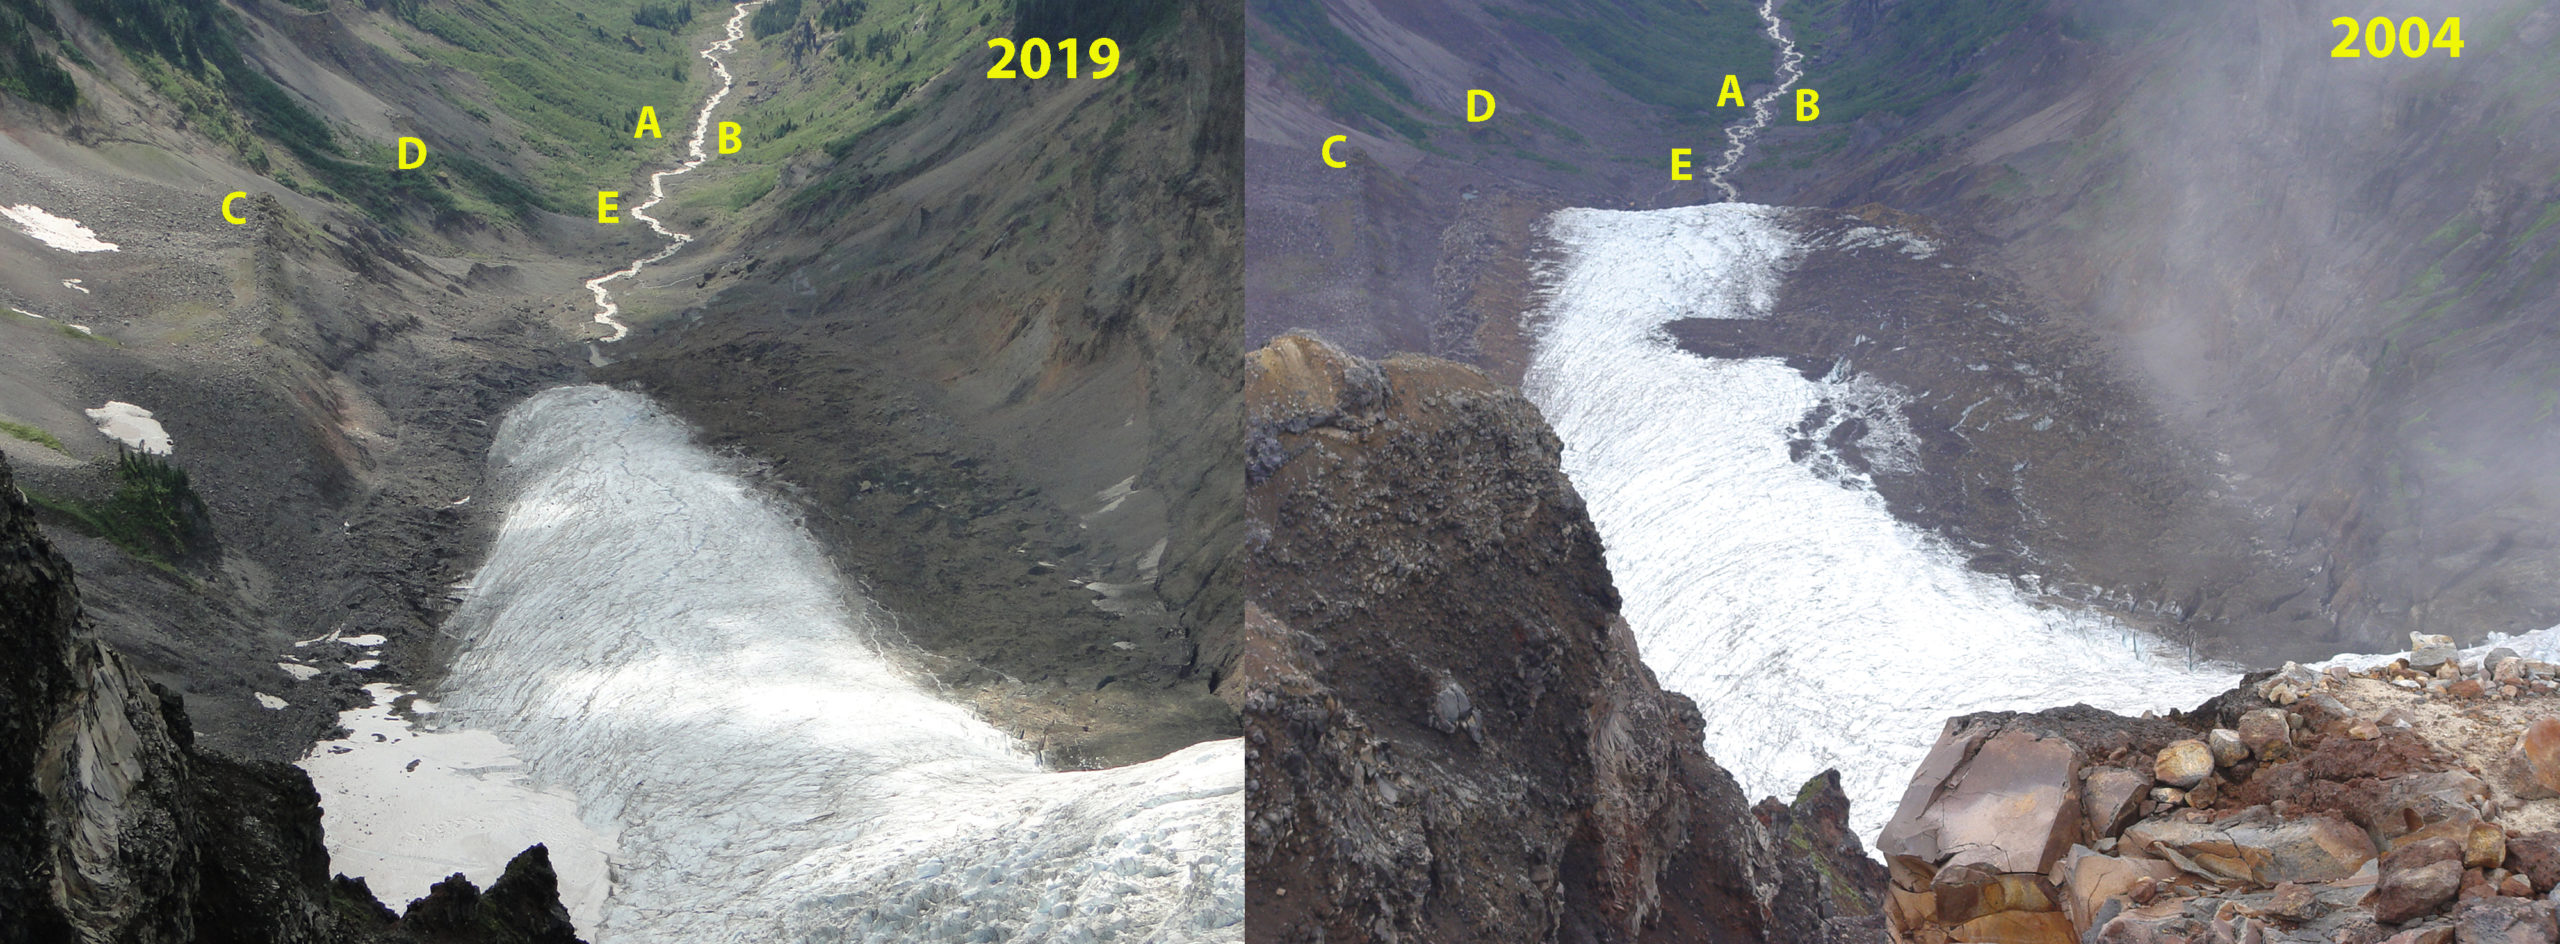
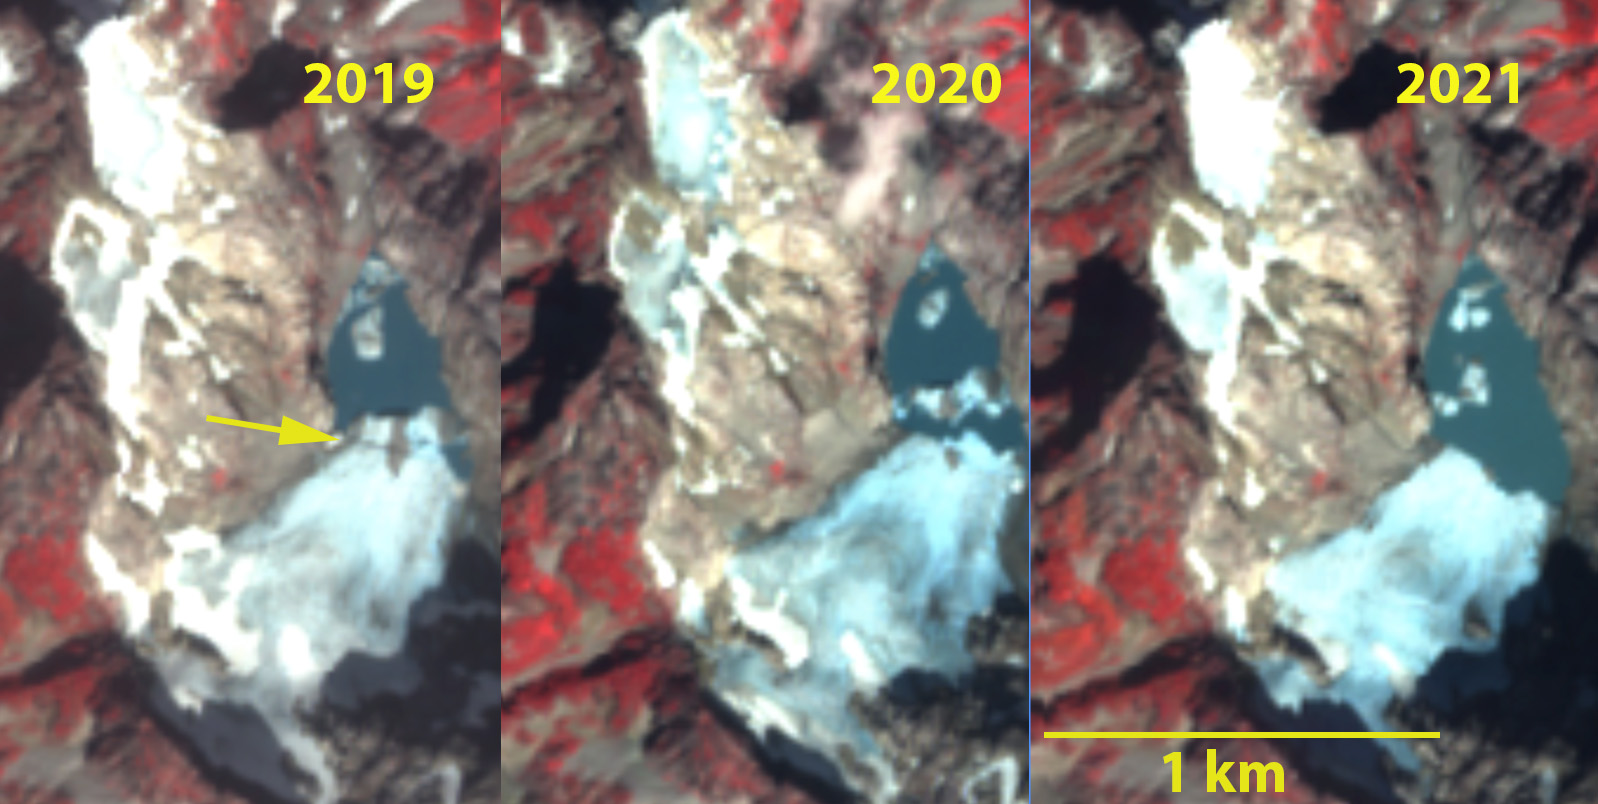
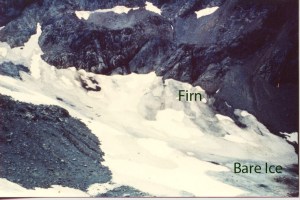
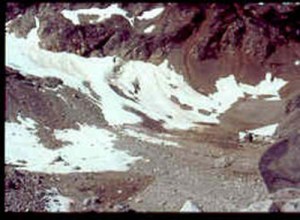
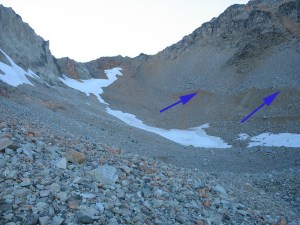
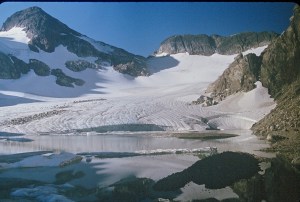
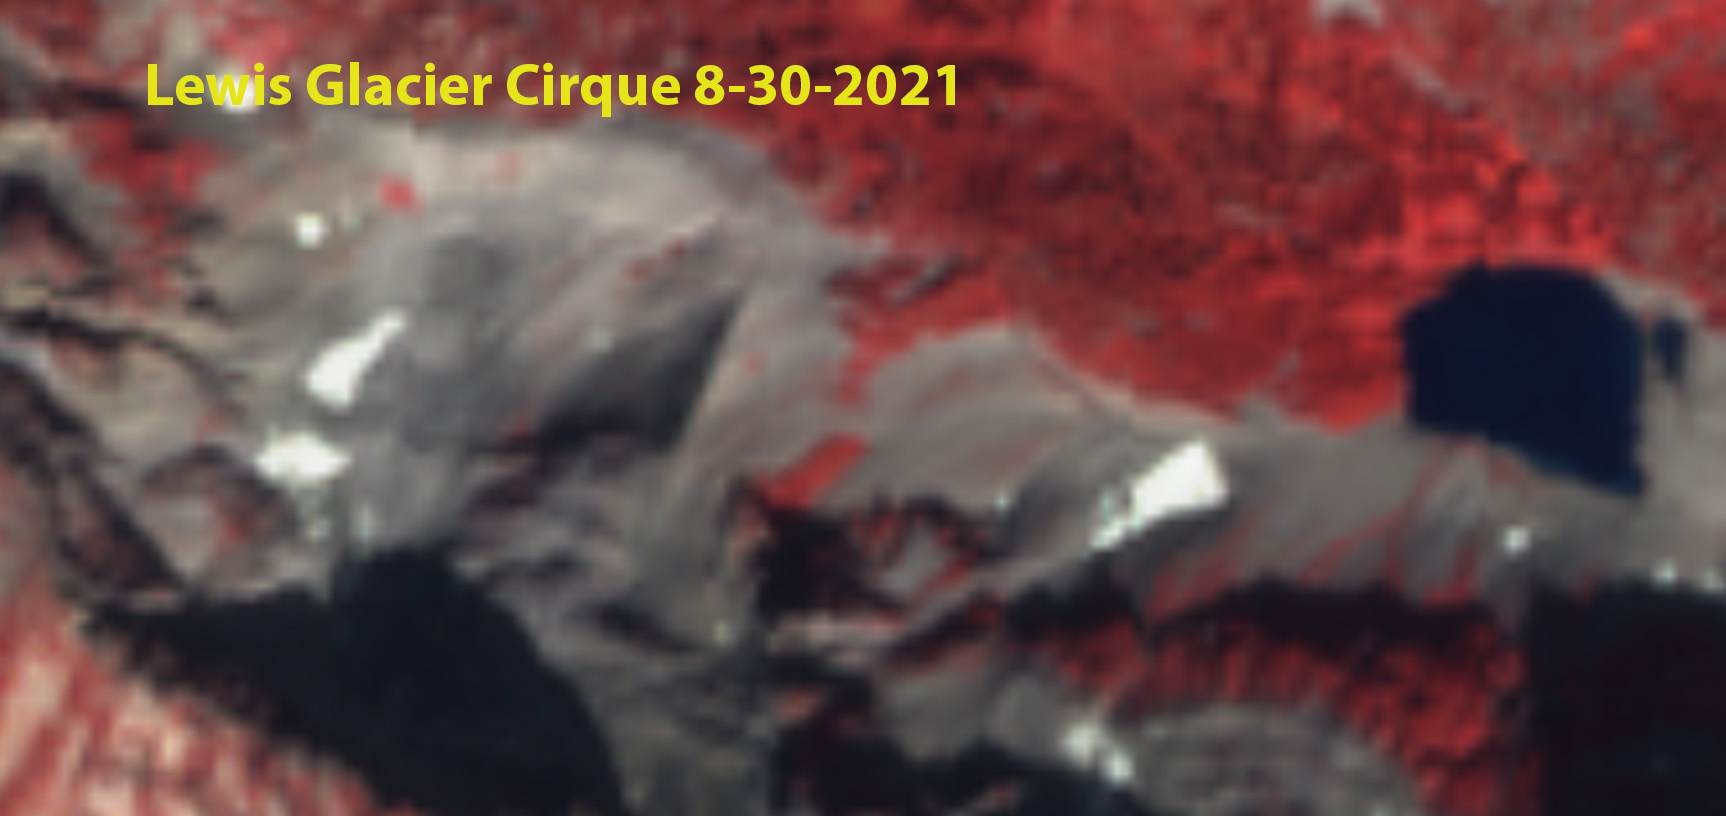
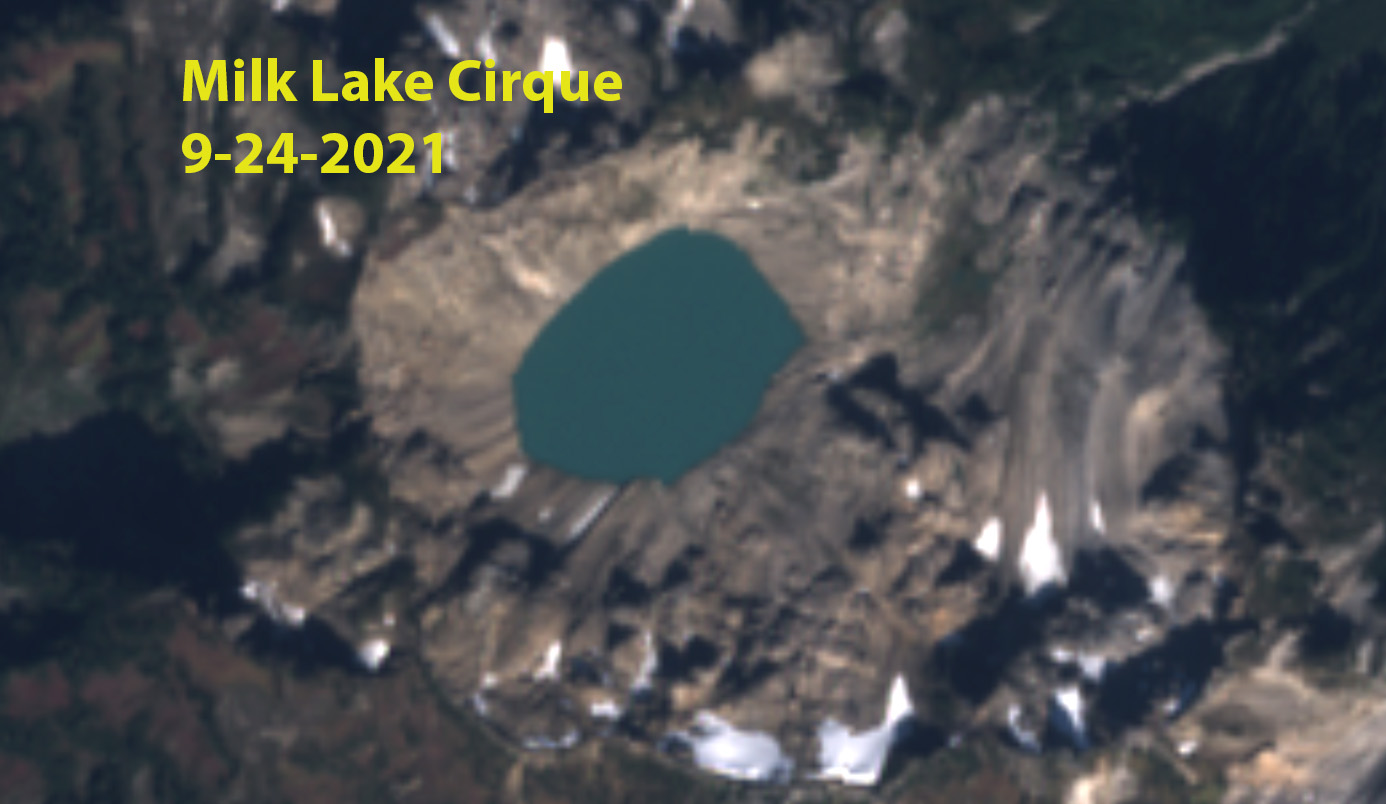
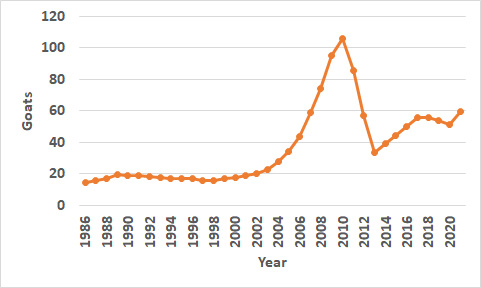
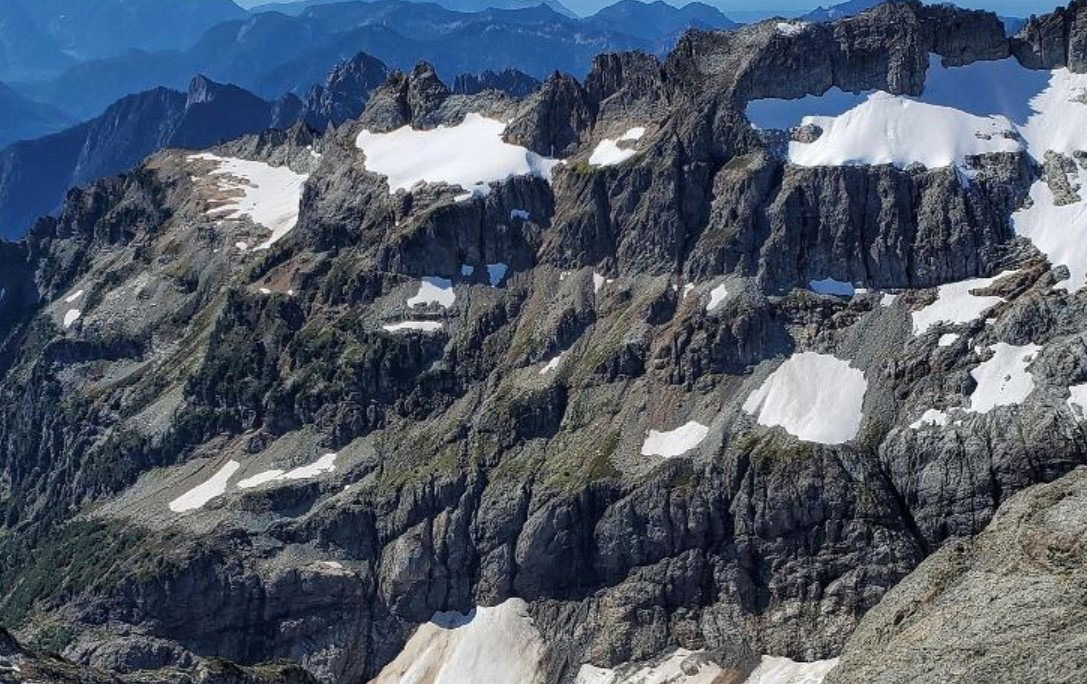
Retreat of Mount Baker glaciers documented by our program

The mass balance record we have compiled since 1984

Summer temperature records from NOAA WA Division 5
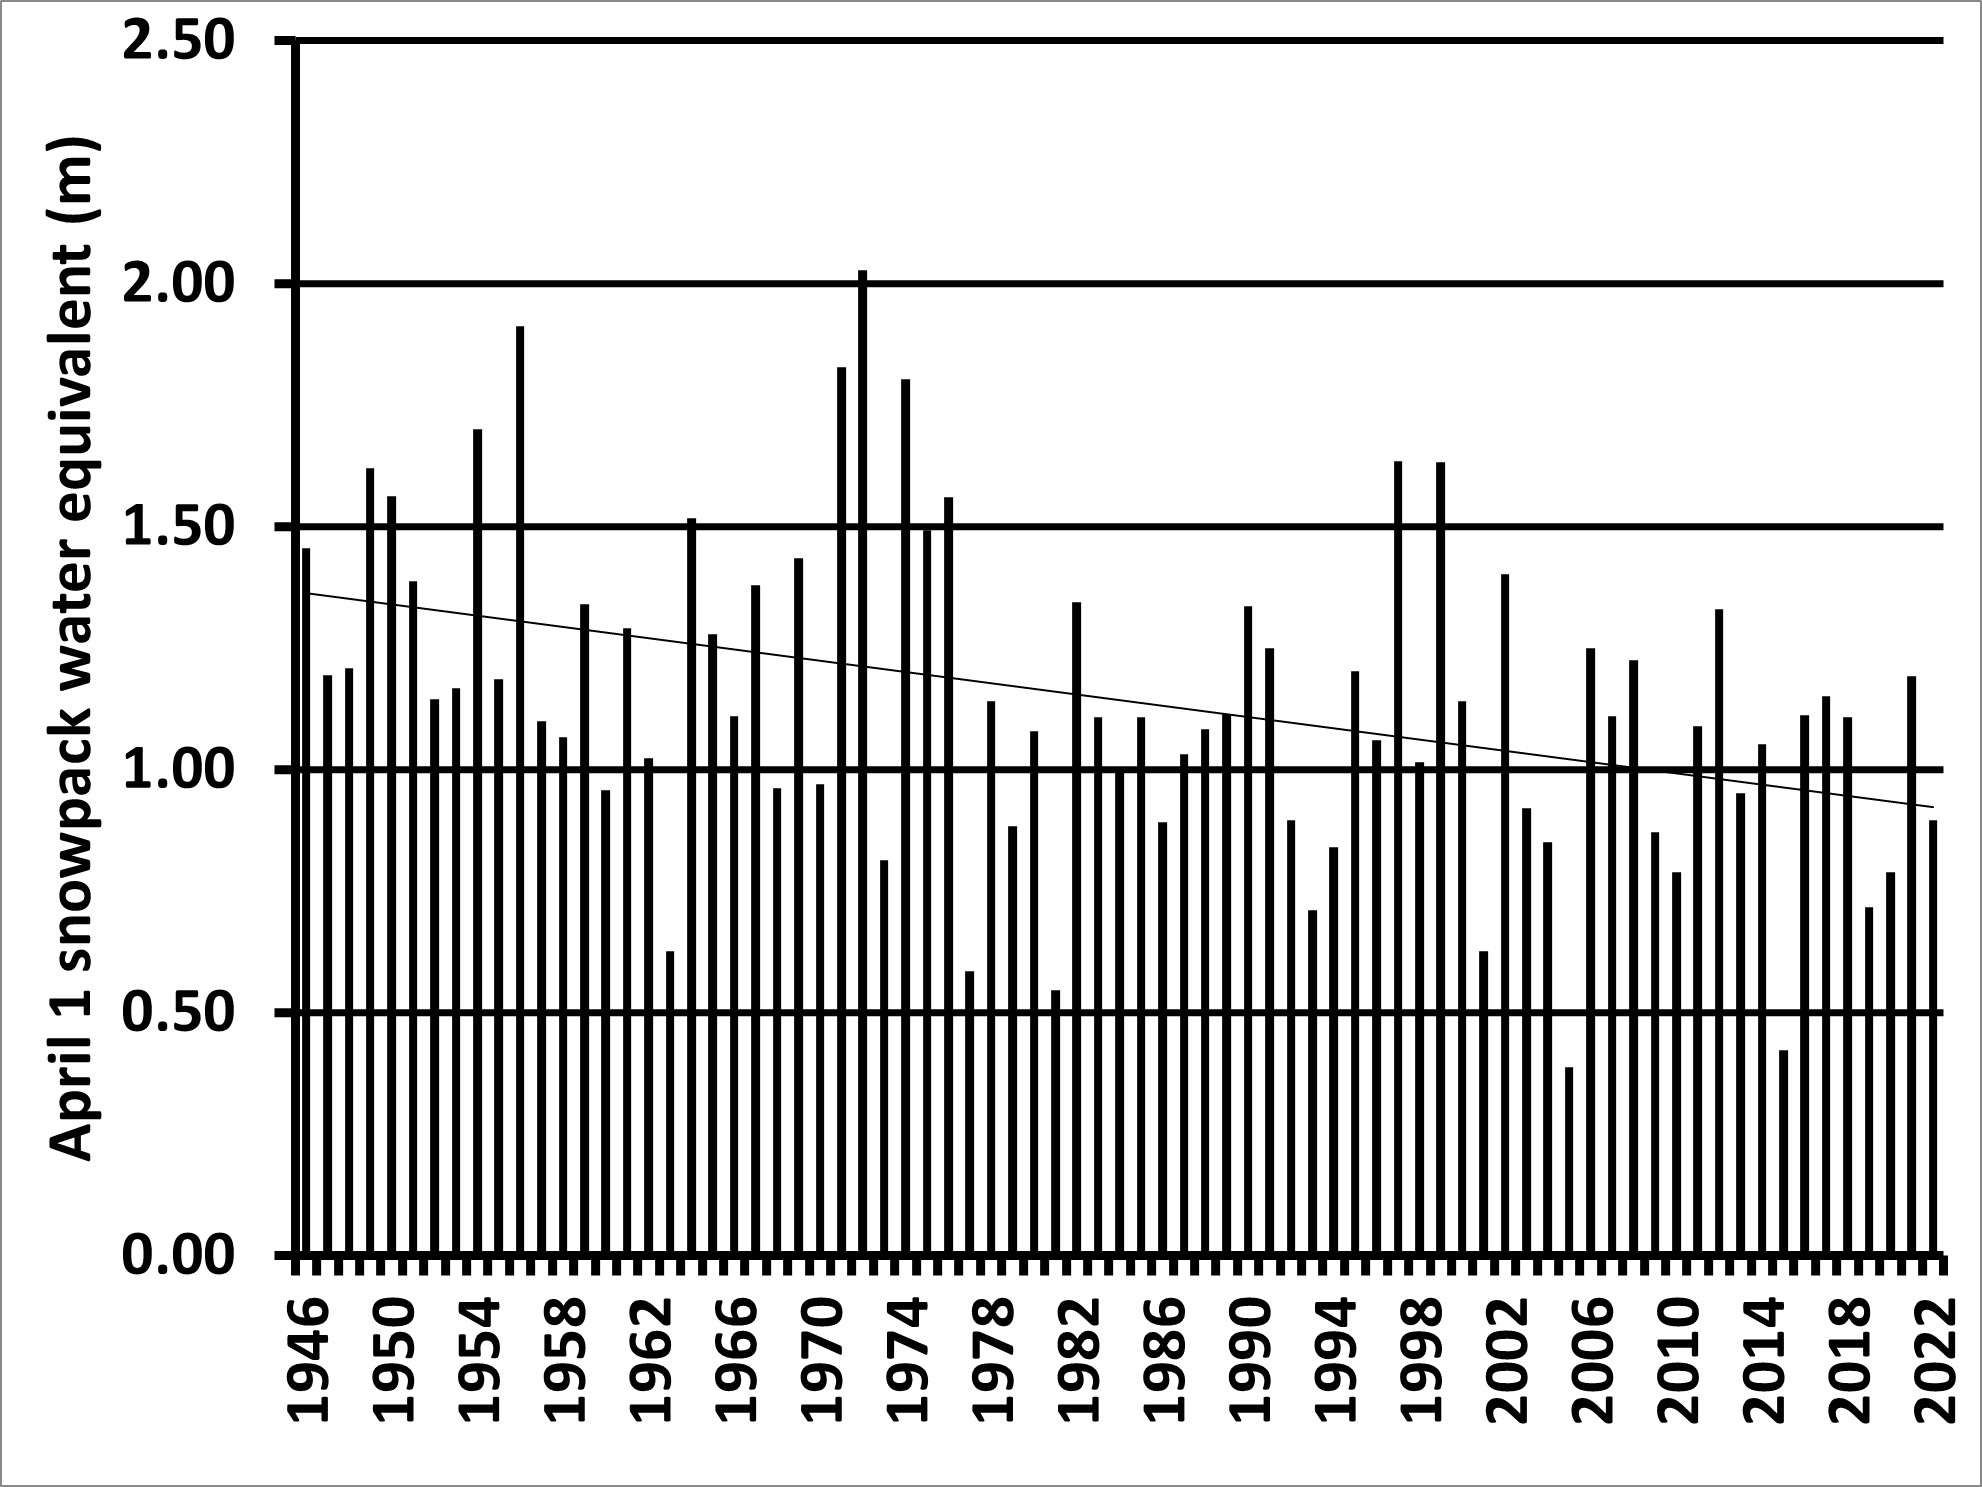
Winter Snowpack from North Cascade long term Snotel stations on April 1