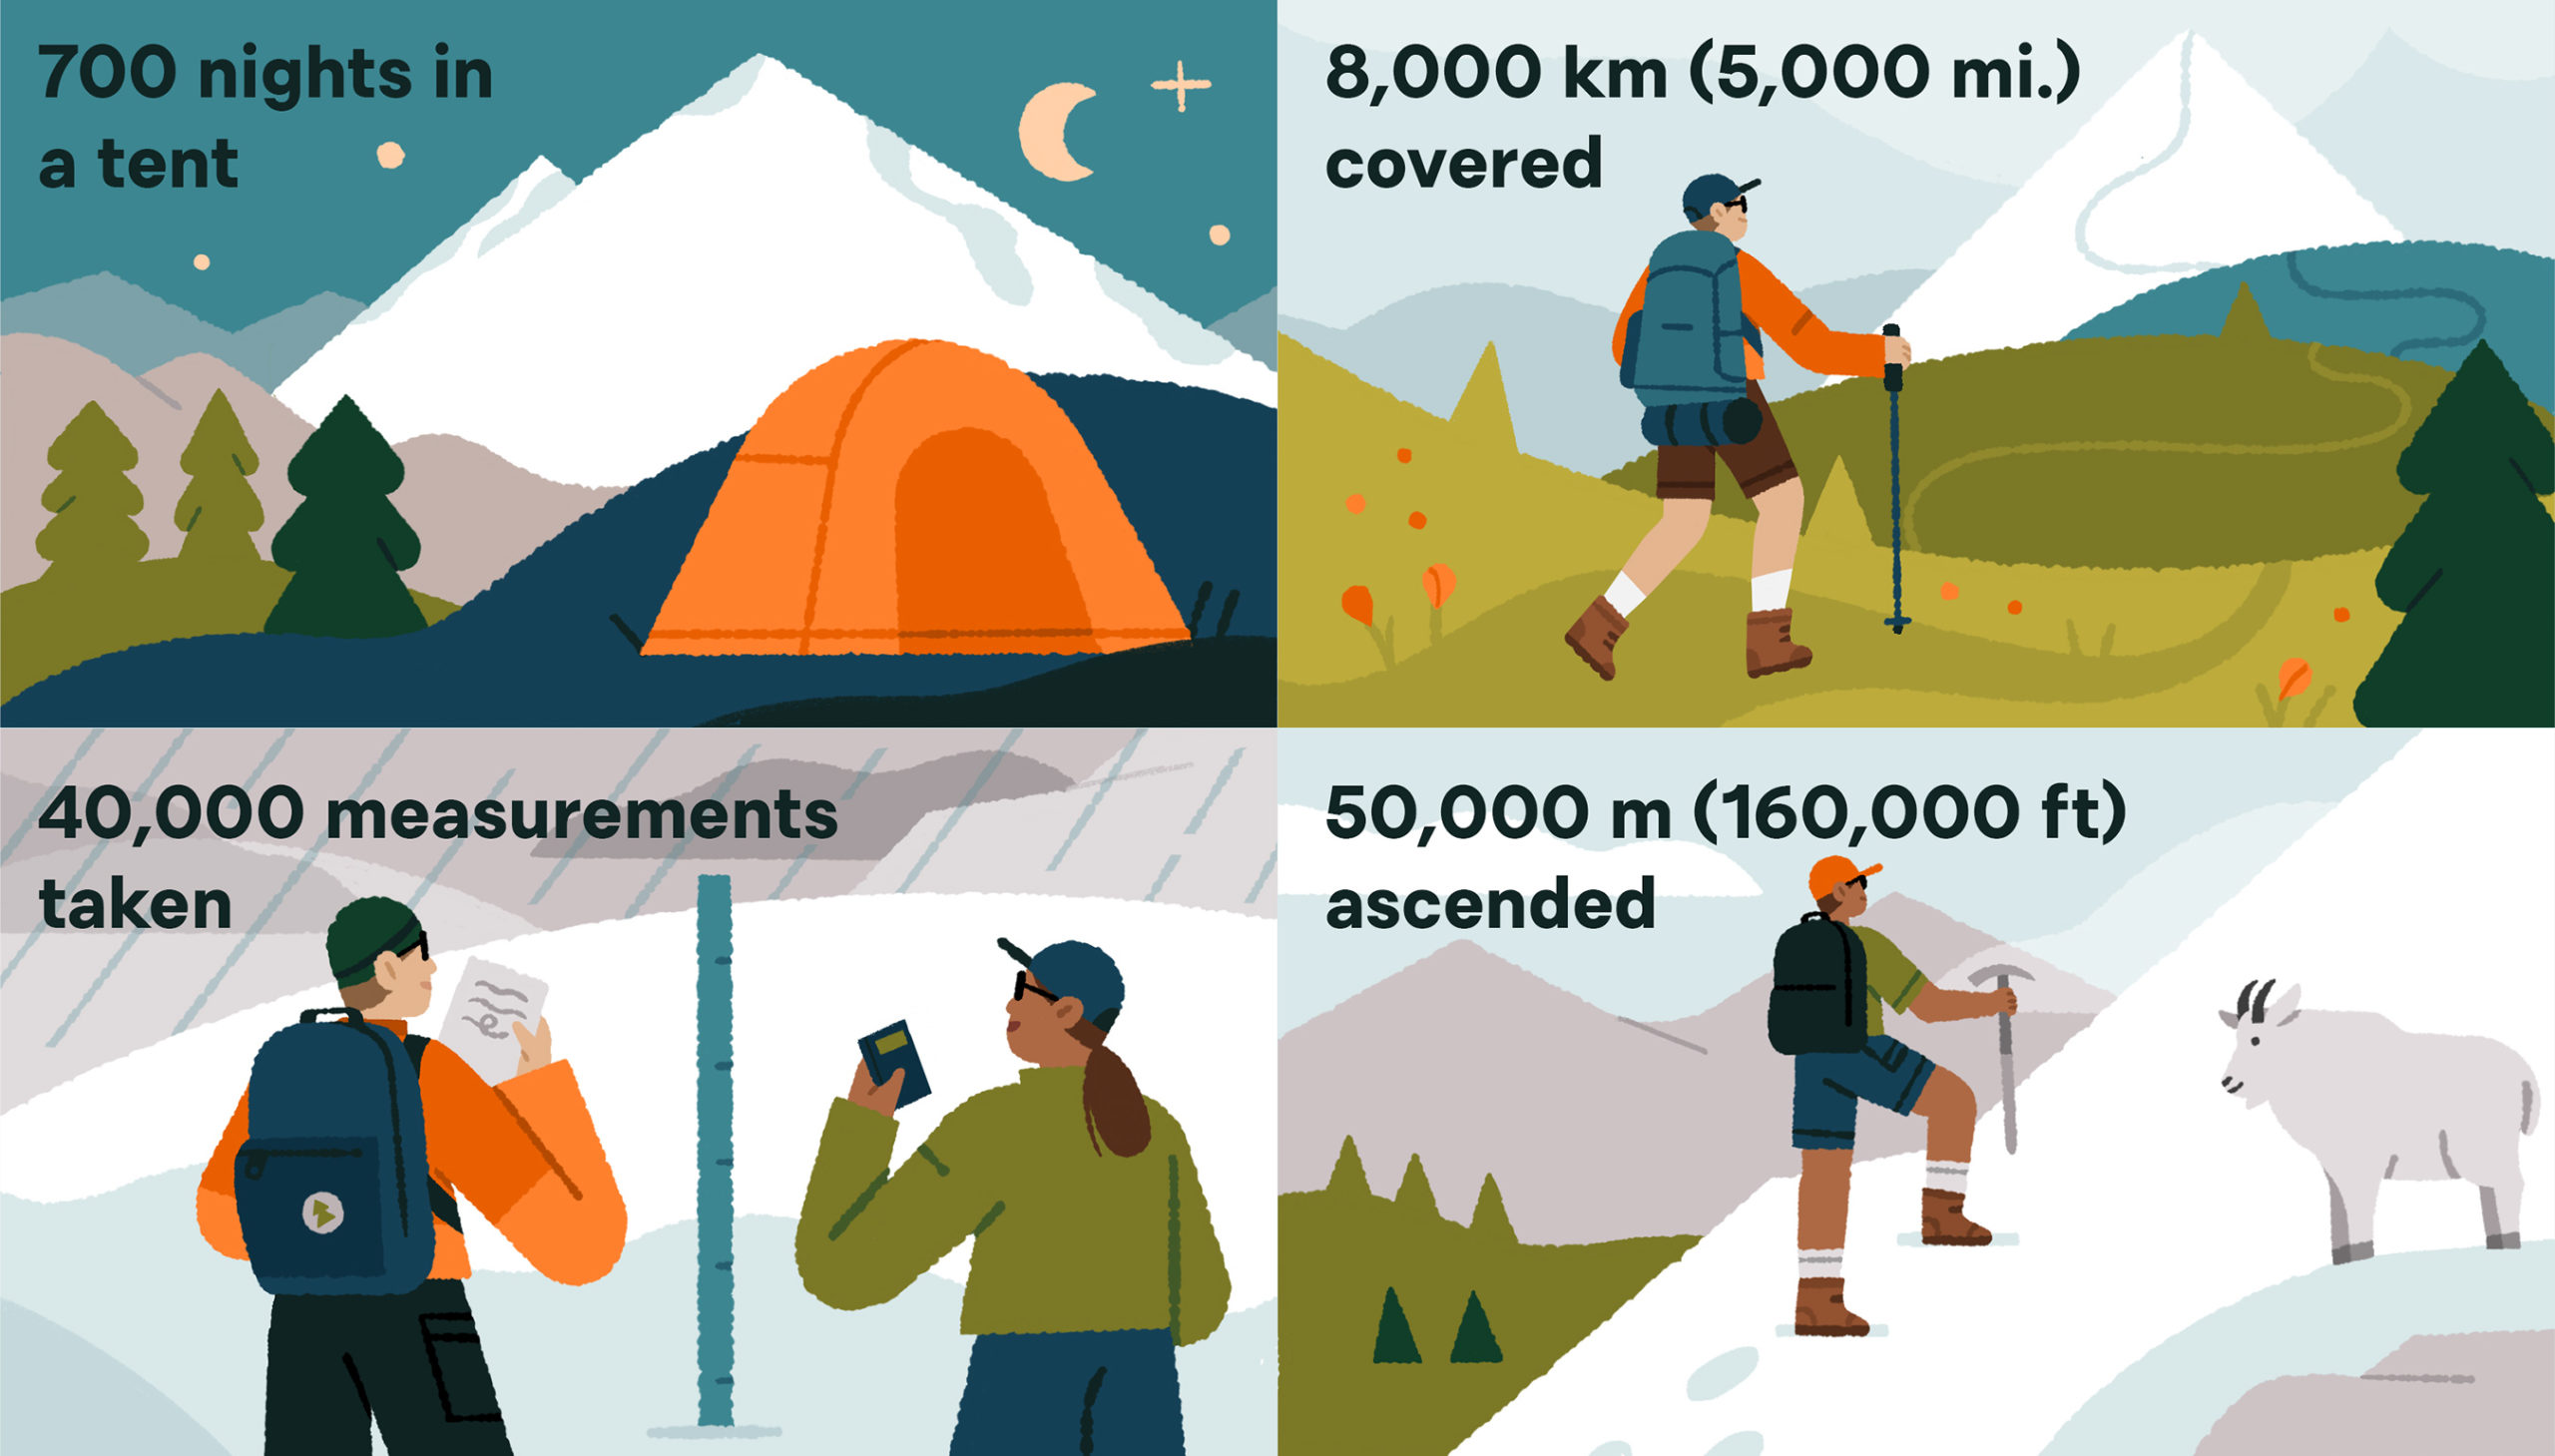
A few measures of what it takes to execute a field monitoring program of glaciers for 37 years, with no helicopter support (Illustration by Megan Pelto).
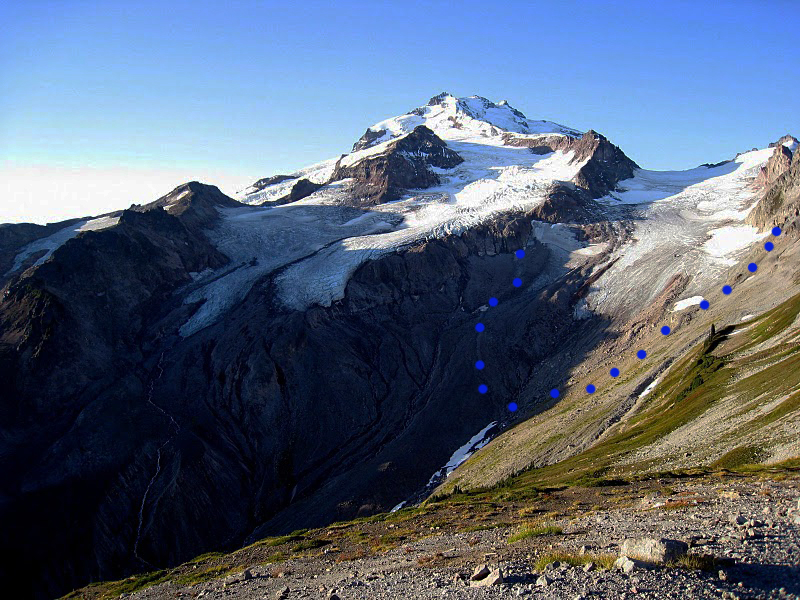
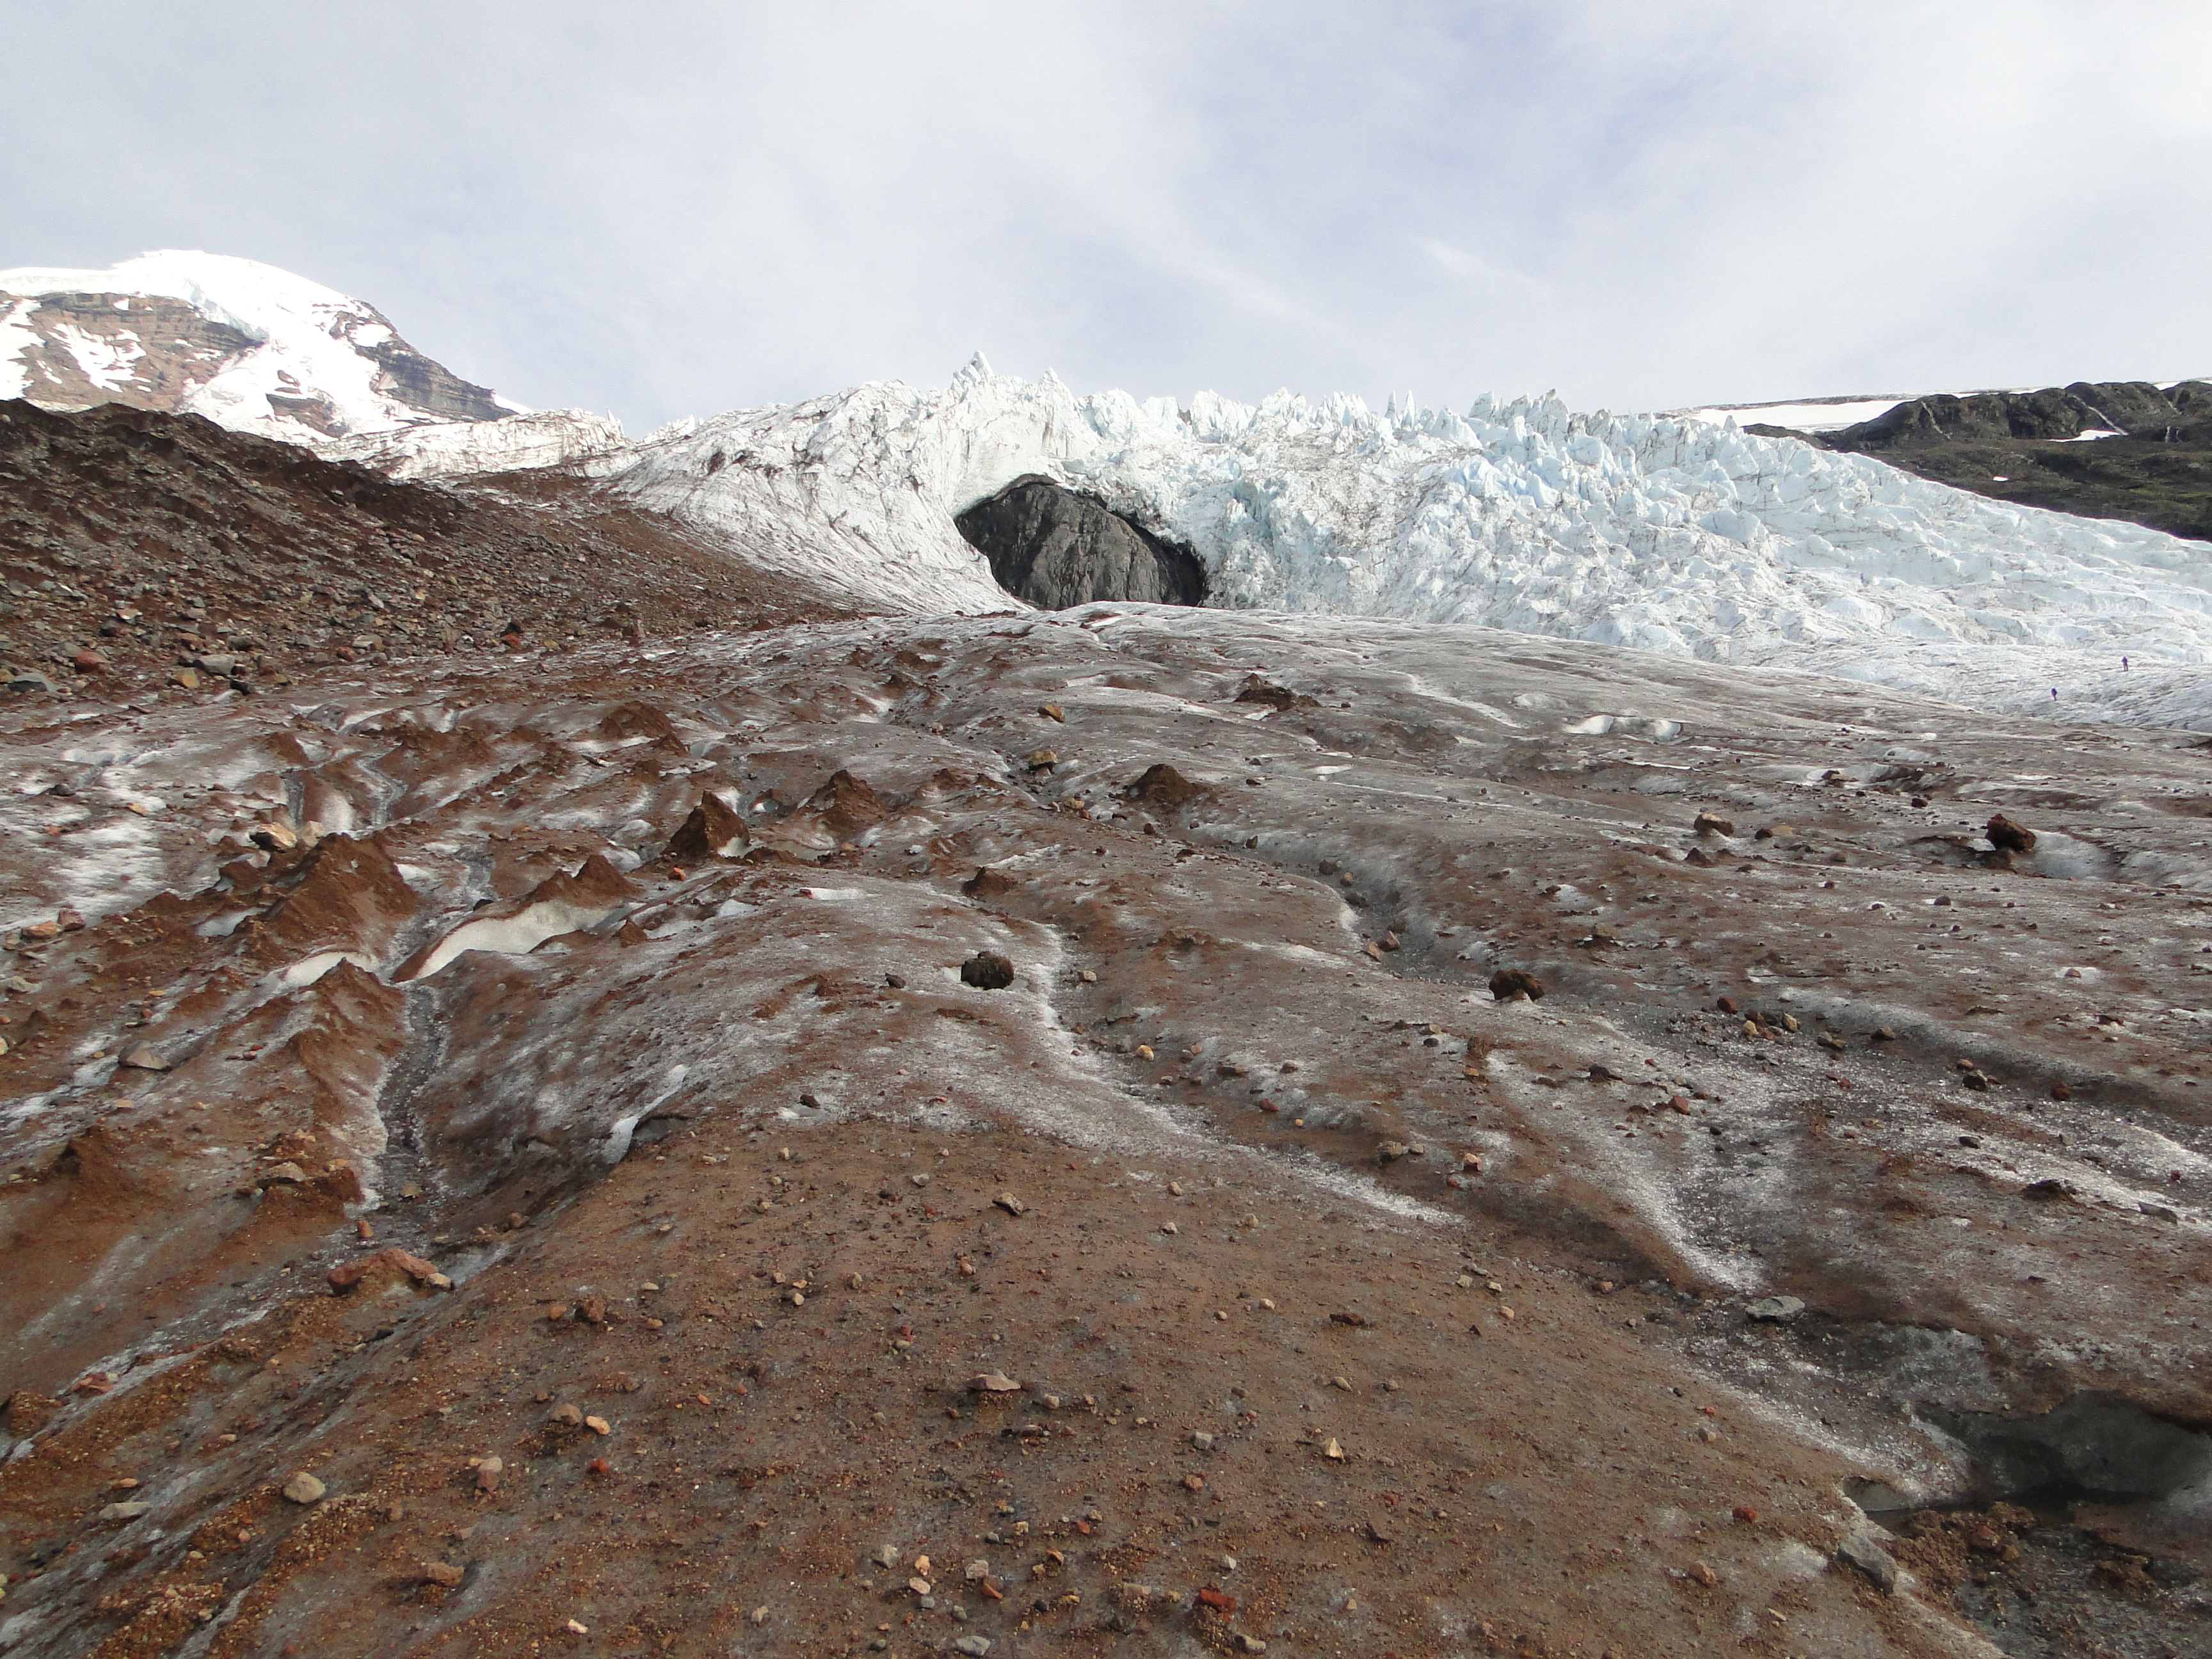
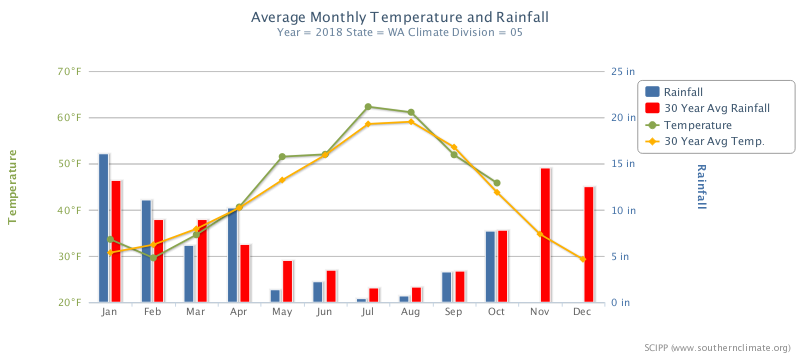
2021 Field Season: For the 38th consecutive summer we are heading into the field later this week to measure the impact of climate change on North Cascade glaciers. We will complete detailed measurements on 10 glaciers, three of which are part of the World Glacier Monitoring Service reference glacier network (42 glaciers globally) that have 30 consecutive years of mass balance observations. This field season follows both a historic heat wave at the end of June and a month long sustained period of warm weather that has extended from Late June to now. We have observed the rise of the snow line around Mount Baker from a lower than average late June ~1200 m on June 23 to ~1850 m on July 23, average in late July is 1750 m. The result is a greater exposure of bare ice on glaciers with summer only half over. For ice surfaces with a higher albedo and greater density the observed melt rates are 7-9 cm/day water equivalent during warm weather events vs 4-6 cm/day for snow surfaces. We will provide preliminary observations in three weeks when the field season is completed as we did with the 2020 Field Report.
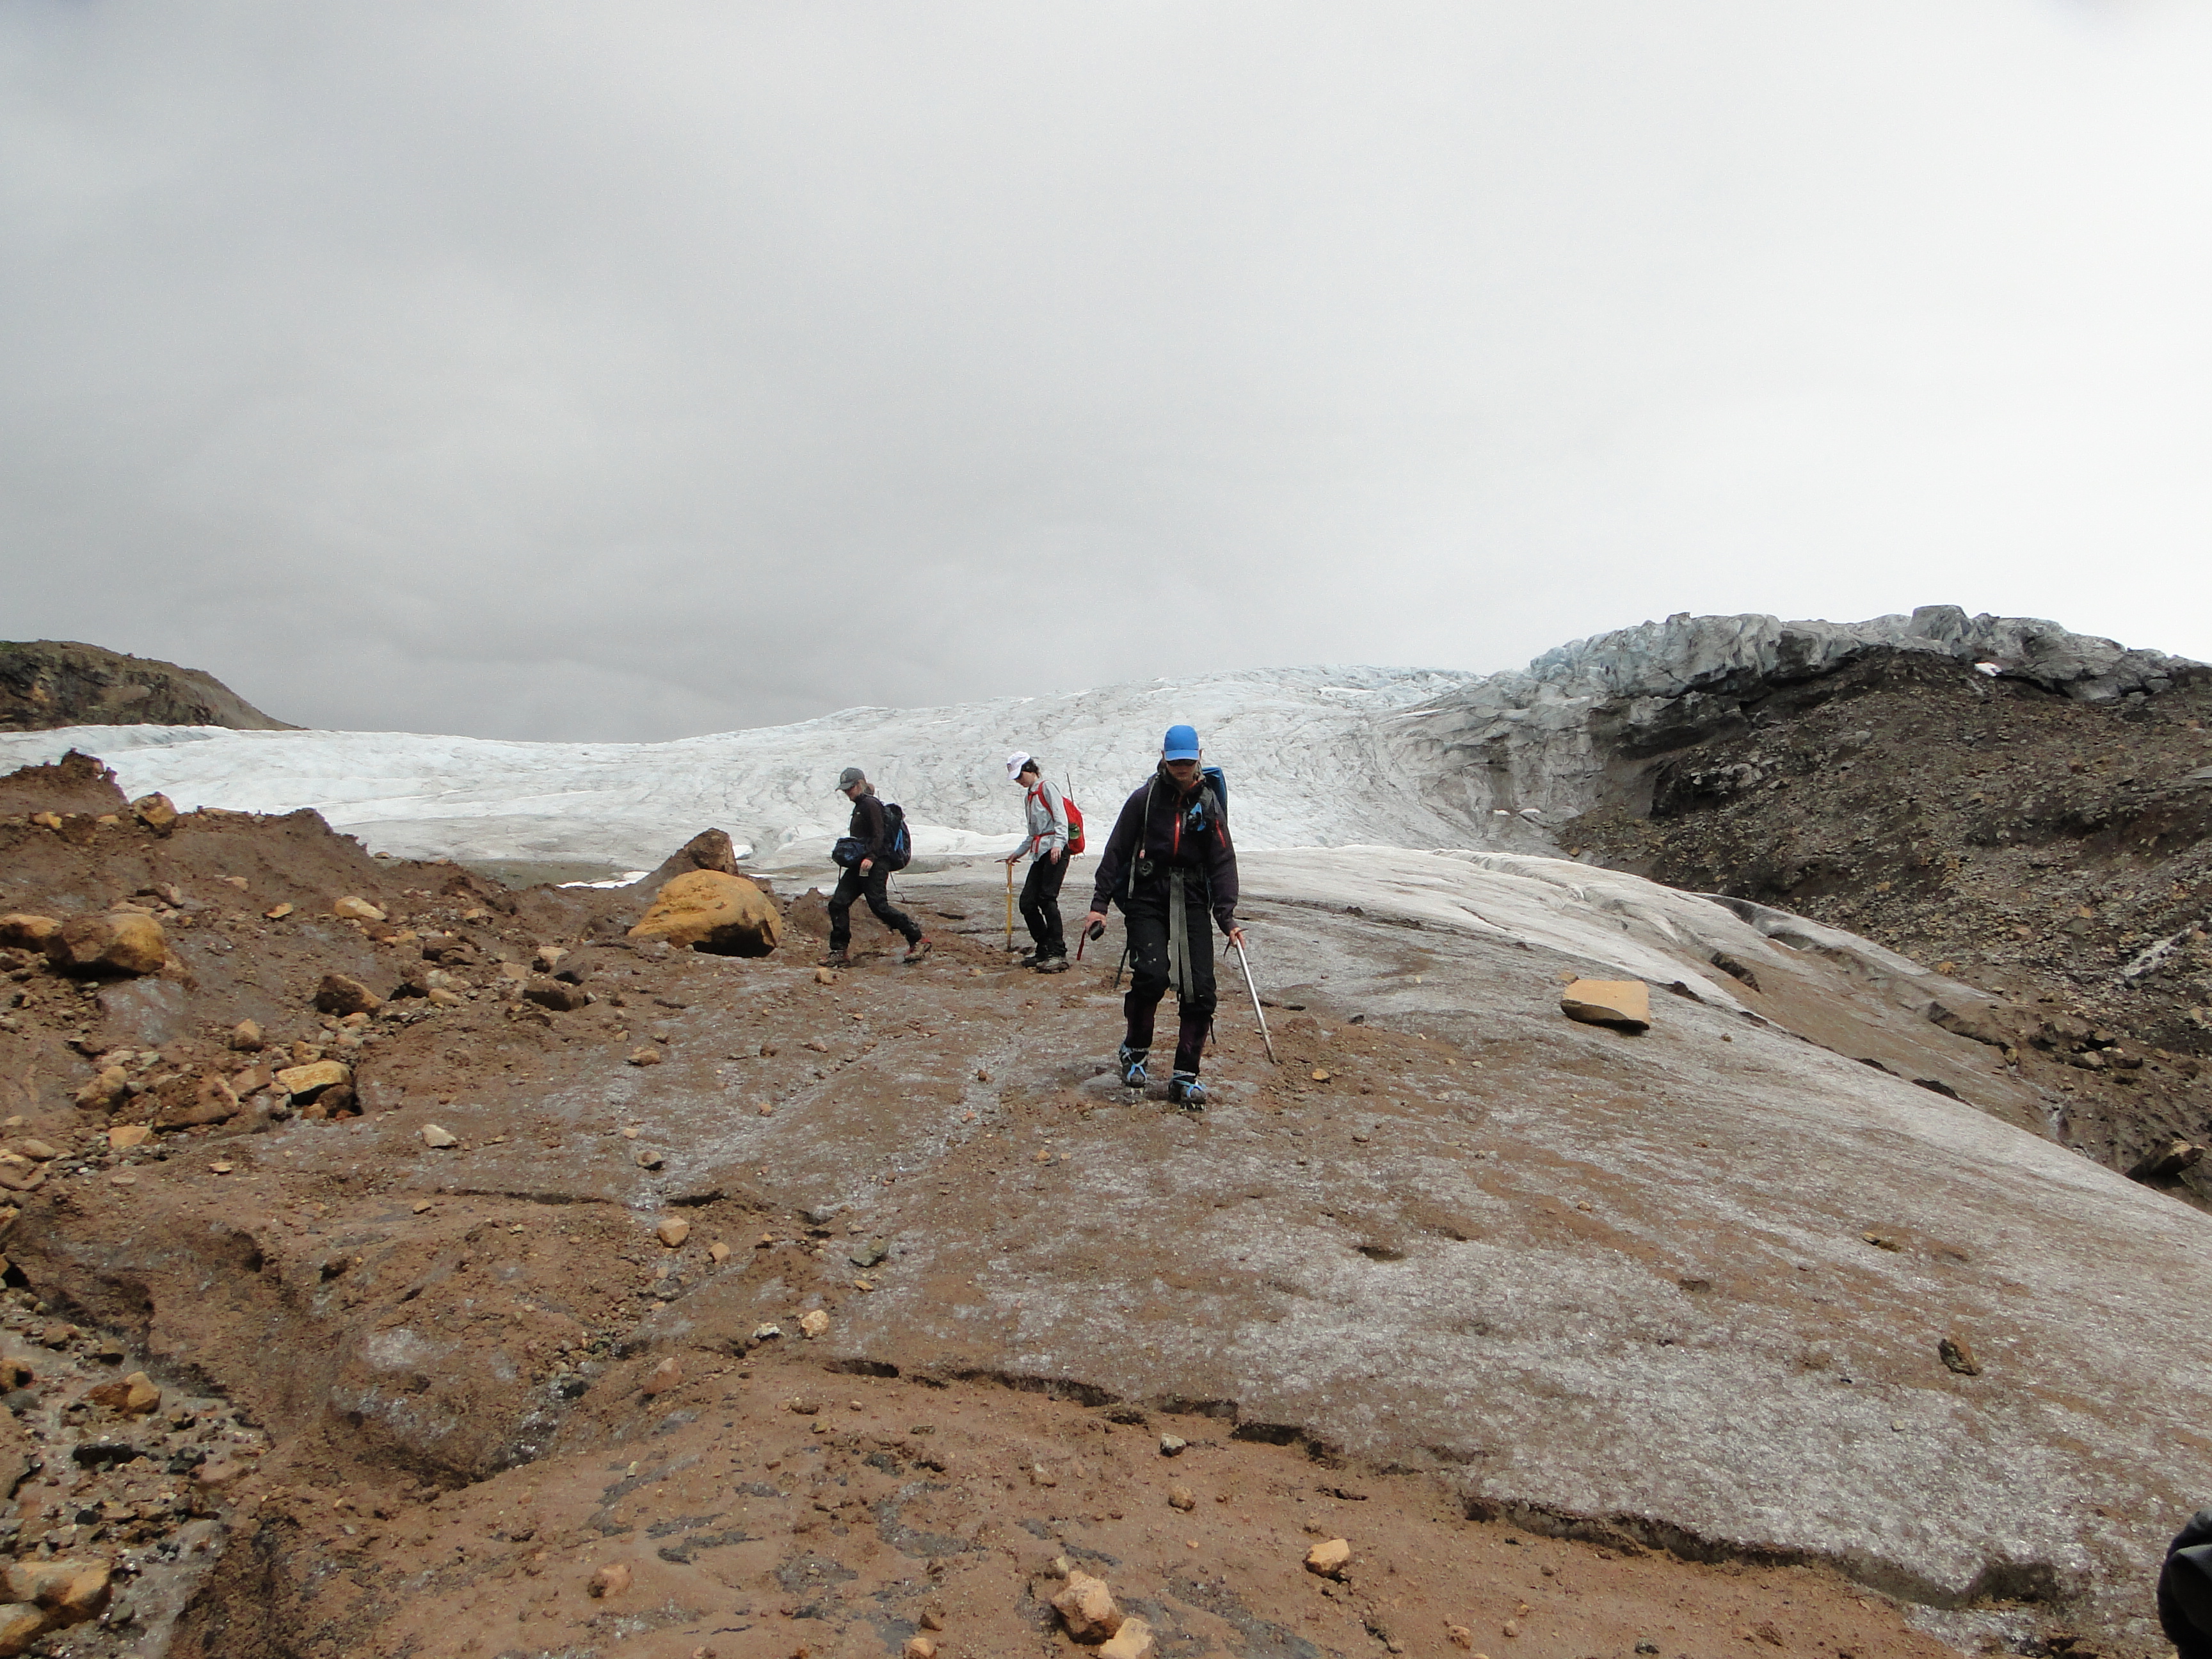
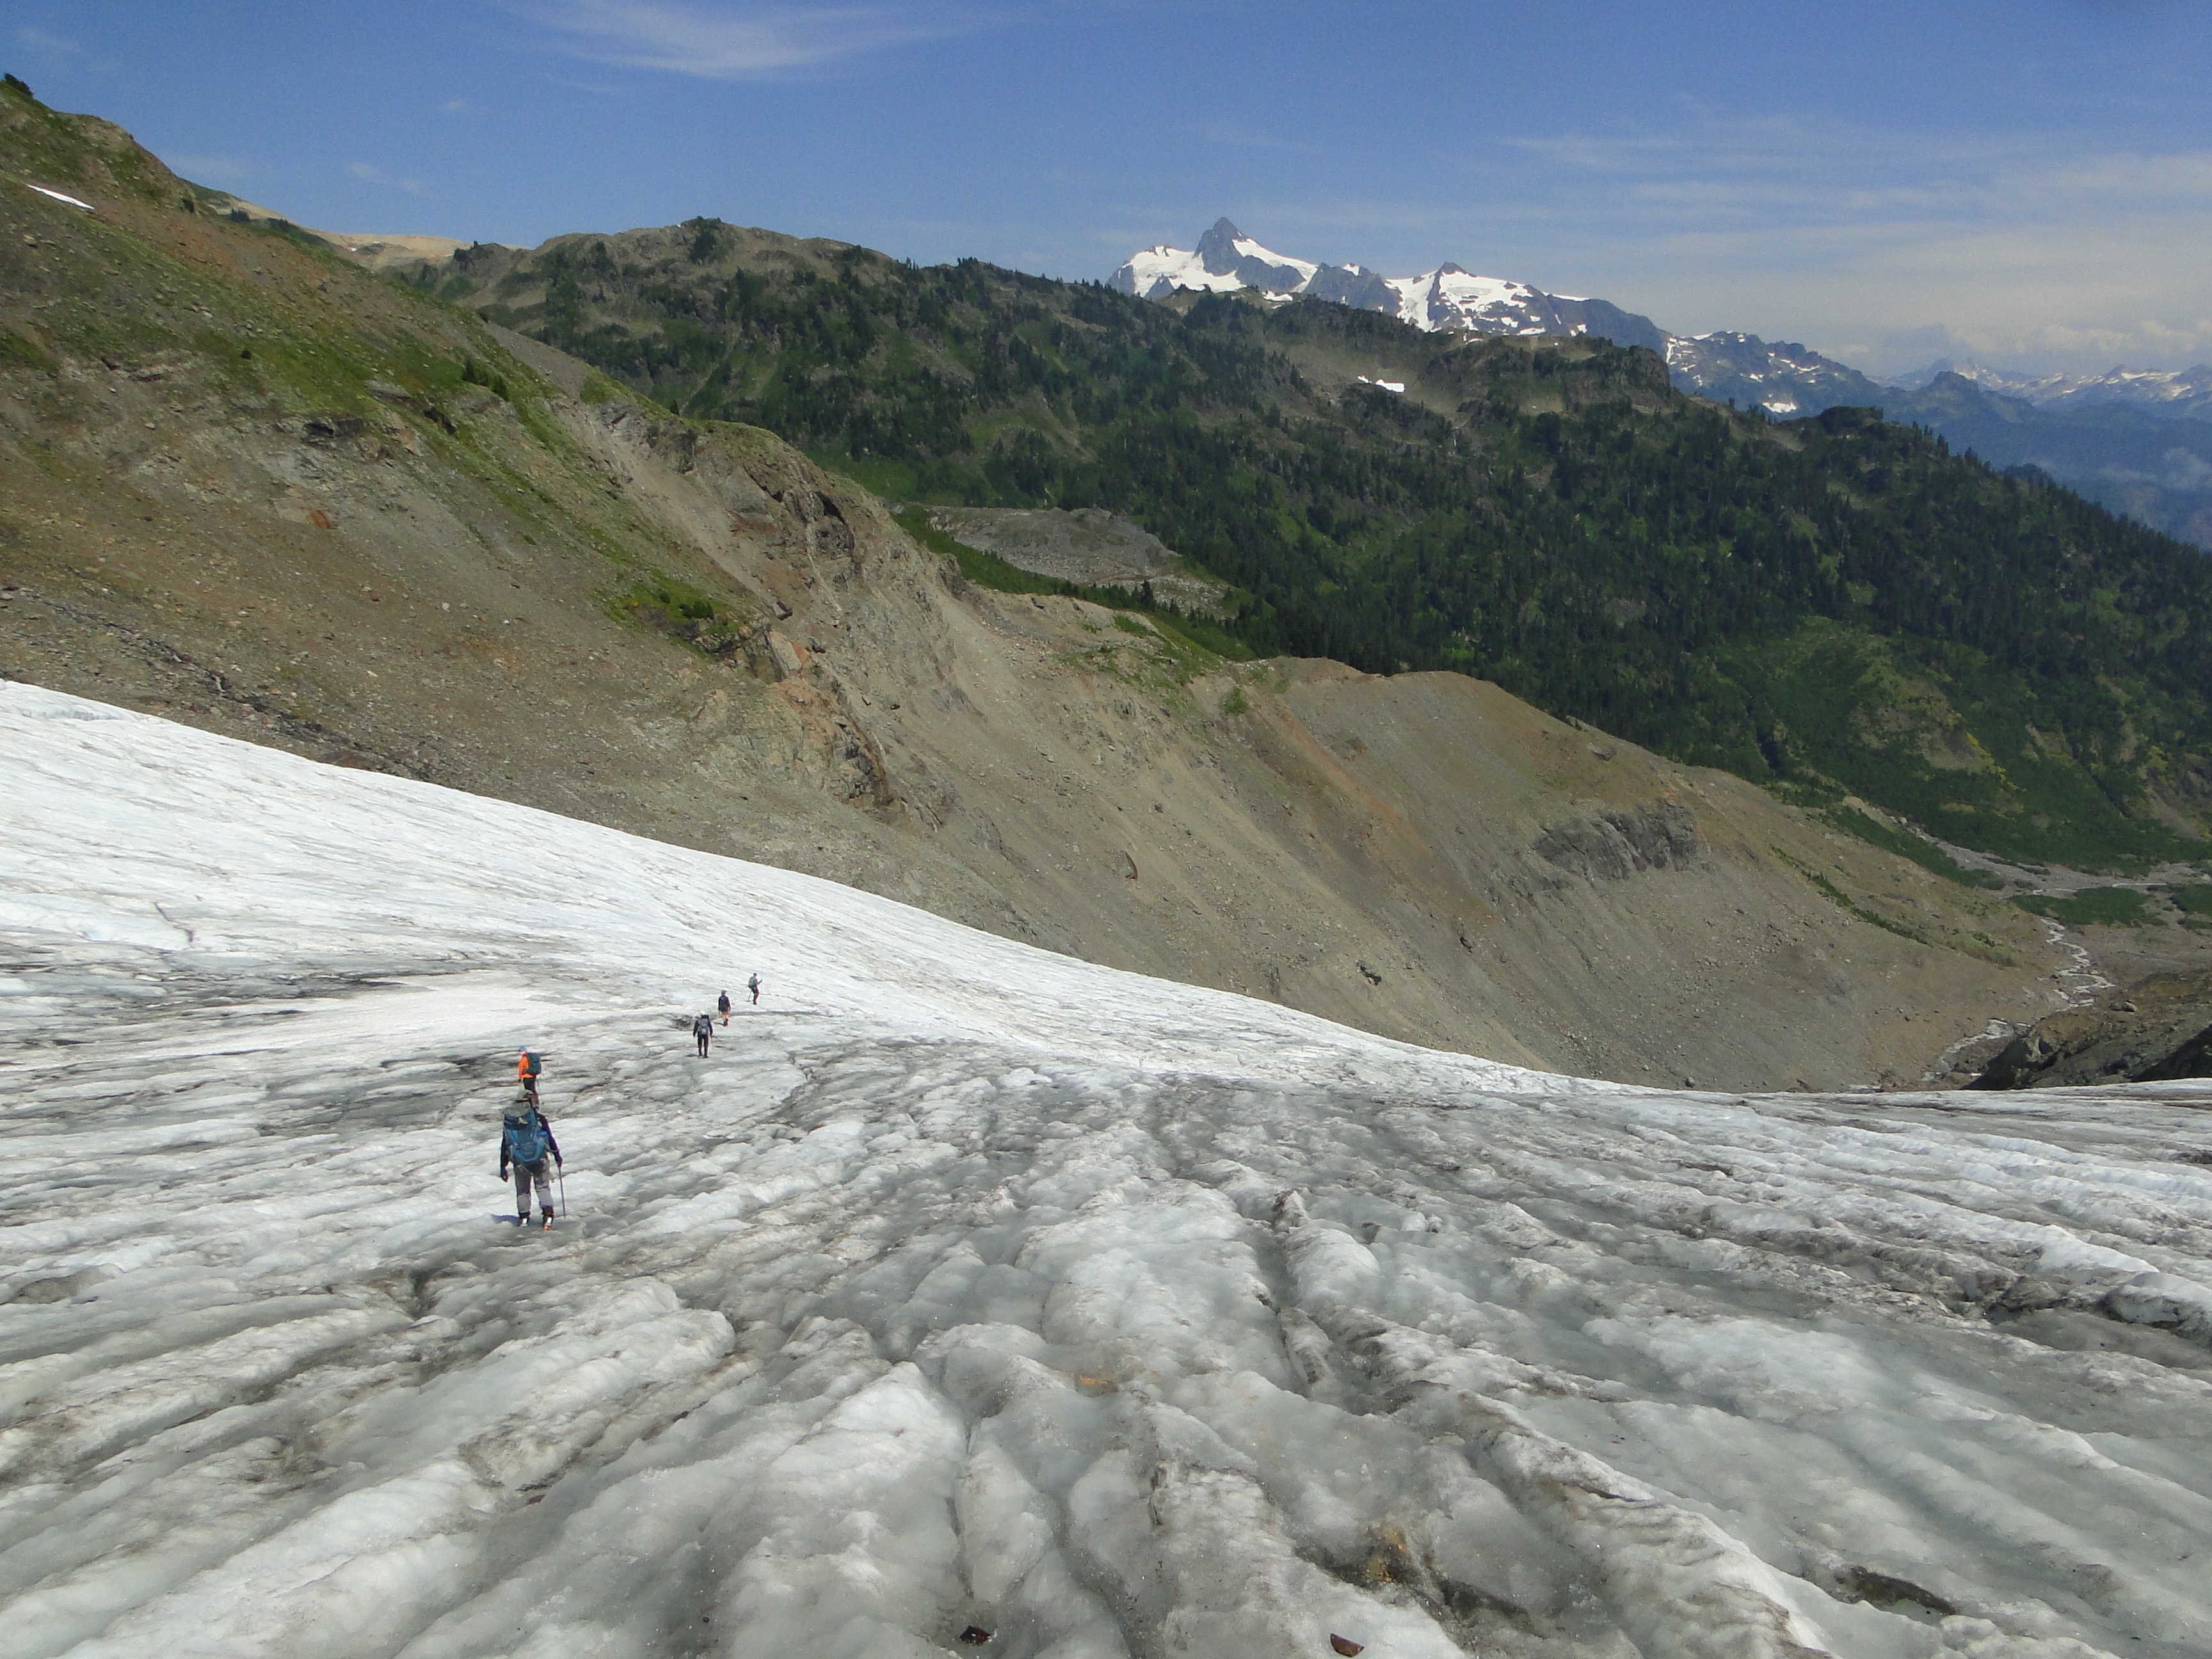
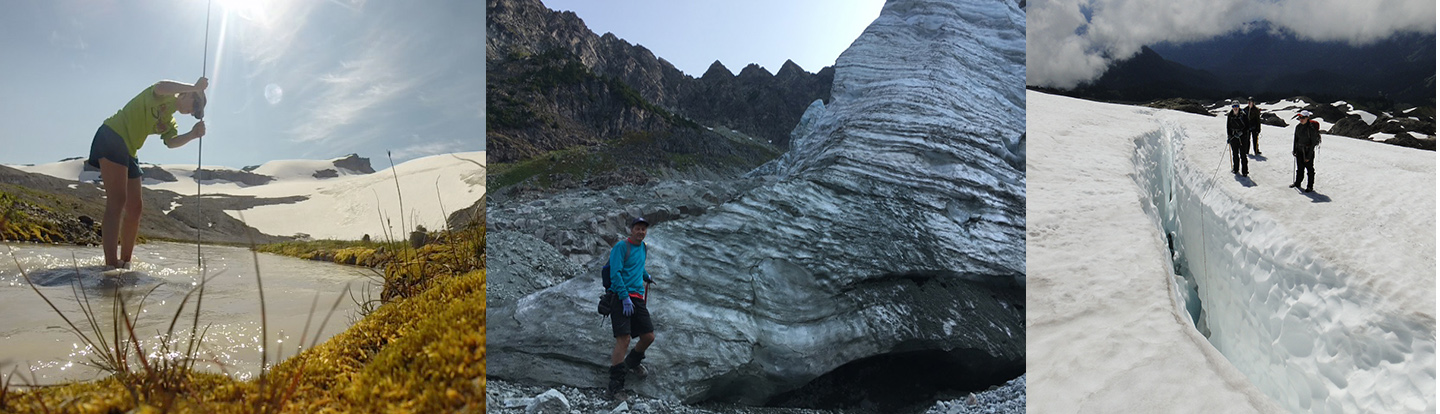
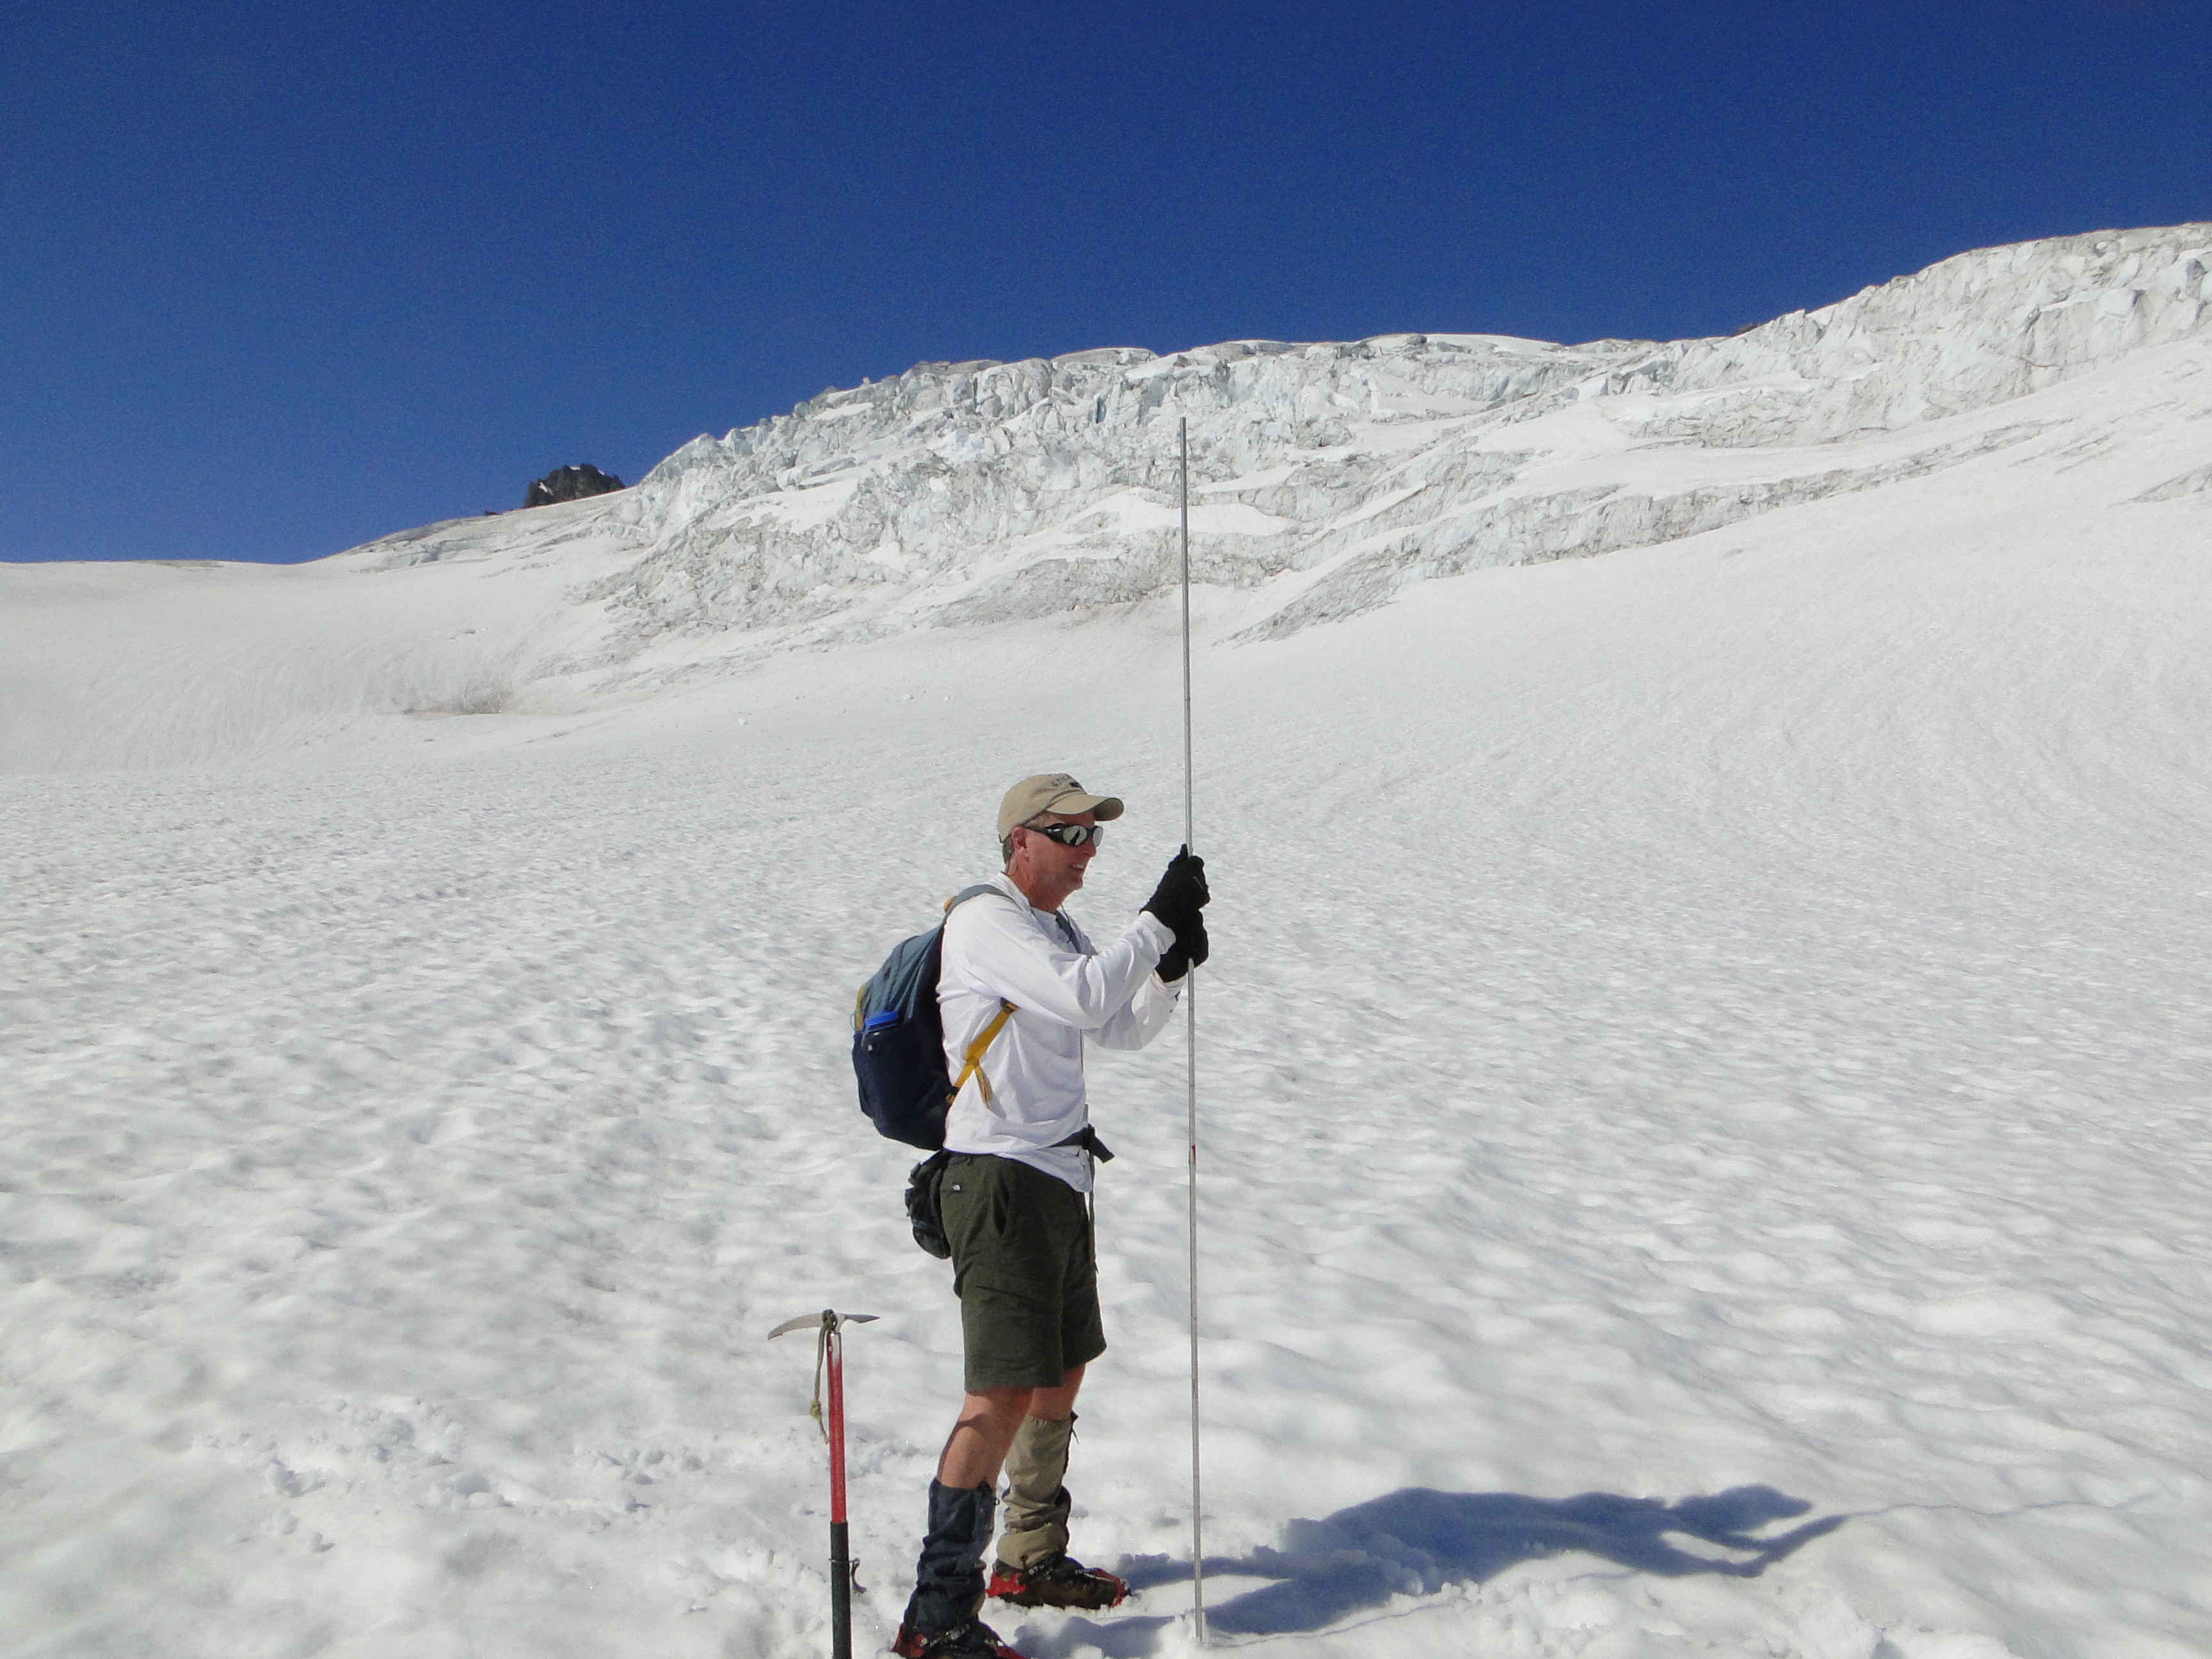
Who we are? NCGCP was founded in 1983 to identify the response of North Cascade glaciers to regional climate change, particularly changes in mass balance, glacier runoff and terminus behavior. NCGCP is a field project that has a broader interdisciplinary scope and examines more glaciers than any other program in North America. It does so cost effectively relying on no permanent camps, helicopter support or salaries for the director. The field season includes no days off and each day is spent completing measurements on glaciers. The focus is on glacier mapping, mass balance measurement, terminus observations and glacier runoff monitoring. 
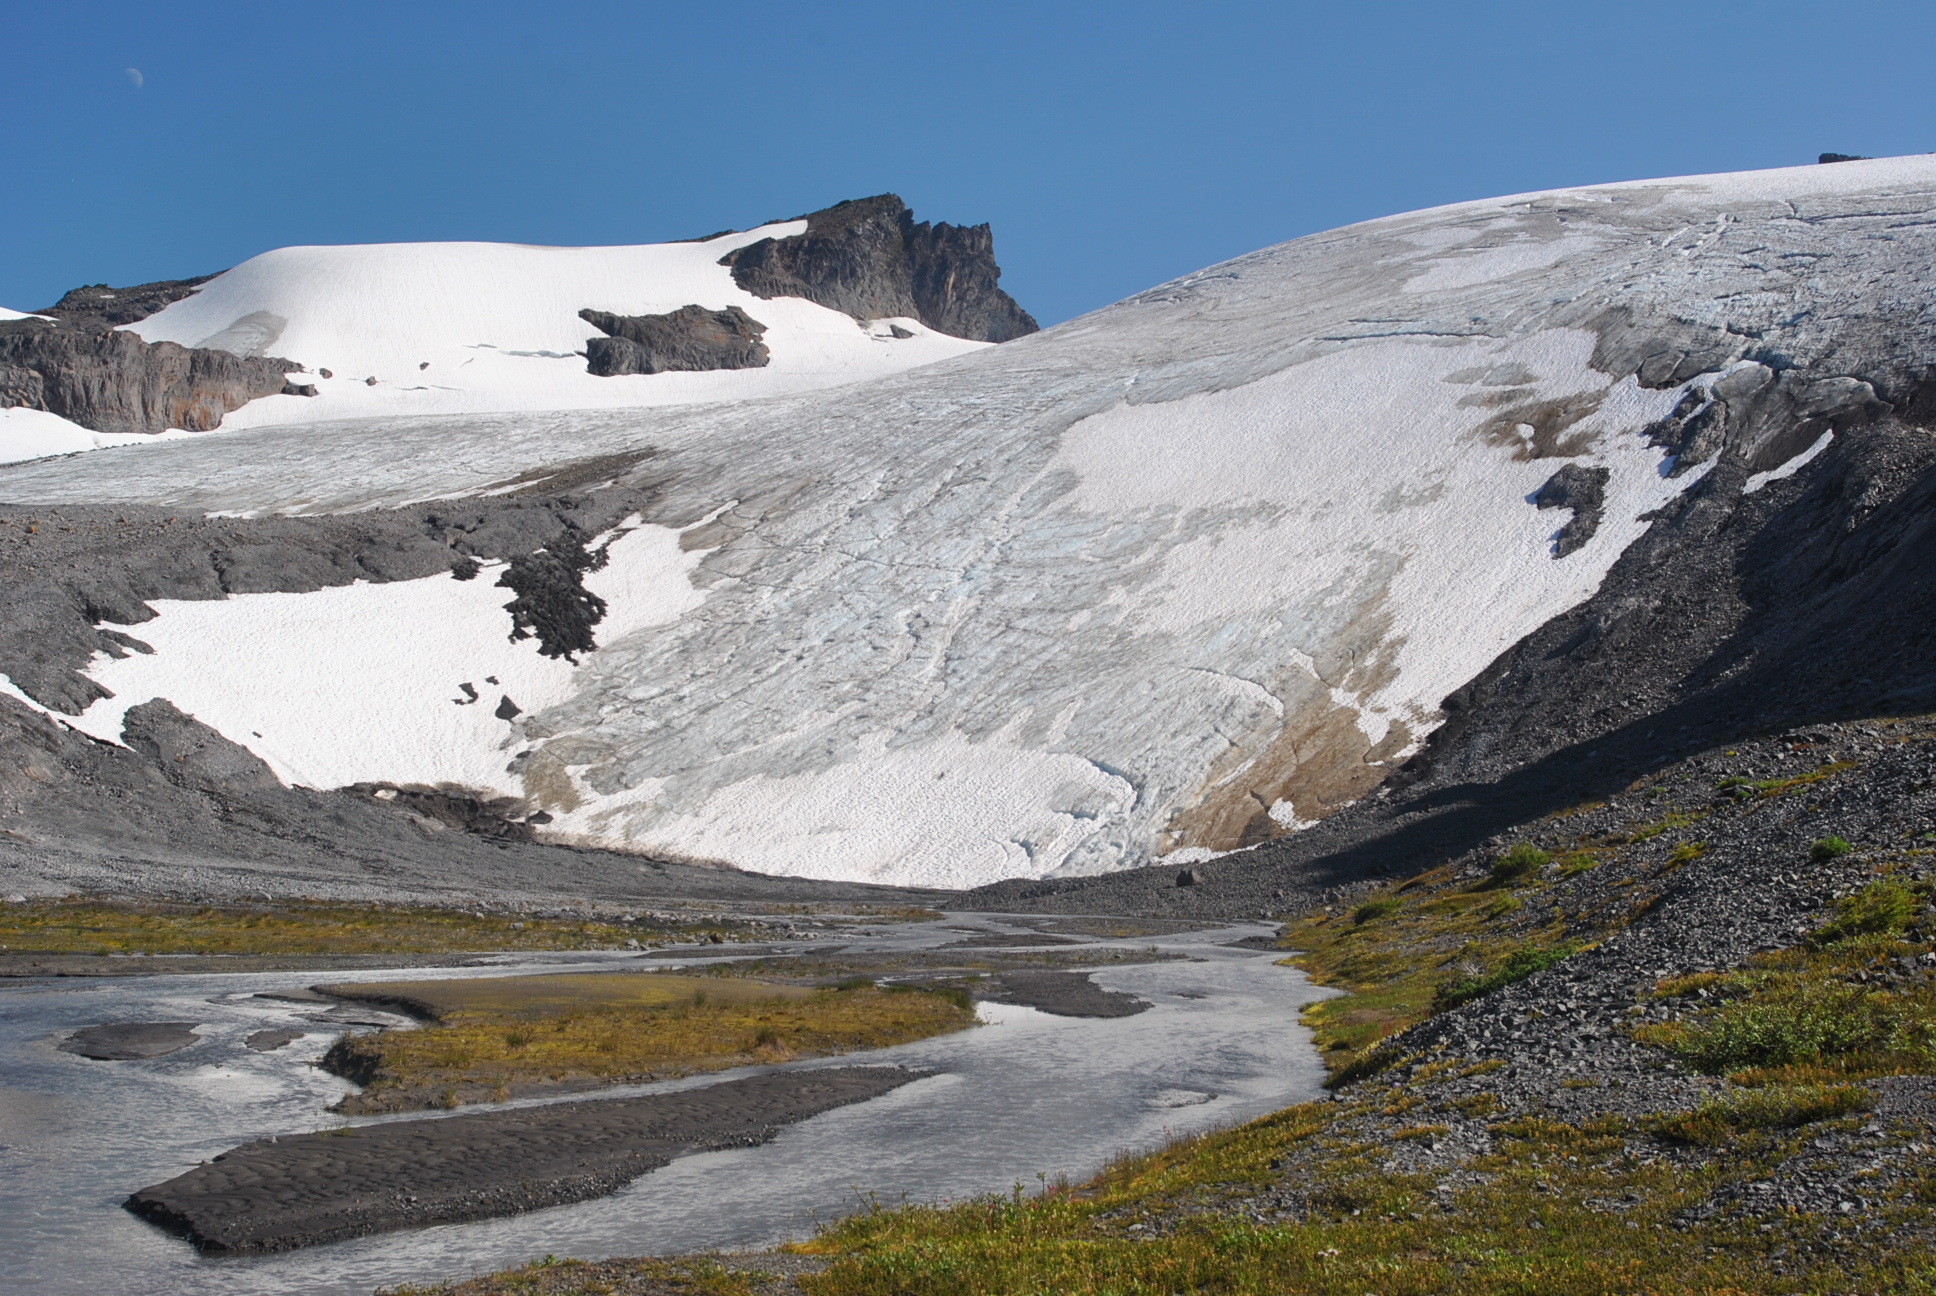
Why study glaciers in the North Cascades? Glaciers are one of the world’s best climate monitors and are a critical water resource to many populated glaciated regions. This is particularly true in the North Cascades where 700 glaciers yield 200 billion gallons of summer runoff and glaciers have lost 30 % of their area in the last century. This has reduced glacier runoff in late summer in the region as the reduction in glacier area has been exceeded the increase in melt rate (Pelto, 2011) .
Field Team 2021:
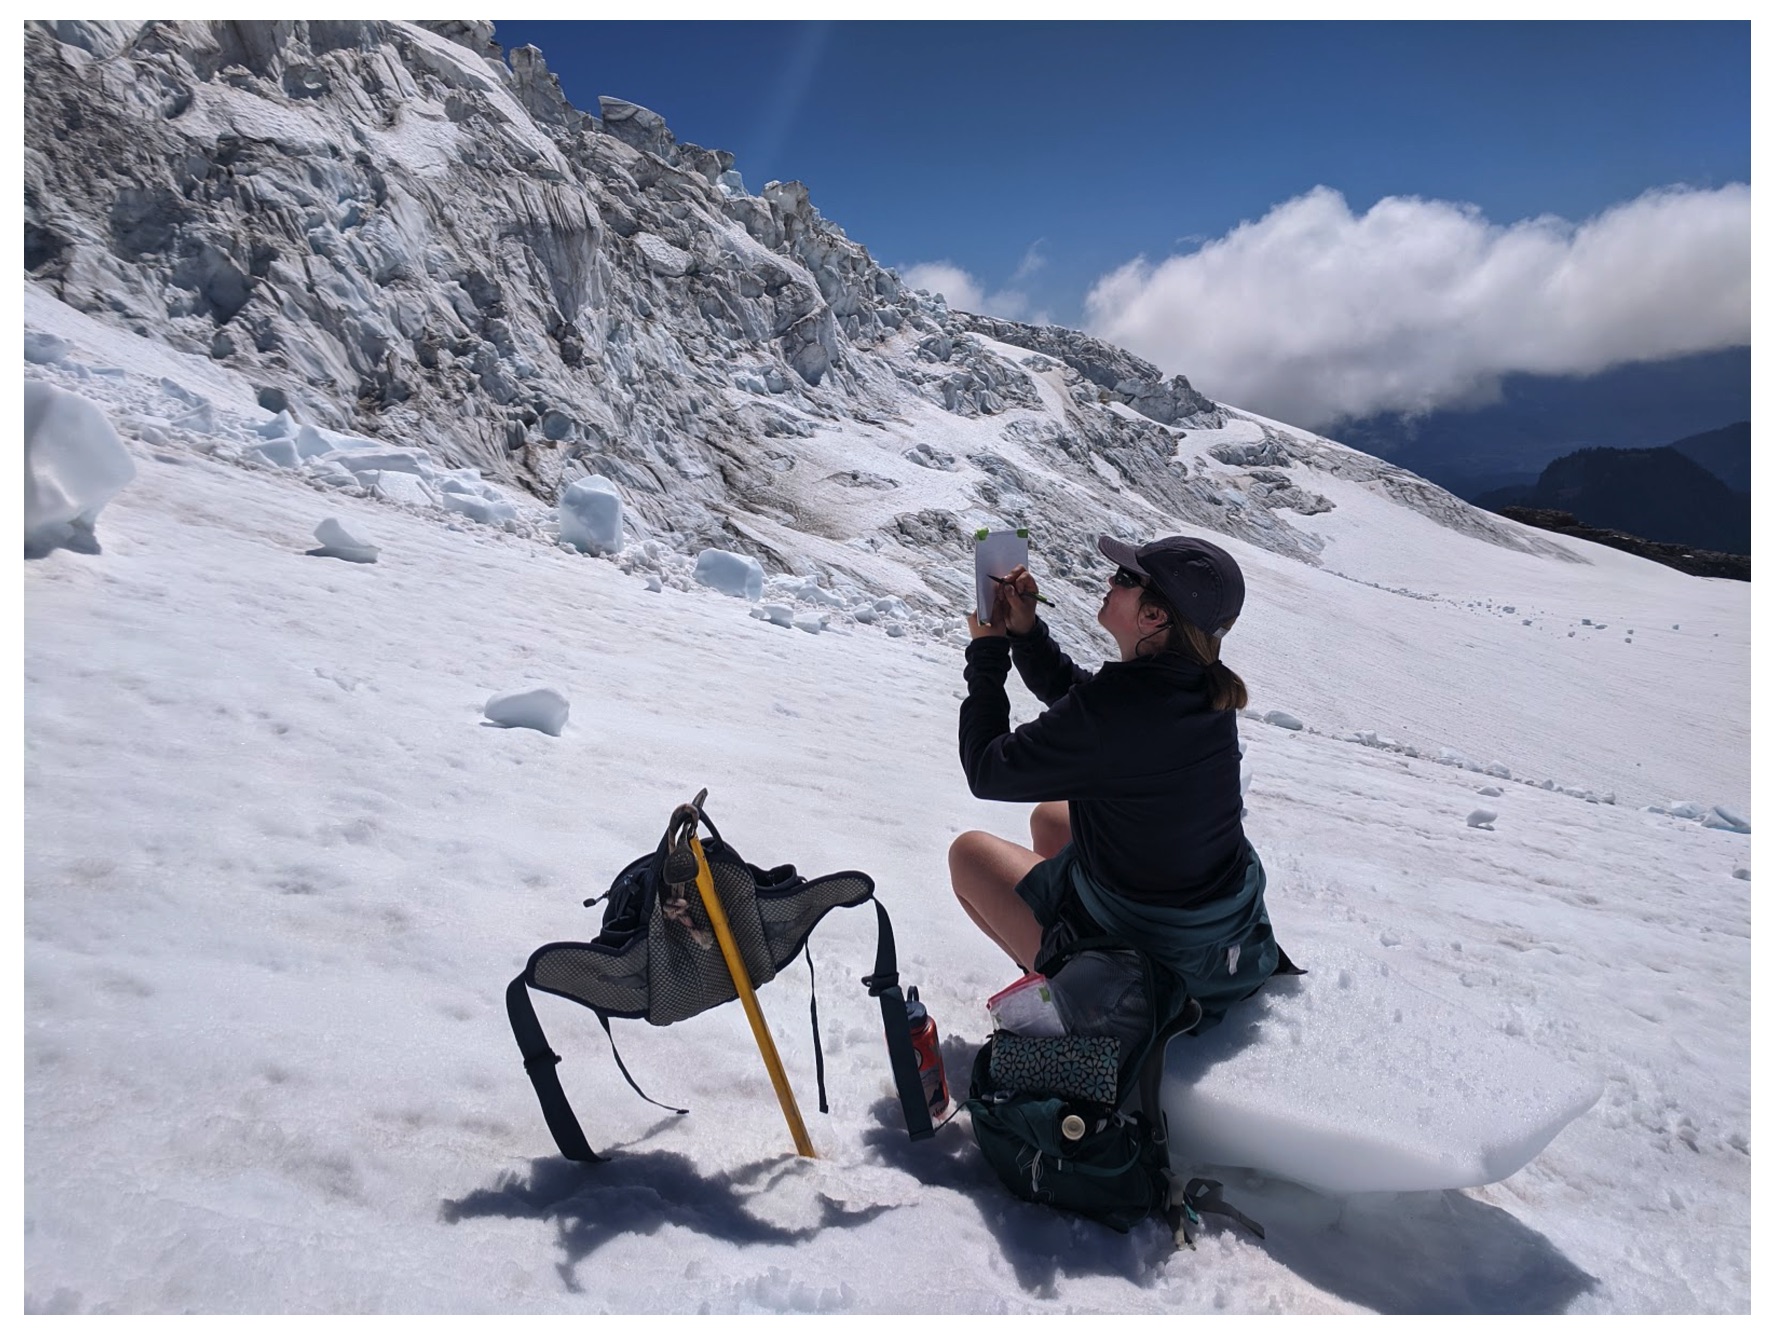
Jill Pelto is an artist and scientist from New England who grew up loving winter sports and trips to the mountains. She incorporates scientific research and data into paintings and prints to communicate environmental changes. Her multi-disciplinary work weaves visual narratives that reveal the reality of human impacts on this planet. She completed both her B.A. degrees in Studio Art and Earth and Climate Science and her M.S. focused on studying the stability of the Antarctic Ice Sheet at the University of Maine, spending two field seasons at a remote camp in the southern Transantarctic Mountains. Jill will be joining the project for her 13th field season. She is excited to continue documenting North Cascade Glacier changes that she has witnessed each of the last 12 years—through science and art.
Jill Pelto sketch of Easton Glacier Icefall
Mauri Pelto has directed the project since its founding in 1984, spending more than 700 nights camped out adjacent to these glaciers. He is the United States representative to the World Glacier Monitoring Service, author of the AGU blog “From a Glacier’s Perspective”, and associate editor for three science journals. His primary job is Dean of Academic Affairs at Nichols College, where he has been a professor since 1989.
Sally Vaux (she/her) is an incoming MS student in Environmental Science at Western Washington University. Her research interests include the impacts of aerosol deposition on snow and ice melt and equitable K-12 science education. While obtaining her BS in Environmental Science from WWU, Sally began a water quality monitoring project focused on dissolved organic carbon in the Nooksack River. This summer, she is working on a NASA Space Grant project to understand how climate-driven increases in frequency and intensity of wildfires in the Arctic lead to light-absorbing aerosol deposition on sea ice and how these deposits impact ice albedo. She will also be working to adapt polar and alpine snow science into lessons for elementary and middle school students in Whatcom County, WA. Outside of school and work, Sally likes to run, ski, bike, and read.
Ashley Parks is a recent Huxley graduate from Western Washington University, Environmental Science. Growing up in Bellingham and being an avid fan of winter sports, she has been able to become familiar with the North Cascade Mountain Range, inspiring her to become interested in the glaciology of her region. As glaciers enter a period of trouble due to the climate crisis, she hopes to connect our understanding of climate change effects on local glaciers, and what that means for local communities. Ashley will also be collecting pink snow for The Living Snow project which is run out of Western Washington University in order to characterize the biodiversity of the algae in the snow and its impact on snowmelt dynamics. This summer’s goal is to be able to communicate her findings through an artistic medium that she can share with others, and to be able to gain experience with field data collection.
Field Partners 2021
Alia Khan’s, research team including grad students Sally Vaux and Shannon Healy focus on environmental chemistry in the cryosphere, including black carbon and snow algae to document global change of glacier and snow melt in mountainous and polar regions.
Western Washington University Cryosphere Studies and Aquatic Biochemistry Lab.
Rose McAdoo, is a visual artist using desserts to communicate science and make big ideas digestible. Her work pulls her between New York City, Alaska, and Antarctica — where she works as the sous chef for NASA’s Long Duration Balloon atmospheric research camp and as a member of the winter Search and Rescue team. In 2019, her edible documentation of the U.S. Antarctic Program’s field season won the attention of NPR, Forbes, and — most recently — as the featured cover artist for the American Polar Society. She’s currently working as an ice climbing and glacier helicopter guide in Seward, Alaska, and is eager to further visualize the extensive research of the North Cascades Glacier Climate Project.
Cassidy Randall, is a freelance writer covering stories that push the boundaries on how we think about environment, adventure and people exploring the bounds of human potential https://www.cassidyrandall.com/ . She’s on assignment with NCGCP for National Geographic.
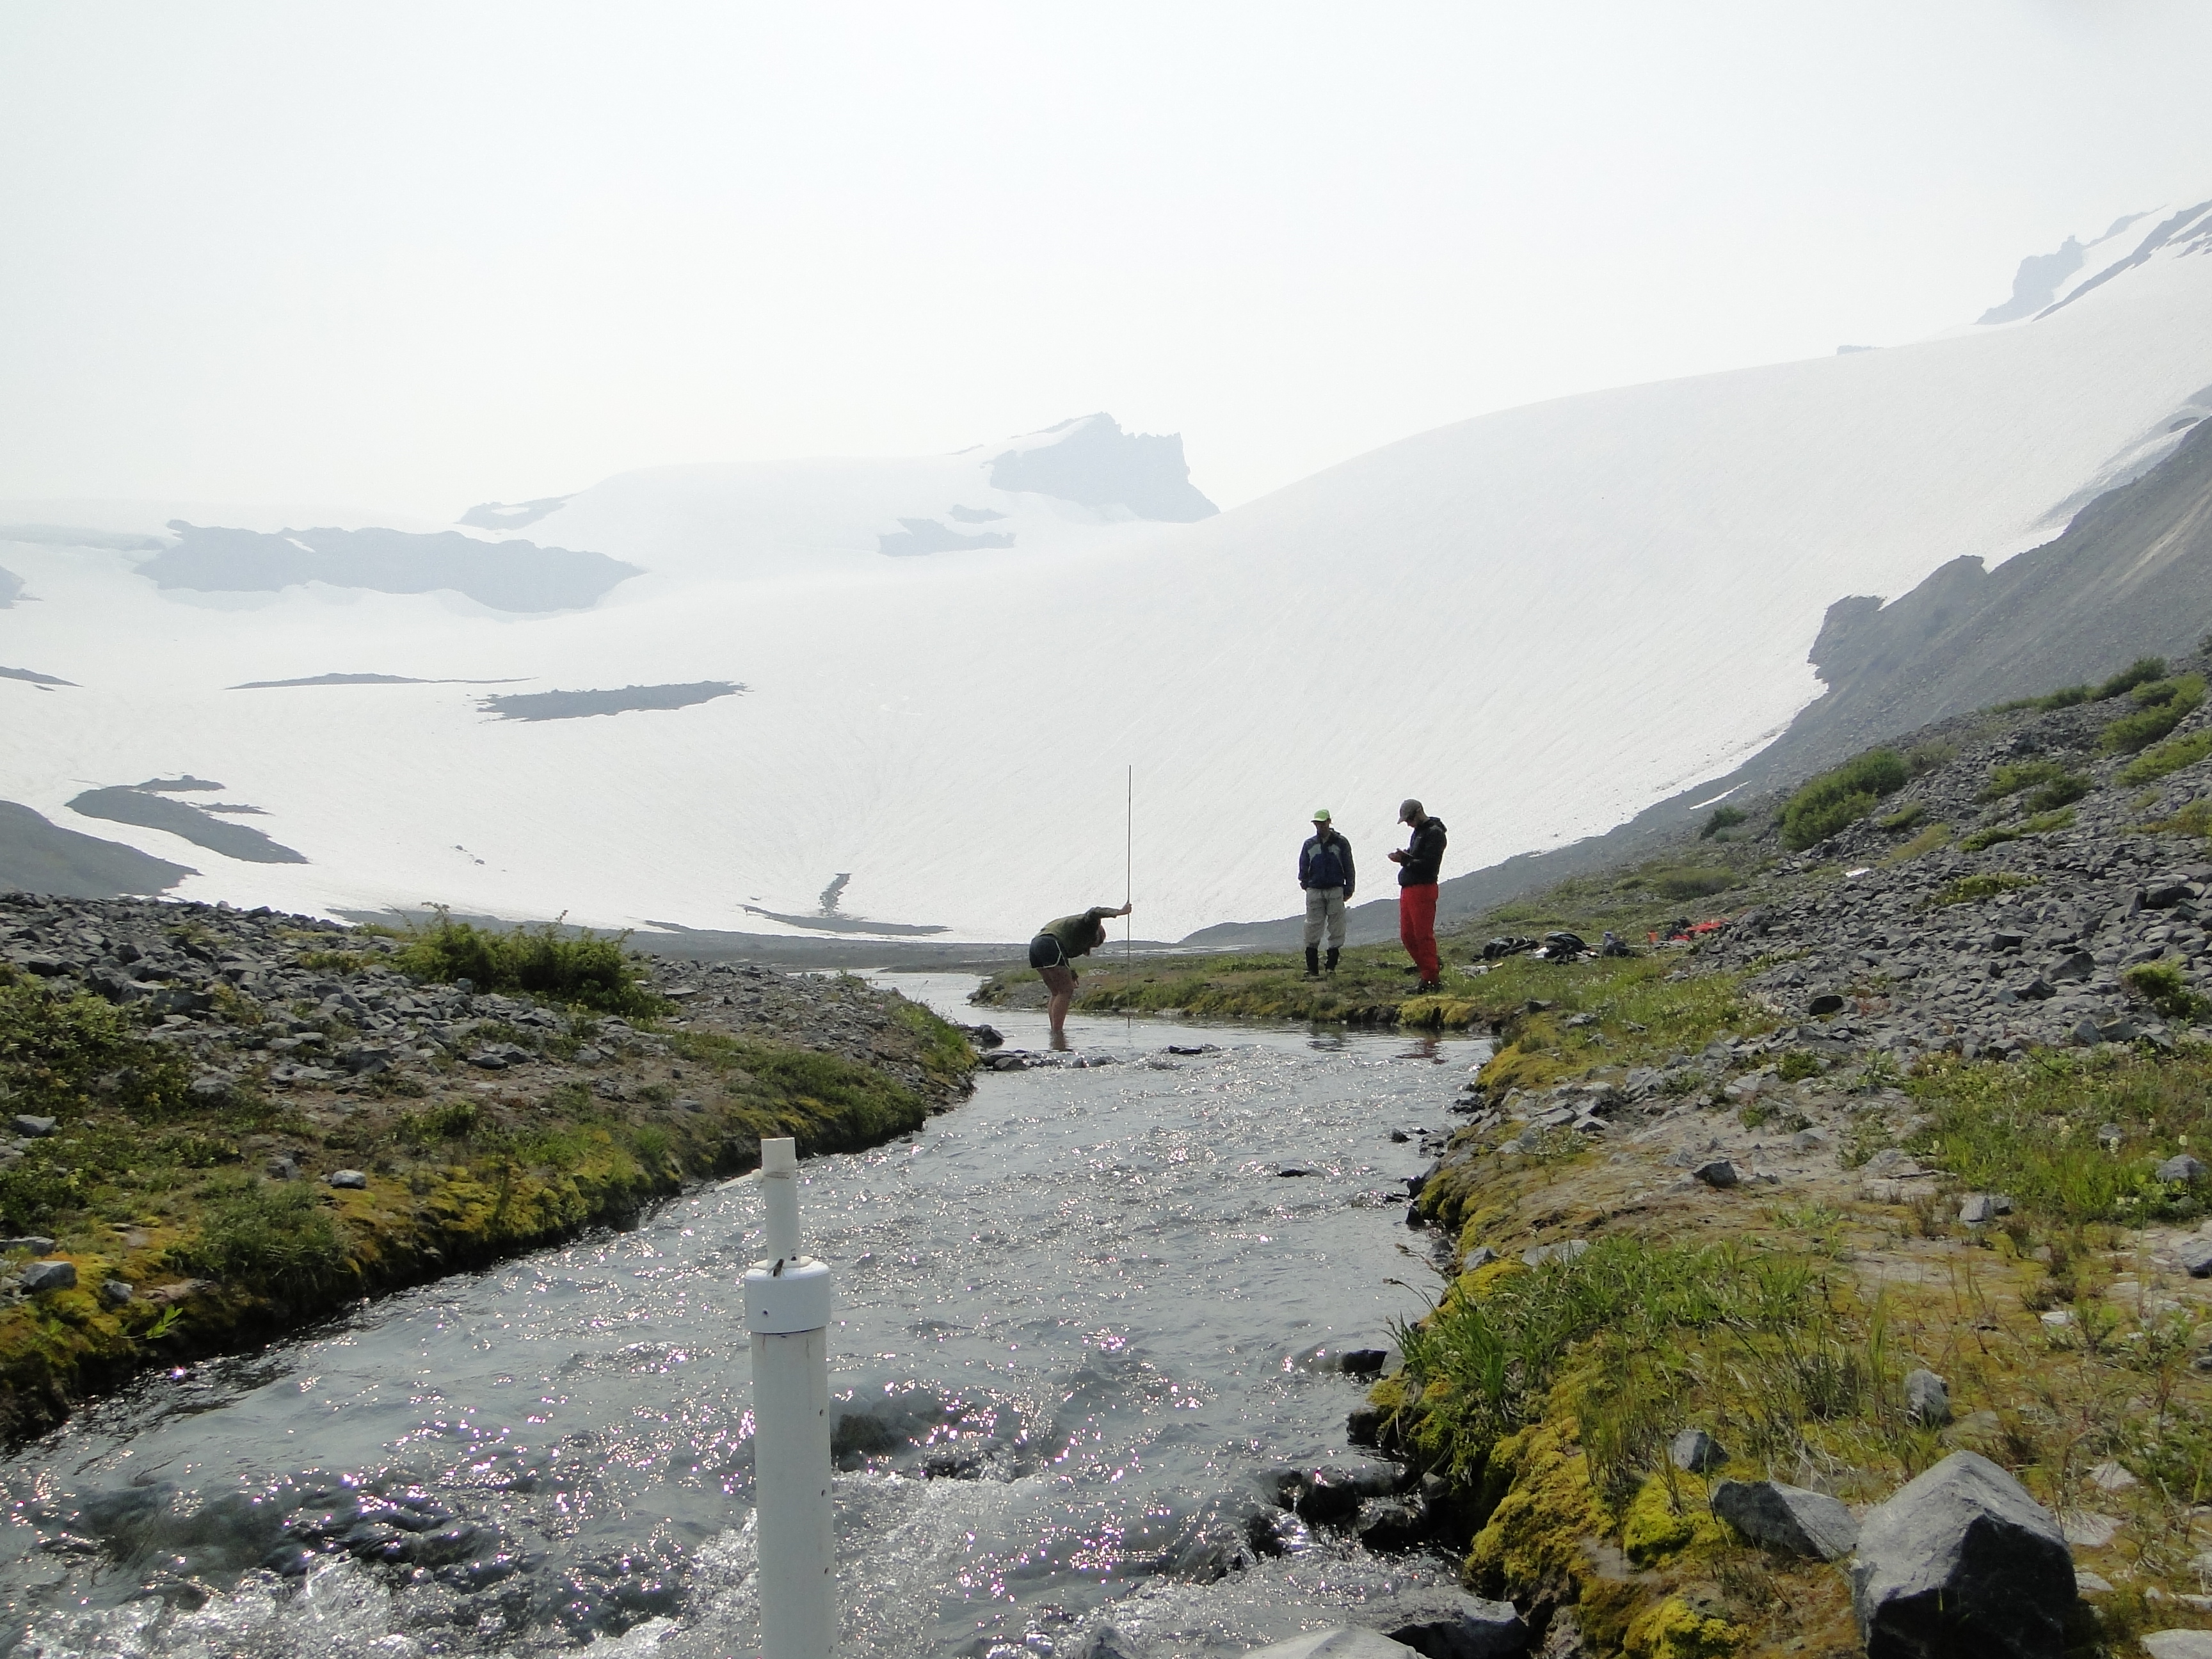
Nooksack Indian Tribe, for the 10th consecutive year we will be conducting field work aimed at providing field validation and streamflow calibration data below Sholes Glacier for the ongoing work of the tribe.
2021 Schedule
Jul 31: Hike in Columbia Glacier
Aug. 1: Columbia Glacier
Aug. 2: Columbia Glacier
Aug. 3: Hike Out Columbia, Hike in Ptarmigan Ridge
Aug. 4: Sholes Glacier
Aug. 5: Rainbow Glacier
Aug. 6: Rainbow Glacier
Aug.7: Hike out, Hike In Lower Curtis Glacier
Aug. 8: Lower Curtis Glacier
Aug. 9: Hike out, Hike in Easton Glacier
Aug. 10: Easton Glacier
Aug. 11: Easton Glacier
Aug. 12: Hike out Easton/Hike in Daniel
Aug. 13: Ice Worm Glacier Survey
Aug. 14: Daniel and Lynch Glacier Survey
Aug. 15: Hike out
Aug. 16: Arrive home