Svalbard Ice Cap Fragmentation and RecessionAccelerates with Snow Free Conditions Again in 2025

Kvitkapa in Landsat images from 2014 and 2025 indicating the fragmentation from 3 to 8 different glacier parts.

In 2022, 2023 and 2024 a number of ice caps and glaciers across Svalbard lost all snow cover, ie. Edgeøya 2022. The result by 2024 was that all firn cover had been lost as well on many of the ice caps of Edgeoya, such as on Digerfonna. This largely removes the ability of meltwater to refreeze. In 2025 we again see this playing out on the ice caps of Edgeøya. This all too familiar story indicates these glaciers lack a consistent accumulation zone that is essential for their survival

Map of Kvitkapa from TopoSvalbard indicating one interconnected ice cap in 2000.

Kvitkapa is an ice cap on a peninsula on the south coast of Edgeøya Island. In a map of this region from TopoSvalbard this is a single interconnected system of glaciers. By 2014 Landsat imagery indicates the ice cap has separated into three sections. By 2025 the ice cap has fragmented into eight different parts.

On the next peninsula to the east Kvalpyntfonna has also lost all snow cover again 2025.

Kvalpyntfonna in Landsat image from 2025 having lost all its snow cover and has no residual firn from previous winters either.

Further north and east on Edgeøya the Stonebreen ice cap has also losts its snow cover and firn cover driving thinning and retreat. The consistes loss of snow cover and resultant loss of firn cover, indicates that most ice caps Edgeøya cannot be sustained.

Stonebreen in false color Sentinel image illustrating retreat from 2020-2025. The lack of retained snow cover and residual firn will lead to continued rapid thinning and retreat.

Digerfonna, Svalbard Snow Cover Free with Expanding Bedrock Emerging in 2024

Digerfonna in Aug. 28, 2024 Sentinel image illustrating the number of bedrock areas emerging/expanding Point A-S. There is no snowcover retained, which leads to overall firn loss and greater bare glacier ice exposed.

Digerfonna is the second largest ice cap on Svalbard’s Edgeøya Island at ~200 km2. Svalbard ice caps such as Digerfonna have low maximum elevations 450-550 m in this case. Noel et al (2020) explain that for Svalbard glaciers summer melt consistently exceeds winter snowfall and their survival depends on refreezing a considerable fraction of surface melt in the firn layer covering their accumulation zones. Recent high melt summers have reduced the area of firn cover significantly reducing the ability to refreeze and enhancing melt from darker bare ice surfaces.

Longyearben had its warmest August on record in 2024, indicative of Svalbard as a whole. This led to all snowcover being lost from Digerfonna by early August. This allows continued firn loss that also was observed in 2022 and 2023. On Aug. 28, 2024 the extent of firn is ~10 km2.

Areas of porous firn near crest of Digerfonna in false color Sentinel image from 8-28-2024.

The firn loss and thinning even at the highest elevations is evident by expansion of bedrock areas near the crest of the ice cap. Note comparsion to six year ago.

Digerfonna in Aug. 14, 20218 Sentinel image illustrating bedrock areas emerging. There is 55% of the ice cap with firn or snow cover retained, which leads to overall firn loss and greater bare glacier ice exposed.

Svalbard’s Snow Free Glaciers 2024

Trollheimen region with less than 10% snowcover remaining in this Landsat image from 8-11-2024, violet dots indicate retained snowcover. N=Nansenbreen, B=Borenbreen, C=Charlesbreen, V=Vestgotabreen, Hu=Hydrografbreen, E=Eidenbreen, V=Venerbreen, Vs=Vetterbreen, H=Harrietbreen and Es=Esmarkbreen.

Svalbard has experienced a warm July and August in 2024. Landsat images reveal the extent of snowcover loss on Svalbard glaciers. This follows on 2022 which had been the warmest summer on record in Svalbard and led to many snow free glaciers (Pelto, 2022). This record was exceeded in summer 2023 (Copernicus Climate Change Service, 2024). Here we look at Landsat images in August illustrating the widespread nature of the extensive glacier snow cover loss. This adds to the glaciers reviewed earlier this month (Pelto, 2024).

For the glaciers of Spitsbergen to maintain .equilibrium requires 50% of the glacier needs to be snowcovered at the end of summer. By mid-August with a month left of summer melt, the area is below 10% on every glacier noted above. How much more melt will occur. The net result will be extensive mass loss once again (NASA EO, 2024).

Storskavlen Ice Cap on Edgeoya is snowfree on 8-23-2024 in this Landsat image. Thinning ice is leading to expanded bedrock areas amidst the ice.

Essentially snowfree conditions on Svalbard glaciers on this Landsat image from 8-11-2024. P=Passbreen, M=Margitbreen, Bo=Brorbreen, S=Sorbullbreen, An=Andrinebreen, Ab=Abreen, B=Bjarmebreen.

Widespread Snow Free Glaciers in Svlabard 8-2024

Most Svalbard glaciers in this Landsat image from 8-8-2024 are snow free. This view is centered on 78 N and 19 E spanning parts of Barentsoya, Edgeøya and Spitsbergen. On Langjokulen (La), Kvitisen (Kv), Bergfonna (Be), Blaisen (Bl) and Storskavlen (St) on Edgeøya snow cover is gone. Bjarmanbreen (Bj), Passfonna (Pa), Hellefonna (He), Sveigbreen (Sv), Nordmannsfonna (No), Isrosa (Is), Kamfonna (Ka), Breitfonna (Br), Rugaasfonna (Ru), Hayesbreen (Hy), Heuglinbreen (Hu) on Spitsbergen all snowcover is lost.There is a small amount of snowcover left in the upper reaches of a few glaciers including Freemanbreen (Fr), Gruvfonna (Gr), Siakbreen (Si), Von Postybreen (VP) and Fimbulisen (Fi).

All the glaciers labelled in the Nathorst Land and Nordenskjold Land region of Svalbard are snow free on 8-11-2024 in this Landsat image. Er=Erdmannbreen, Fr=Fridtjovbreen, Gr=Gronfjorden, Ta=Taviebreen, Ma=Marstranderbreen, Gl=Gleditschfonna in Nordenskjold. HO=Hoegh Omdalbreen, Sn=Snokubreen, Fy=Frysjabreen, In=Instebreen, Ri=Richterbreen, Ri=Ringerbreen, La=Langlibreen, Lo=Loyndebreen, Lu=Lundbreen, Sy=Sysselmannbreen in Nathorst Land.

Warm temperatures across Svalbard in July and early August has resulted in many glaciers losing all of their snowcover. The result will be enhanced and significant thinning of these glaciers. This follows on 2022 which was the warmest summer on record in Svalbard and led to many snow free glaciers (Pelto, 2022). This record was exceeded in summer 2023 (Copernicus Climate Change Service, 2024). Here we look at Landsat images and Sentinel images across several islands from late July and early August illustrating the widespread nature of the extensive glacier snow cover loss.

For ice caps such as Glitnefonna, Langjokulen (La), Kvitisen (Kv), Bergfonna (Be), Blaisen (Bl) and Storskavlen (St), because of their low top elevation and relatively flat slopes their ability to survive is dependent on much of meltwater generated on the higher plateau areas being refreezing within the firn instead of escaping the glacier (Noel et al 2020). In 2020 the snowcover was lost and the firn thickness diminished. In August 2022 the snowcover again was lost and there was little evident firn that could lead to refreezing of meltwater. In August 2024 snowcover loss has again occurred.

For the glaciers of Spitsbergen to maintain .equilibrium requires 50% of the glacier needs to be snowcovered at the end of summer. By early August with a month left of summer melt, the area is below 10% on every glacier noted above. How much more melt will occur. The net result will be extensive mass loss once again (NASA EO, 2024).

Glitnefonna is a 145 km2 ice cap in Gustav Albert Land where snowcover declined from 55% snowcover on 7-22 (purple dots) to 0% snowcover on 8-9-2024 in these Sentinel images. A small area of saturated firn/snow is evident, yellow dots.
Glitnefonna is a 145 km2 ice cap in Gustav Albert Land where snowcover declined from 50% snowcover on 7-18 (yewllow dots) to 0% snowcover on 8-9-2024 in these Landsat images.

Freemanbreen, Svalbard Retreat Leads to Island Formation

Freemanbreen in 1990 and 2022 Landsat images.  Both are years with limited retained snowcover (S) and some area of retained firn (F). The glacier has retreated from a new island that had formed at Point D. At Point A-C glacier melt and resultant thinning has exposed and expanded bedrock areas.

Freemanbreen is the primary southern outlet glacier of the icecap that dominates Barentsøya, Svlabard. Here we examine Landsat imagery from 1990-2022 to illustrate the the impact of climate change on this glacier. Dowdeswell and Bamber (1995) report that Freemanbreen last surged in 1956 and has retreated since, and that most of its bed is above sea level. Morris et al (2020) note a thinning rate of -0.6 m/year for the area from 2011-2017 that is driven by atmospheric temperature and sea surface temperature warming.

In 1990 Freemanbreen experienced a year of extensive melt with limited retained snowpack (S), there is some retained firn which does retain some percolating meltwater from the snowpack. The glacier extended beyond its fjord ending in a convex tidewater front in Freeman Sound. By 2010 the glacier had retreated into the fjord and was pinned on an island in the center of the fjord. By 2013 the glacier had pulled back from the island and the terminus has since developed a concave terminus front. In 2022 the glacier has retreated 800 m from the island  (Arrow-Point D) and 1.8 km from its 1990 position. The tidewater front has been reduced from 2.8 km to 1.3 km. The reduction in calving has not offset the increase in glacier melt resulting in continued retreat. The surface melt has led to surface thinning and the expansion or exposure of bedrock areas amidst Freemanbreen at Point A-C. In 2022 the glacier experienced another summer of extensive melt, likely the most extensive melt in the region in at least the last 50 years (Climato-Liege University).  This left the glacier largely bare of snowpack, with less than 5% snowcover in the area above 500 m near Point C and limited retained firnpack from previous years note NW of Point B. The ice cap summit is in the 600 m range. This loss is similar but not as complete as obseved on the ice caps of Edgeøya.

Left image aerial photograph from TopoSvalbard, at right Sentinel 2 image from 2022. Island indicated by arrow.

Freemanbreen surface conditions in Sentinel image from 8-19-2022, snow cover (S), Firn Cover (F.)

Edgeøya, Svalbard Ice Caps Snow Free in 2022; Fragmentation Ongoing

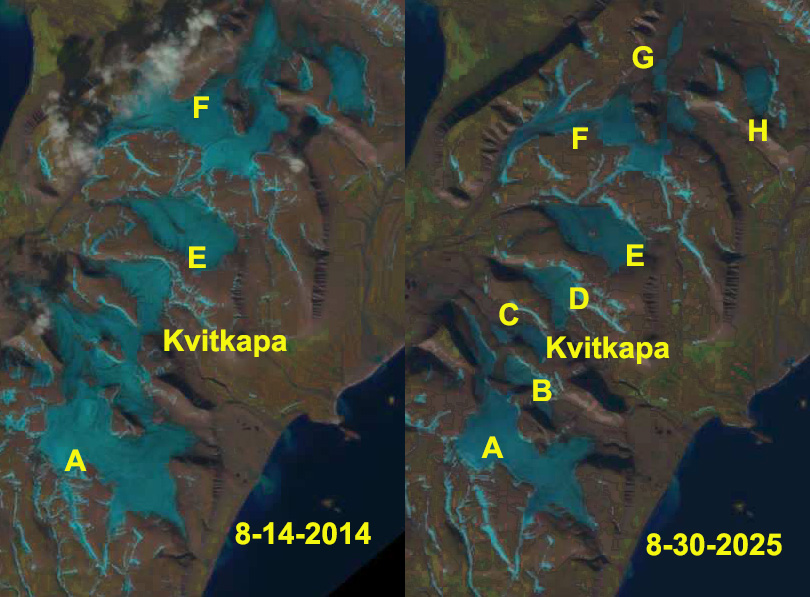
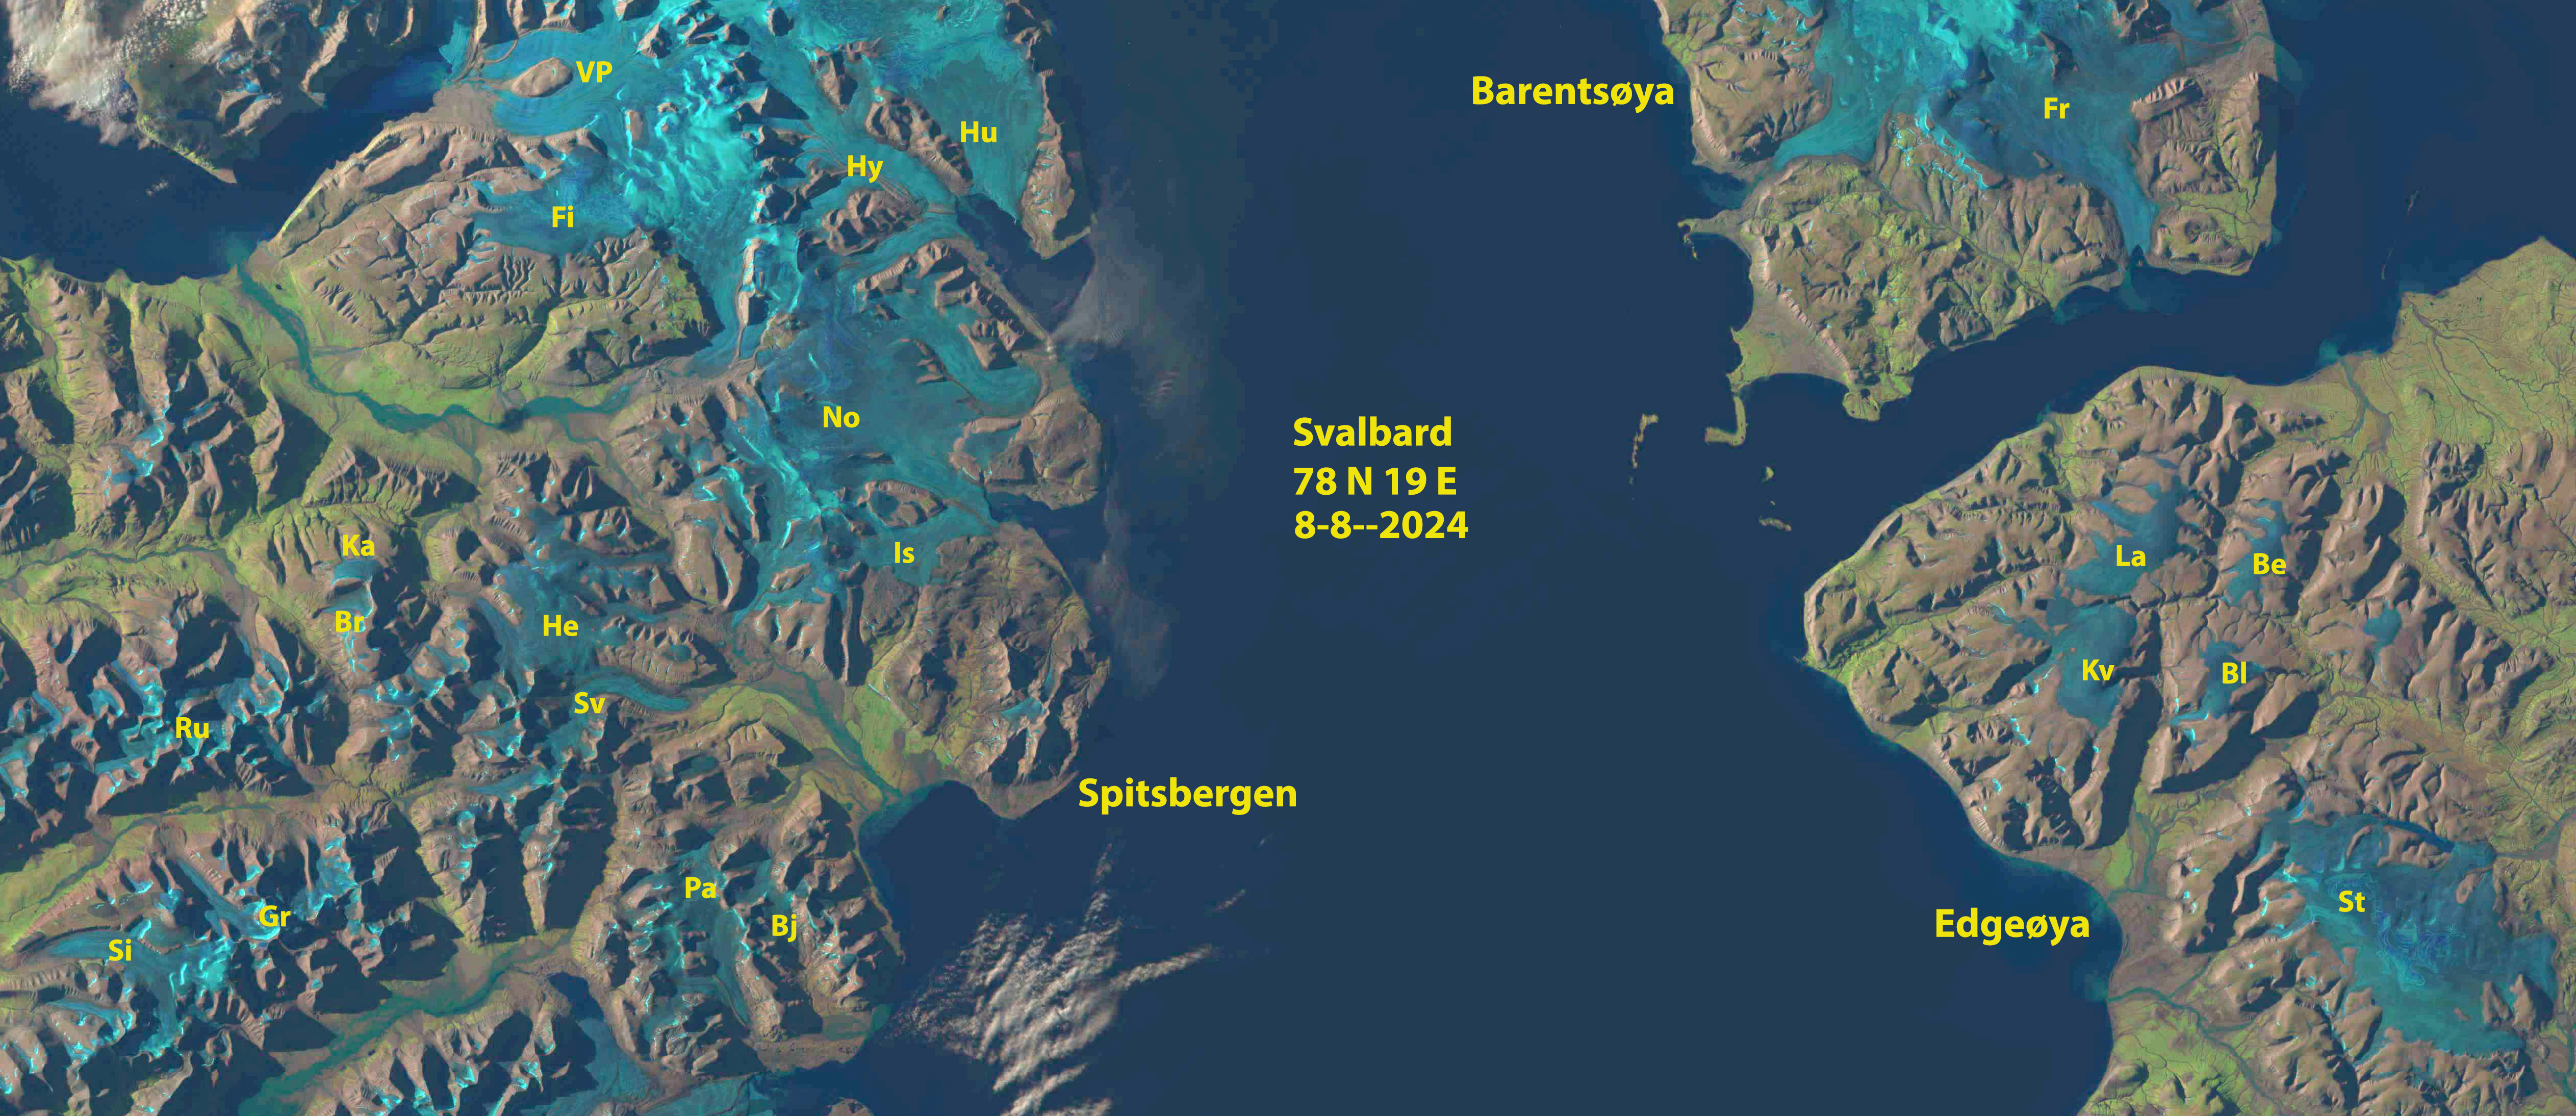
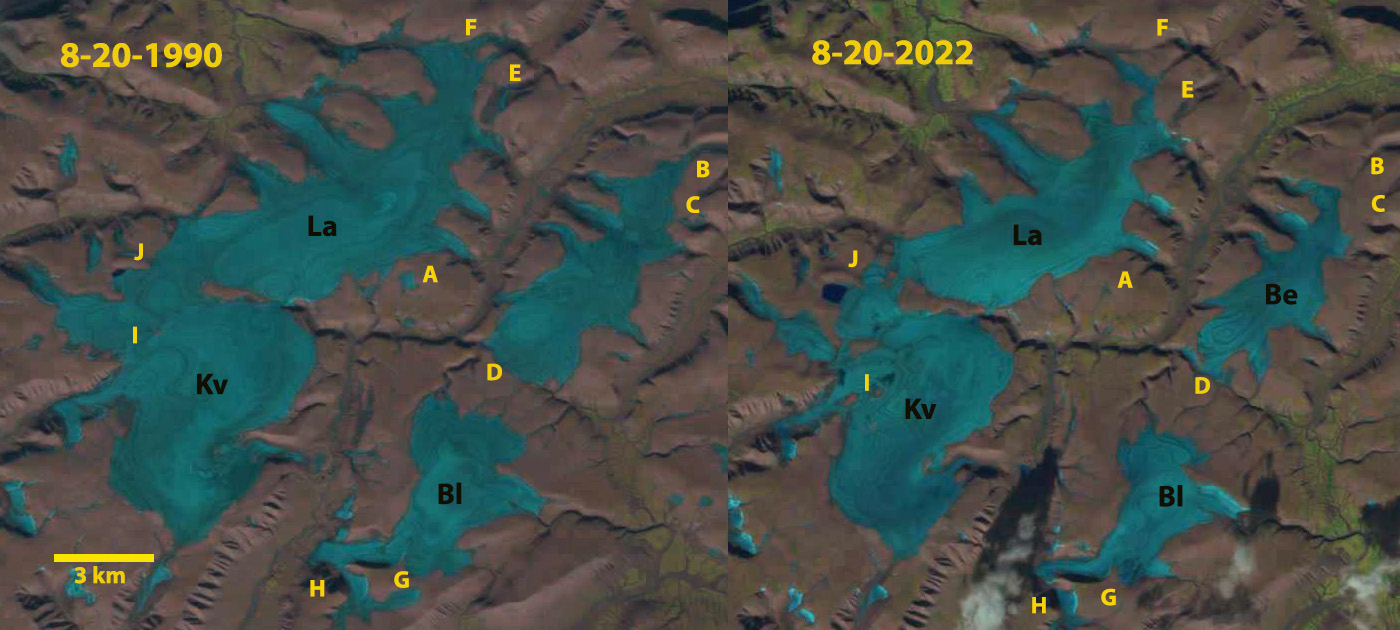
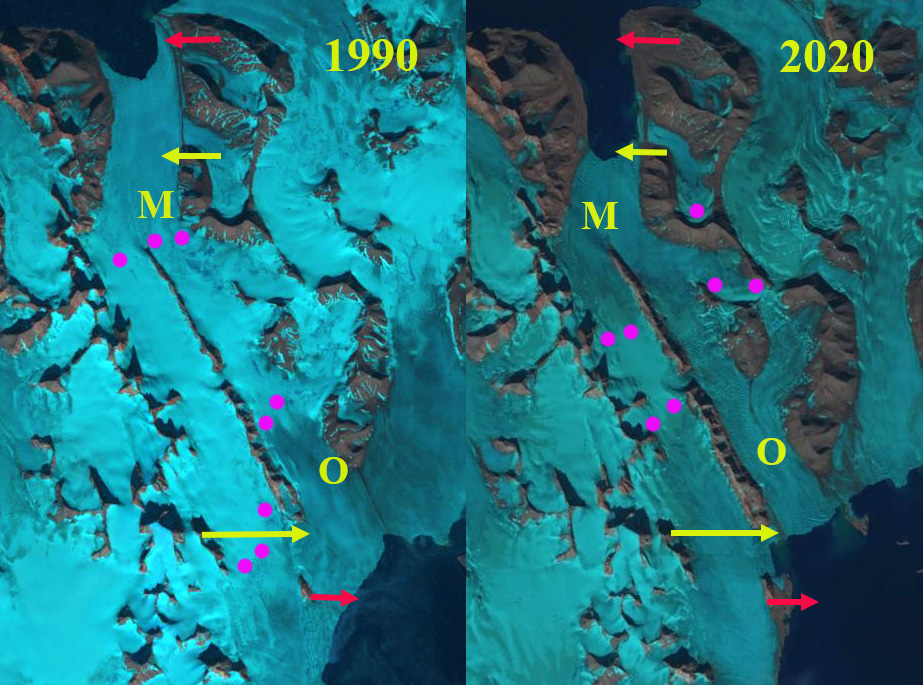
Langjokulen (La), Kvitisen (Kv), Bergfonna (Be) and Blaisen (Bl) ice caps on Edgeøya in Landsat images from 1990 and 2022. Two years of excepational melt where the ice caps lost all of their snow cover. Here the changes in the ice caps are reviwed at Points A-J.

Edgeøya, Svalbard is ~40% ice covered had a number of ice caps some reaching tidewater and others in the interior (Dowdeswell and Bamber 1995). Here we focus on four inland ice caps that have there summits between 440 and 570 m. Thinning is prevalent across the Edgeøya ice caps with significant thinning even at the highest elevations, though less than at lower elevations (Morris et al, 2020). Here we examine the changes of four inland ice caps Bergfonna, Blaisen, Kvitisen and Langjokulen with Landsat imagery from 1990, 2020 and 2022. The lack of retained snow cover is evident.  The annual layering is even more apparent in Sentinel imagery.

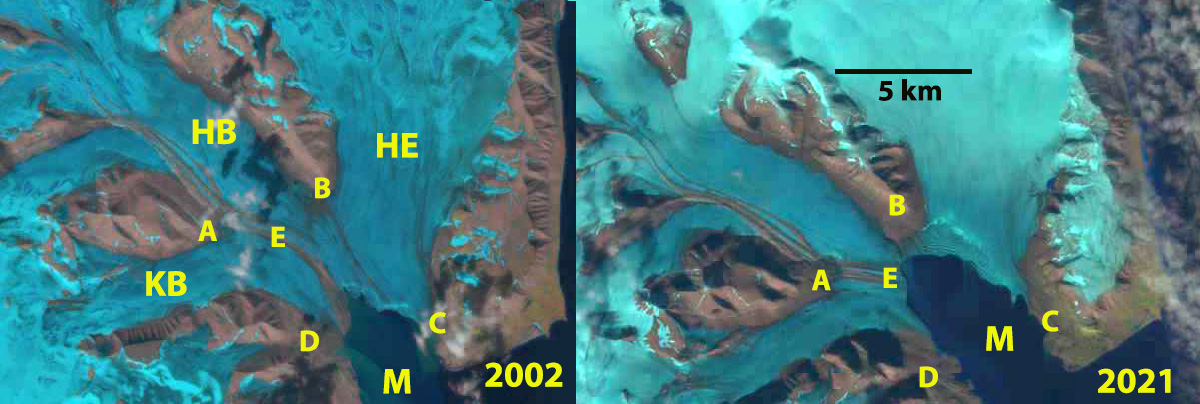
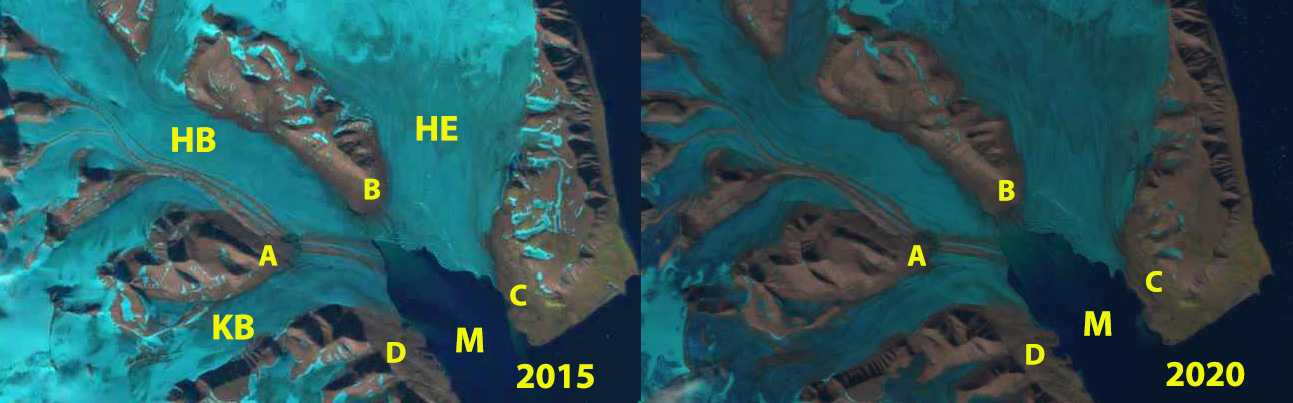
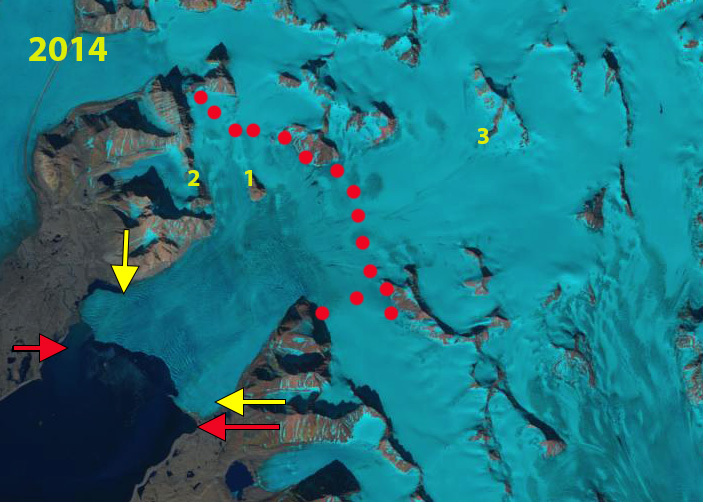
Point A- In 1990 a small glacier 0.15 km2 exists that dissapears by 2022.

Point B and C are valleys occupied by ice from Bergfonna outlet tongues that are gone by 2022.

Point D is the valley that Bergfonna terminated in along its southern margin that is now lost most of its ice infill.

Point E and F are valleys occupied by ice from Langjokulen that have lost that ice by 2022.

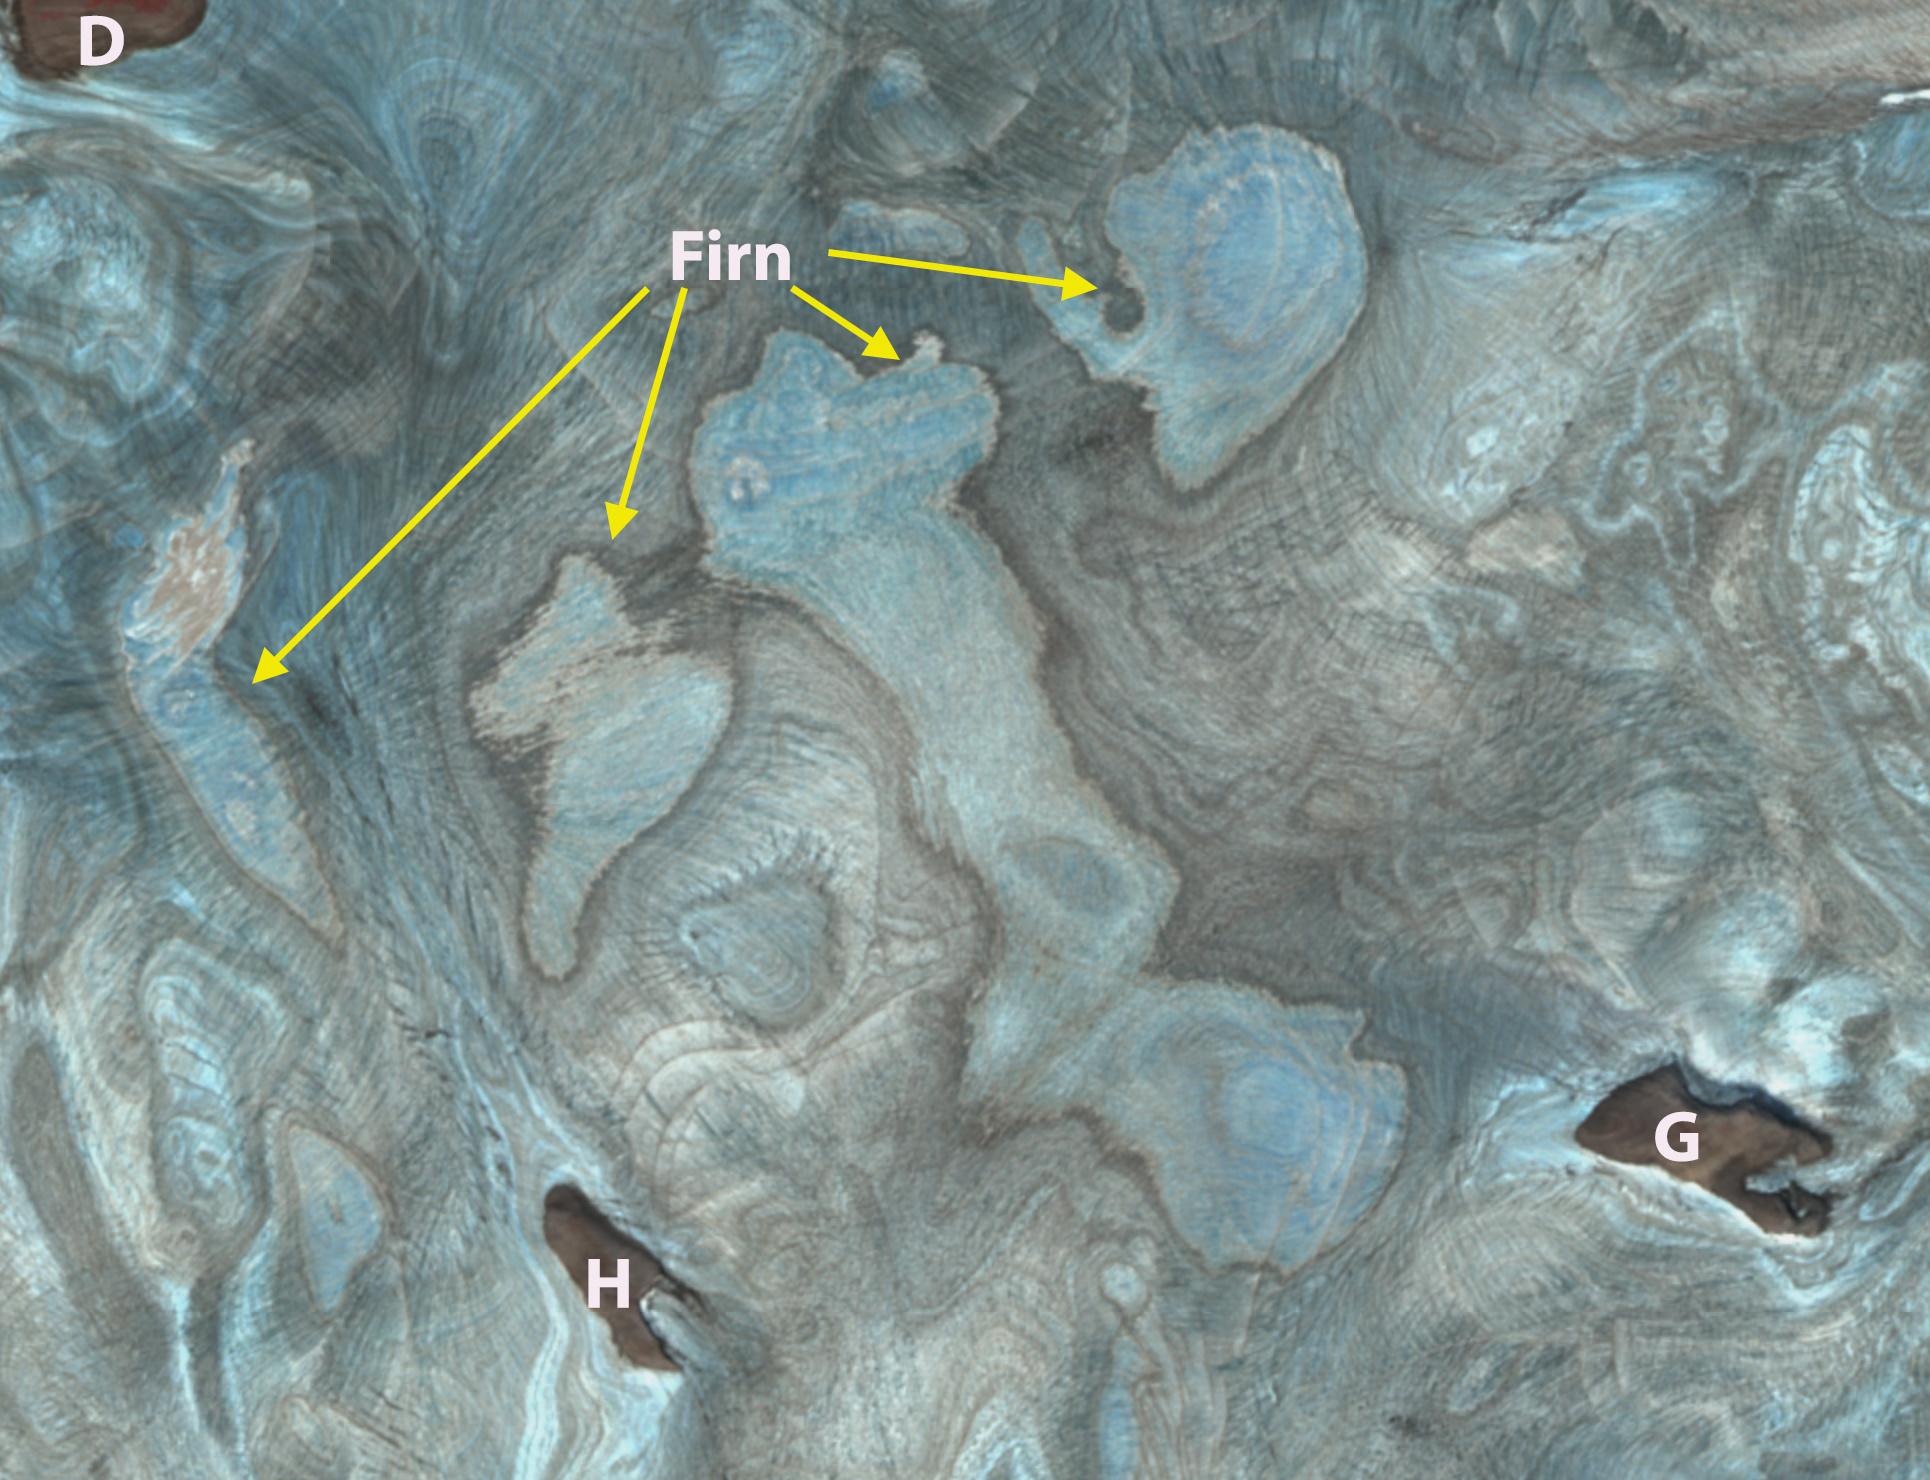
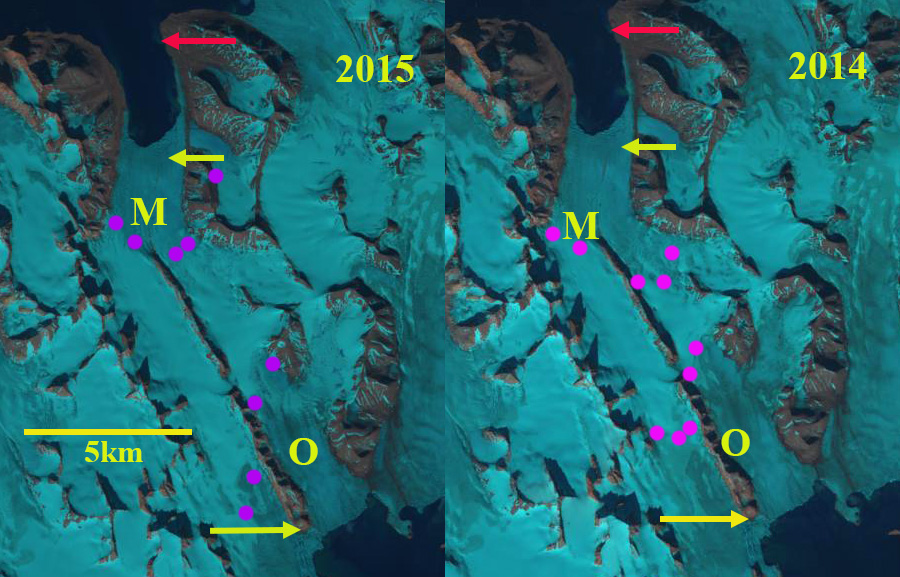
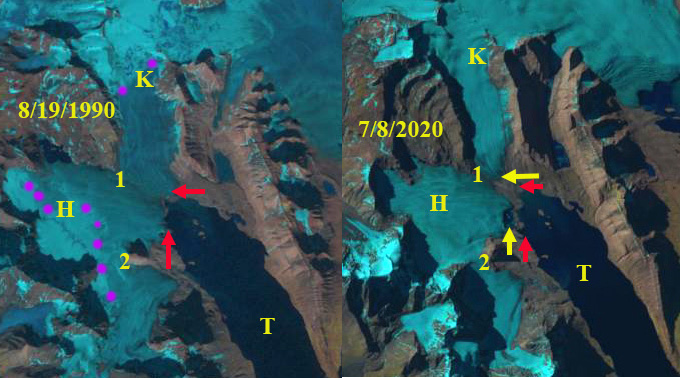
Point G and H are locations where Blaisen Ice Cap is fragmenting from 1990 to 2022.

Point I is where new bedrock is emerging as Kvitisen thins.

Point J is the location of an expanding proglacial lake now with an area of 0.3 km2 on the northwest side of Kvitisen.

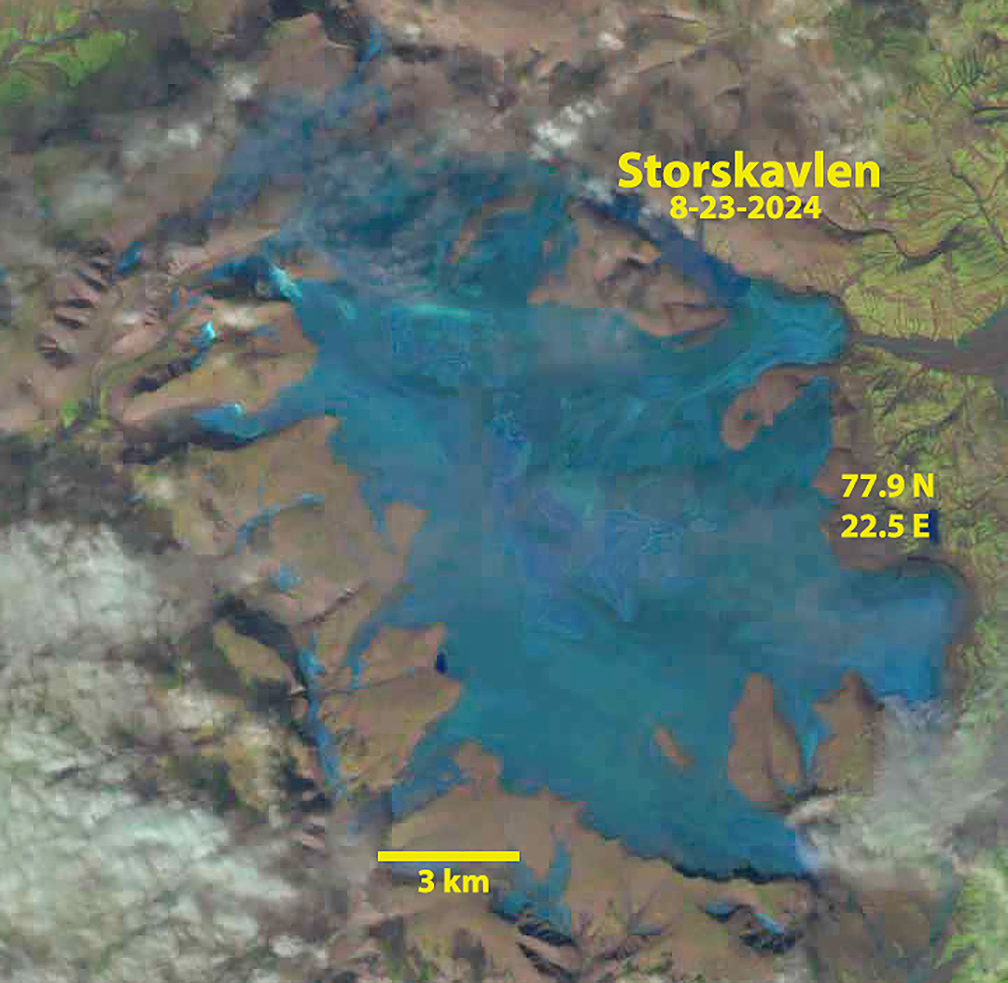
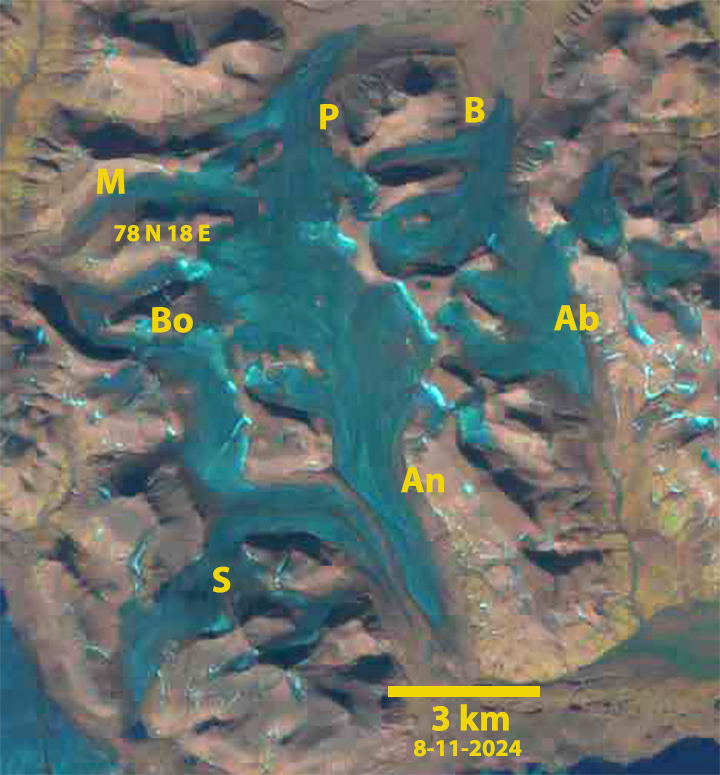
Langjokulen (La), Kvitisen (Kv), Bergfonna (Be) and Blaisen (Bl) ice caps on Edgeøya in Sentinel image from 8-20-2022 illustrating the lack of snowcover, limited firn areas and numerous annual layers. This pattern of annual layers due to glaciers being stripped of snow cover is becoming increasingly frequent. Note Andes last winter and Pacific Northwest summer 2021.

Because of the low top elevation and relatively flat slopes their ability to survive is dependent on much of meltwater generated on the higher plateau areas being refreezing within the firn instead of escaping the glacier (Noel et al 2020). In 2020 the snowcover was lost and the firn thickness diminished. In August 2022 the snowcover again has been lost and there is little evident firn that could lead to refreezing of meltwater. This will drive substantial volume loss of these ice caps in 2022. The MAR Arctic ice caps surface mass balance model illustrates the excess melt from Svalbard as over 1 m in 2022.

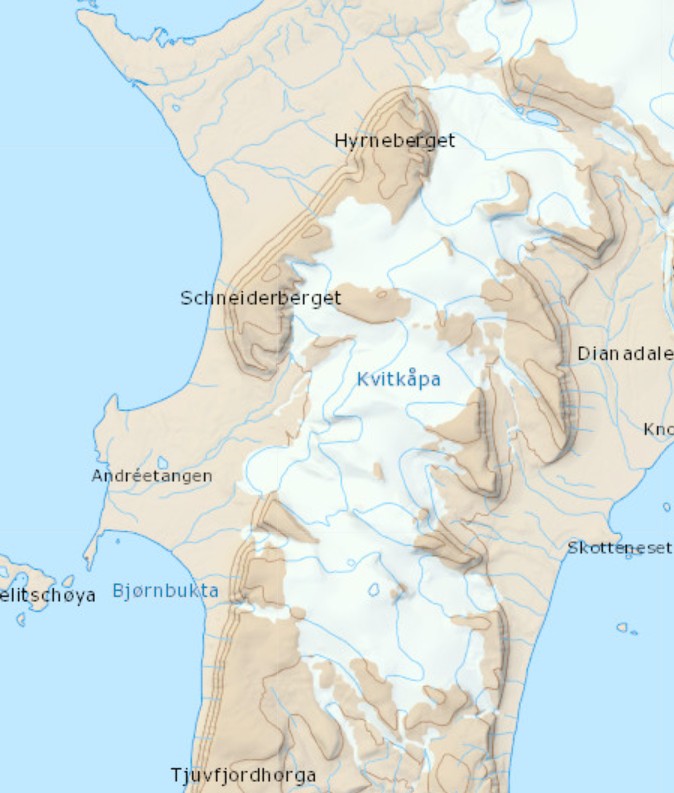
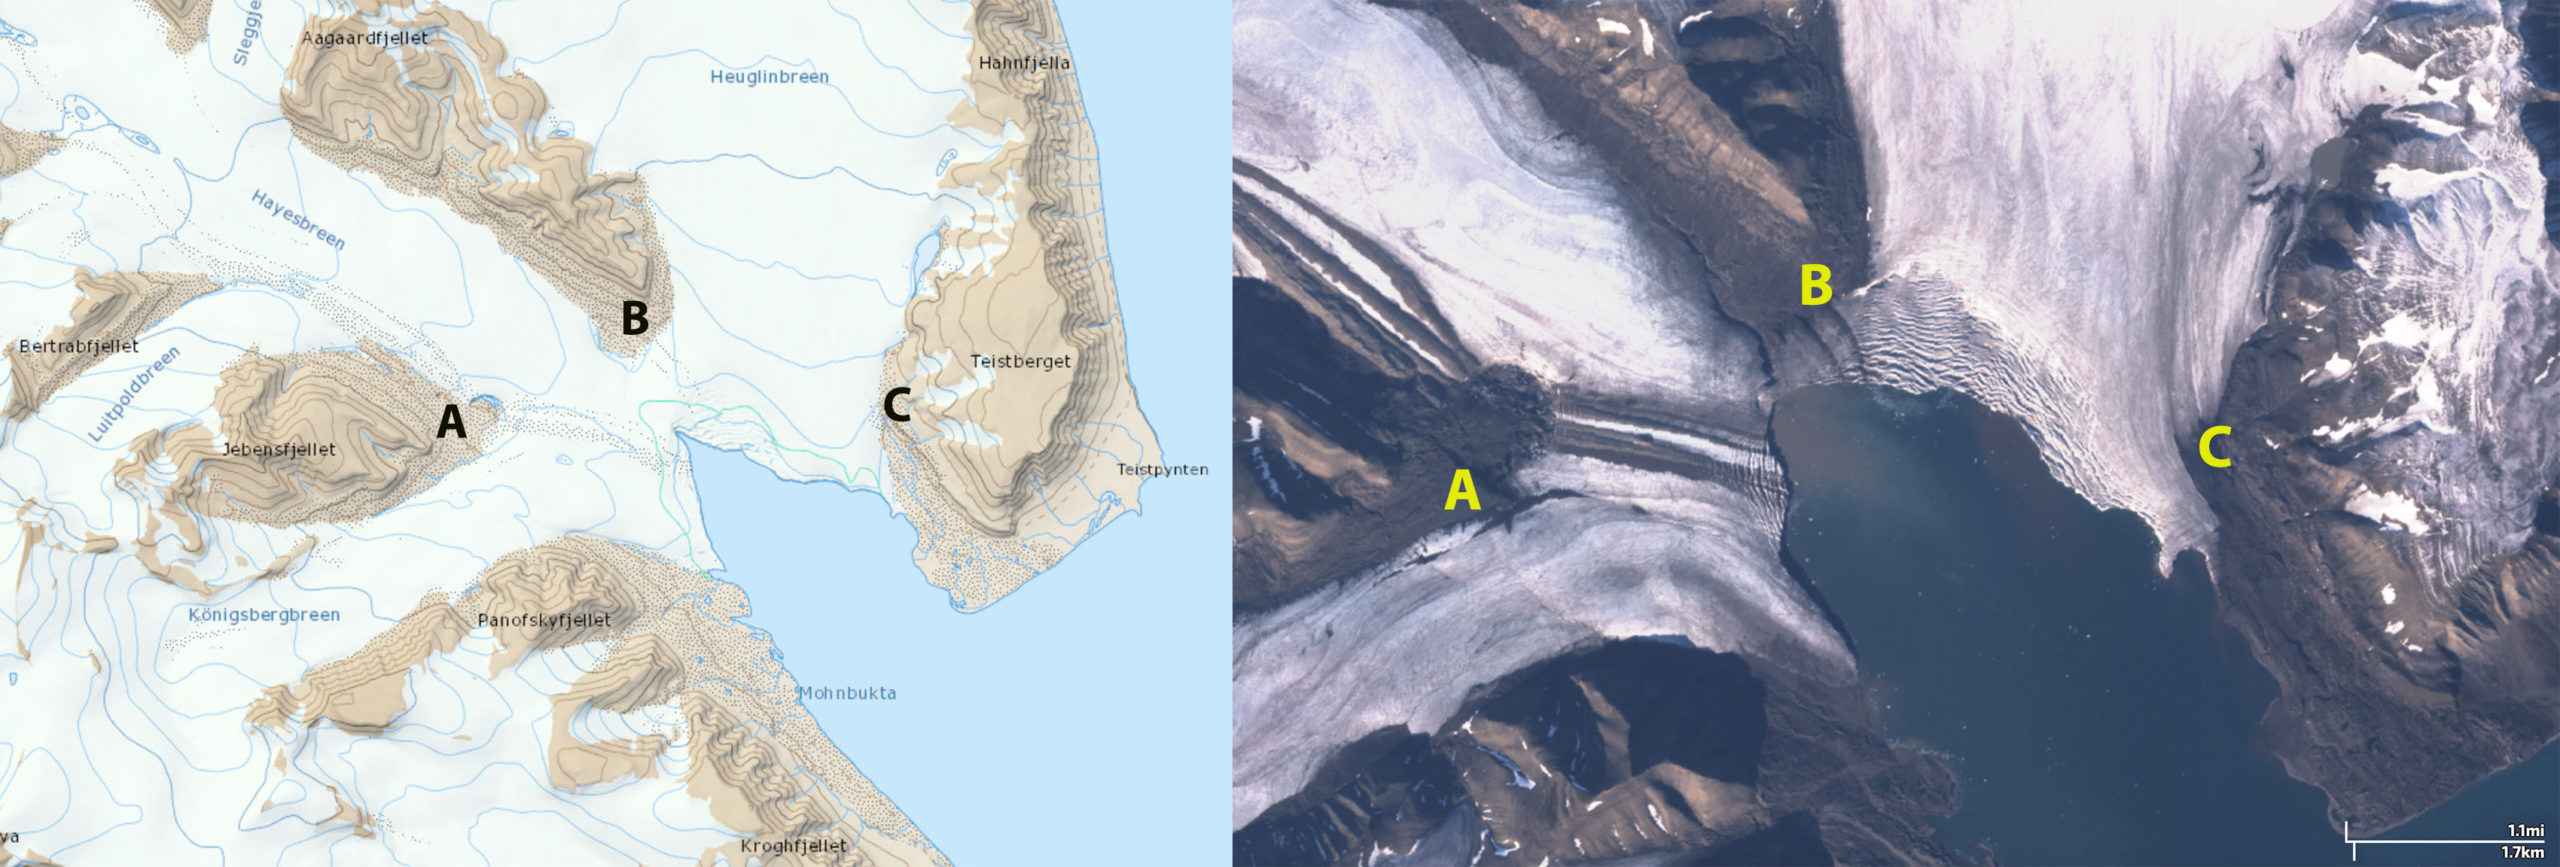
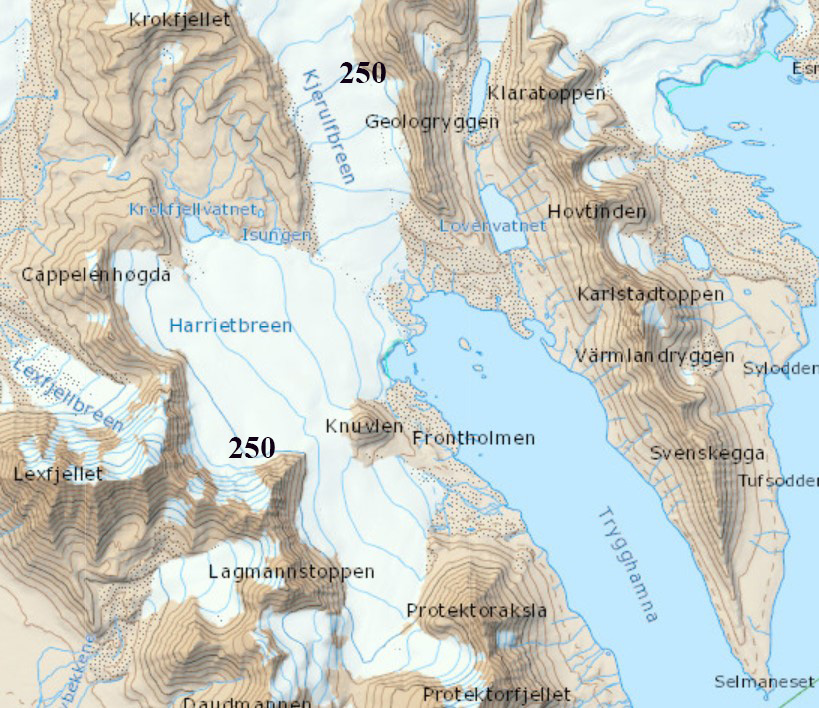
TopoSvalbard map and August 2020 Landsat image of the ice caps. This is after a recent small snow event and some drifted snow is evident, though 95% of the ice caps are snow free. 

Hayesbreen, Svalbard Retreat Generating Separation

Hayesbreen (HB), Heuglinbreen (HE) and Konigsbergbreen (KB) terminating in Mohnbutka (M) in 2002 and 2021 Landsat imagery. Retreat to Point E, and reduction in connection at Point B is evident and distance from Point A to the terminus. 

Hayesbreen, Heuglinbreen and Konigsbergbreen merge forming a single tidewater front in Mohnbutka on the east coast of Svalbard. Here we examine the retreat of this glacier system and ongoing separation of Hayesbreen and Heuglinbreen with Landsat imagery from 2002-2021. Blaszczyk et al’s (2009) identified 163 Svalbard tidewater glaciers with the total length calving ice−cliffs at 860 km for the 2001-2006 period. They observed that 14 glaciers had retreated from the ocean to the land over the last 30–40 year period. They noted that Hayesbreen was retreating 20-40 m per year in 2003-2005 and had a 4 km long ice cliff terminating in Mohnbutka. They noted the glacier last surged i 1901. Sevestre et al (2018) documented two mechanisms that help generate terminus initiated surges, tidewater retreat from a pinning point and/or crevasses allowing meltwater rainwater to access the bed.  the terminus zone near Point 1.

In 2002 the prominent lateral moraines of Hayesbreen extended 5 km from Point A to the terminus. The glacier margin adjacent to Point B was 2.75 km to the terminus junction of Hayesbreen and Heuglingbreeen. By 2015 there was only 1.2 km of ice between Point B and the terminus, while from Point A to the margin was 3 km. The snowline in 2020 reached between 400-450 m near the ice divide on Heuglinbreen and close to the top of Konigsbergbreen. Hayesbreen extends above 800 m and still had an extensive accumulation area. By August 2021 the now disconnected lateral moraines from the upper glacier extend 2 km from Point A to the terminus, and there is just 0.6 km of ice connecting Heuglinbreen to Hayesbreen. The center of the glacier front has retreated 2.25 km since 2002. Mohnbutka has expanded as the glaciers have retreated. The ice connection between Heuglinbreen and Hayesbreen has narrowed from 3 km to 0.6 km during the period. This is similar to the separation at Strongbreen.

Sevestre et al (2018) noted a distinctive crevasse development pattern of terminus initiated surge progression, “Upward migration of the surge coincided with stepwise expansion of the crevasse field”, for specific observed recent surges in Svalbard. There is no evidence of this process at Hayesbreen during the last 20 years as it retreats and separates.

.

Map of the region fro TopoSvalbard, and August 8, 2021 Sentinel image illustrating the limited connection between Hayesbreen and Heuglinbreen.

Hayesbreen (HB), Heuglinbreen (HE) and Konigsbergbreen (KB) terminating in Mohnbutka in 2015 and 2020 Landsat imagery. The narrowing ice connection at Point B and reduction in glacier extending beyond Point A is evident. The high snowline in 2020 exposes considerable ablation area

Mendeleevbreen/Øydebreen, Svalbard Terminus Retreat and Snowline Rise

Øydebreen (O) and Mendeleevbreen (M) in 2002 and 2020 Landsat images.  Red arrow is the 1990/2002 terminus, yellow arrow the 2020 terminus and purple dots the snowline.

Øydebreen and Mendeleevbreen are a pair of glaciers in Sørkapp Land, Svalbard that a share a divide. Mendeleevbreen flows north to Hornsund and Øydebreen south to Isbutka, meeting at the ice divide at 300 m.  The Institute of Geophysics Polish Academy have maintained a Polish Research Station in Hornsund since 1957. The 1984 map, from the University of Silesia, of the glaciers and geomorphology document the extent of the glaciers in 1983 in the region indicating Mendeleevbreen being connected beyond the northern end of its fjord to its neighbor to the east Svalisbreen.  A detailed examination by Blaszczyk, Jania and Kolondra (2013) reported the total area of the glacier cover lost in Hornsund Fjord area from 1899–2010 was approximately 172 km2. The average glacier area retreat increased from a mean of 1.6 km2/year to 3 km2/year since 2000.  Pelto (2017) reported significant retreat of all 10 major tidewater glaciers of Hornsund Fjord. In the August 4, 2020 image it is apparent that one could walk from the terminus of the Mendeleevbreen over the divide to the terminus of the Øydebreen without encountering snow.

In 1990 the distance from the front of Mendeleevbreen to Øydebreen was ~17.5 km. Øydebreen terminated just east of Fallknatten, a rib of rock separating the glacier from Vasilievbreen. Mendeleevbreen terminates adjacent to a tributary from the east Signybreen. The snowline in the 1990 August Landsat image is at 200 m.  By 2002 Øydebreen has retreated substantially across its entire front.  Jania et al (2006) noted a 400 m advance of  the center of Mendeleevbreen from 1990 to 2004.  The east margin retreated and the west margin was stable during this period, with the overall front position advancing ~100 m. The glacier is known to have surged in the past, and this could have been a small surge event.  The snowline in the August 2002 Landsat image is at 225 m.  By 2014 the distance from the front of Mendeleevbreen to Øydebreen was 13.5 km.  The Mendeleevbreen terminus had retreated to the eastern tributary of Grobreen. The snowline in August 2014 is at ~225 m.  The snowline in August 2015 is at ~200 m.

By August 2020 the distance from the front of Mendeleevbreen to Øydebreen was 12.5 km, a combined retreat of 5 km since 1990.  Øydebreen is now poised to retreat into its own fjord. The snowline at the start of August 2020 is above the 300-m ice divide, leaving the possibility that no snow at all will remain by the end of the melt season on either glacier.  It was noted in early July how high the snowline was on Svalbard glaciers.  The retreat of these two glaciers fits the pattern of Svalisbreen, Samrarinbreen and Vasilievbreen.  Unfortunately the high snowlines of 2020 indicate large mass losses will occur that will only accentuate ice loss.

Øydebreen (O) and Mendeleevbreen (M) in 1990 and 2020 Landsat images.  Red arrow is the 1990/2002 terminus, yellow arrow the 2020 terminus and purple dots the snowline.

Øydebreen (O) and Mendeleevbreen (M) in 2014 and 2015 Landsat images.  Red arrow is the 1990/2002 terminus, yellow arrow the 2020 terminus and purple dots the snowline.

TopoSvalbard map of the region with ice flow indicated by blue arrows. 

Harrietbreen, Svalbard Retreats From Coast Loses Accumulation Zone

Harrietbreen (H) and Kjerulfbreen (K) in 1990 and 2020 Landsat images.  Red arrow 1990 terminus, yellow arrow 2020 terminus and purple dots the snowline.  No snow on Harrietbreen in early July 2020. Point 1 and 2 are divides between glaciers.

Harrietbreen is small glacier that feeds into Trygghamna a small fjord the is part of the large Isfjorden on the east coast of Svalbard, mergin with Kjerulfbreen near the terminus.  The glacier extends from 400 m to tidewater in 1990. Here we examine the changes in both terminus position and accumulation zone in Landsat images from 1990-2020. Nuth et al (2013) determined that the glacier area over the entire archipelago has decreased by an average of 80 km2 per year over the past 30 years, a 7% reduction, this loss is ongoing (NASA, 2018).

In 1990 Harrietbreen (H) and Kjerulfbreen (K) merge 1.5 km above the terminus at Point 1 and both reach tidewater.  The snowline is at 200 m and the divide at Point 2 with Protektorbreen to the south is wide and partly snowcovered.  In 1993 the snowline in mid-July is at 150 m.  Kjerulfbreen has retreated from tidewater. In 2018 and 2019 by the end of August Harrietbreen has lost all of its snowcover nd Kjerulfbreen is now 700 m from the coastline.

On July 8, 2020 the warm early summer temperatures have already melted all the winter snowcover from Harrietbreen.  With two months left in the melt season this will result in substantial mass loss. Harrietbreen has retreated 500 m  during the 1990-2020 period and is no longer a tidewater glacier. The connection with Kjerulfbreen at Point 1 has been reduced to 0.6 km.  The connection with Protektorbreen at Point 2 has thinned substantially too.  The persistent lack of retained snowcover indicates a glacier without a consistent accumulation zone which means Harrietbreen cannot survive (Pelto, 2010).

The retreat here is less significant than at nearby Austre Torelbreenor at Orsabreen, but the prognosis for survival much worse.

Harrietbreen (H) and Kjerulfbreen (K) in 1993 and 2019 Landsat images.  Red arrow 1990 terminus, yellow arrow 2020 terminus and purple dots the snowline.  No snow retained in 2019. Point 1 and 2 are divides between glaciers.

TopoSvalbard map of the region, the 250 m contour is indicated.

Austre Torellbreen, Svalbard Retreat and Nunatak Expansion

Austre Torellbreen in 2000 and 2019 Landsat images.  Red arrow is the 2000 terminus location, yellow arrow the 2019 terminus location. Point 1,2 and 3 are nunatak areas that are expanding.

Austre Torellbreen is an outlet glacier on the southwest coast of Svalbard.  It is just west of calving glacier that are retreating such as Paierbreen and Samarinbreen and adjacent to the land terminating Nannbreen. Blaszczyk et al (2008) report the velocity of Austre Torellbreen near the calving front of 220-265 m/year. Nuth et al (2013) determined that the glacier area over the entire archipelago has decreased by an average of 80 km per year over the past 30 years, a 7% reduction.

In 2000 the calving front is 4.7 km wide and has a low slope at the terminus with the surface reaching 150 m 2.5 km from the calving front.  The calving front is at a point where the embayment widens upglacier and has outwash plains on either side of the margin. The snowline is at 300 m in 2000.  At Point 1 is an isolated nunatak and at Point 2 and 3 are limited ridges extending from nunataks. By 2014 the glaciers western margin has retreated into the widening embayment, with more limited retreat in the center and eastern margin of the glacier.  By 2019 the Austre Torellbreen western margin has retreated 2400 m, while the eastern margin has retreated 800 m. The terminus has narrowed to 4.2 km and is retreated from an area of low slope margins to a location between two peak Brattho and Raudfjellet. There is an area of extensive crevassing at the current calving front, suggesting that further calving retreat will occur. At Point 1 the nunatak has expanded in area and vertical relief. At Point 2 the ridge that was separated in two segments has joined into a single ridge.  At Point 3 the ridge has extended by 500 m and has a greater relief in 2019.  The nunataks and mountain ridges that are amidst and adjacent to Austre Torellbreen can be seen to emerge and expand from 2000 to 2019 as the glacier thins.  This thinning leads to the retreat that is enhanced by calving.


Austre Torellbreen in TopoSvalbard map from circa 2000 and in a visual image from 2014.

Austre Torllbreen in 2014 Landsat image. Red dots indicate the snowline at 350 m.

Orsabreen, Svalbard Retreat leads to Lake Tripling in Size

Response of Orasbreen (O), Glopeken (G) and Holmstrombreen (H) to climate change as indicated by 1995 and 2019 Landsat images.  Red arrow is 1995 terminus, yellow arrow 2019 terminus, pink arrows a deepening supraglacial stream channel and purple dots the snowline.

Orsabreen terminates in an expansing prolgacial lake, Trebrevatnet, that is shared with a glacier it has separated from Holmstrombreen. The glacier shares an accumulation zone with Kronebreen, a glacier that is experiencing rapid retreat, and is fast flowing (How et al 2017). The high discharge of Kronebreen indicates a high volume of accumulation above 650 m in the shared accumulation zone, the Holtedahlfonna.   Nuth et al (2010) from 1965-2007 reported the mean mass balance of  Svalbard glaciers, excluding Austfonna and Kvitøya, as  −0.36 m yr−1 . They noted that Orsabreen had less volume loss −0.24 m yr−1 and did have an increase at higher elevation. Ruppel et al (2017) observed annual accumulation of 0.9 m w.e. at 1100 m on Holtedahlfonna from 2005-2015.  Trebrevatnet expands both through glacier retreat and the melt out of ice cored moraine that comprises much of its margin, they observed 0.9 m of annual melt of the dead ice moraine areas (Schomacker and Kjaer, 2007).

In 1995, Trebrevatnet has an area of 4.0 km2 the terminus of Holmstrombreen, Glopeken and Orsabreen merge, separated by medial moraines.  In 2000 Holmstrombreen has retreated allowing Trebrevatnet to expand westward, while the medial moraine between Orsabreen and Glopeken still extends across the valley between Orsabreen and Trebrevatnet.  The snowline in 2000 is at 550 m.  In 2017 the snowline is at 600 m.  Glopeken, Homstrombreen and Orsabreen have retreated into separate valleys.  The medial moraine between Glopeken and Orsabreen has melted away.  In 2019 the snowline is at 500 m, Trebrevatnet has expanded to an area of 13.5 km2, more than tripling in area.  This is due primarily to the 2200 m retreat of Orsabreen.  The moraine melt out has expanded the length of the lake from 2.3 km to 7.5 km.  The thinning of the lower Holmstrombreen is evident by the deepening of the supraglacial stream indicated by the pink arrows in the 2000 and 2019 images.  A closeup view of the terminus from TopoSvalbard from prior to 2010 indicates both a deeply incised supraglacial stream indicating relative stagnation of the terminus (purple arrows), extensive crevasses that have become rifts near the terminus (green arrows) and the ice cored moraine that is now gone, blue arrows. This portion of the glacier has now been lost.  In 2019 the lowest 1 km of the glacier is relatively stagnant and poised to be lost. The tongue of the glacier below 550 m is too large to be supported by the smaller accumulation area above this feeding from the Holtedahlfonna. The retreat here is less than most of the tidewater glaciers in Svalbard such as Hinlopenbreen or Paierbreen, but similar to lake terminating glaciers like Gandbreen.

Response of Orasbreen (O), Glopeken (G) and Holmstrombreen (H) to climate change as indicated by 1995 and 2019 Landsat images.  Red arrow is 2000 terminus, yellow arrow 2017 terminus, pink arrows a deepening supraglacial stream channel and purple dots the snowline.

TopoSvalbard map and image of the Orsabreen terminus area and expansion of Trebrevatnet. Light blue arrows indicate ice cored medial moraine, light green arrows indicate rifts, and purple arrows a deep supraglacial channel.

Arnesenbreen, Svalbard Retreat, Separation and Surge

Arnesenbreen (A) and Bereznikovbreen (B) in 1990 and 2018 Landsat images.  Red arrow is 1990 terminus location, yellow arrow the 2018 terminus location and purple dots the transient snowline.

Arnesenbreen and Bereznikovbreen are glaciers in Svalbard on the east coast of Spitsbergen that in 1990 had a joint calving front near Kapp Murchison. Blaszczyk et al’s (2009) analysis identified 163 Svalbard glaciers that are tidewater with the total length calving ice−cliffs at 860 km for the 2001-2006 period. They observed that 14 glaciers had retreated from the ocean to the land over the last 30–40 year period. Some of these are surging glaciers, which are common in Svalbard.  Arnesenbreen was observed to surge in the 1930’s and in 2018 a surge was observed that was initiated from its terminus, which is a more unusual type of surge (Holmund, 2018).  Sevestre et al (2018) document mechanisms that help generate terminus initiated surges, include tidewater retreat from a pinning point and/or crevasses allowing meltwater rainwater to access the bed. The surge generated considerable crevassing that extended from the tidewater terminus to an elevation of 300 m, 5 km inland of the terminus. Here we examine the behavior of these glaciers using Landsat imagery from 1990-2018.

In 1990 Arnesenbreen-Bereznikovbreen had a shared 5 km long tidewater front. The transient snowline in this July image is at 200 m. The glacier terminus reach is not extensively crevassed.  In 2002 the two glaciers are separating at Point 1 each having retreated ~400-500 m, crevassing remains limited.  The transient snowline in 2002 is at 300 m. By 2014, Arsenenbreen has retreated 1400 m since 1990 and crevassing remains limited.  The transient snowline is at 300 m, though there is a saturated zone of snowpack above this line, that suggests extensive melt up to 500 m.  In 2018 the surge crevassing was most apparent in the April image of Holmund (2018).  On June 30 the extensive crevassing is still evident, particularly in the 200-250 m elevation band near Point 2, but is reduced from April in the terminus zone near Point 1.  By July 21 the image indicates much reduced calving in the terminus zone of the glacier.  Sevestre et al (2018) note a pattern of terminus initiated surge progression, “Upward migration of the surge coincided with stepwise expansion of the crevasse field.” This is exactly what is seen at Arnesenbreen, we are also seeing the surge terminating with calving reduction at the terminus first.  The short lived nature of the surge indicates the limited impact on the longer term retreat. The surge did not lead to a reconnection with Bereznikovbreen. Bereznikovbreen has retreated 700-800 m since 1990 and Arnesenbreen has retreated ~1500 m from 1990-2018.

The ongoing retreat here is like that of Svalbard glaciers in general including surging glaciers (Nuth et al 2013).  Strongbreen Glacier has separated from key tributaries. The ongoing retreat has prompted the question on other surging Svalbard glaciers, can the glaciers continue to surge? On Fridtjovbreen it appears a future significant surge is unlikely.  For Arnesenbreen the terminus reach below 150 m is where the glacier expands laterally and is an area of reduced slope.  This configuration remains and would allow further surges unless further retreat of more than ~1500 m occurs.

Arnesenbreen (A) and Bereznikovbreen (B) in 2002 and 2014 Landsat images.  Red arrow is 1990 terminus location, yellow arrow the 2018 terminus location and purple dots the transient snowline.

Arnesenbreen in Landsat image from6/3/2018 indicating zone of most extensive crevassing.

Arnesenbreen (A) and Bereznikovbreen (B) in Toposvalbard map and recent Landsat imagery from Toposvalbard.