Gandbreen Retreat and Lake Expansion, Svalbard

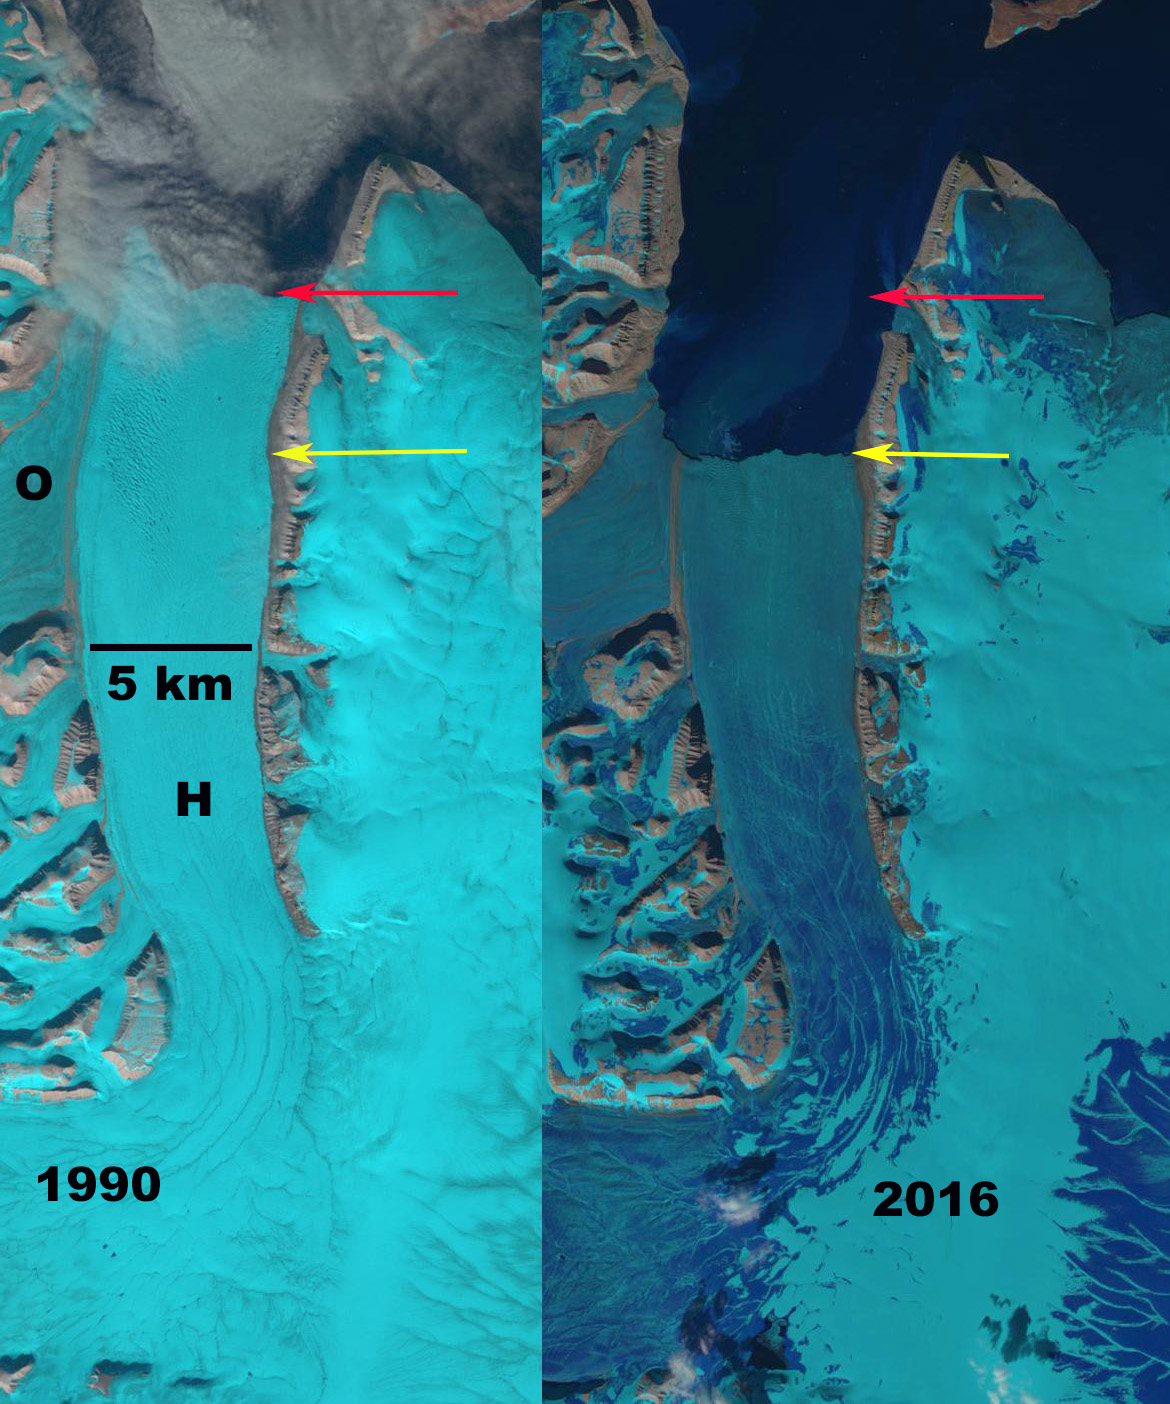
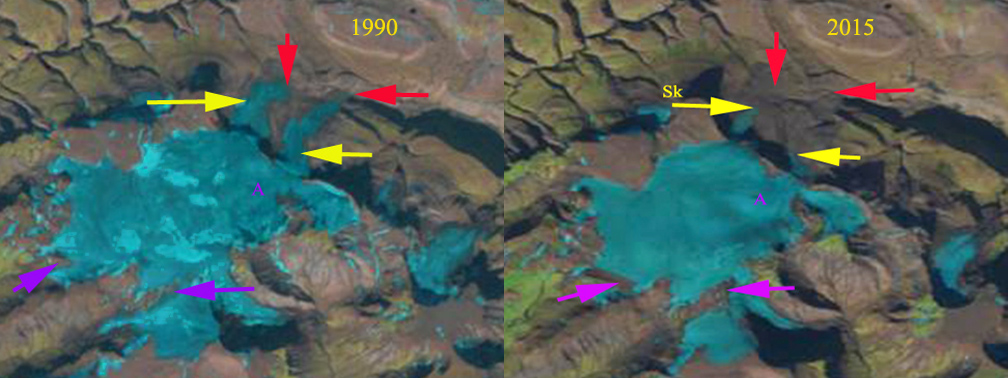
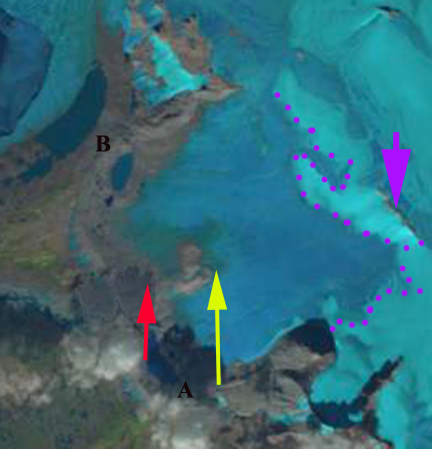
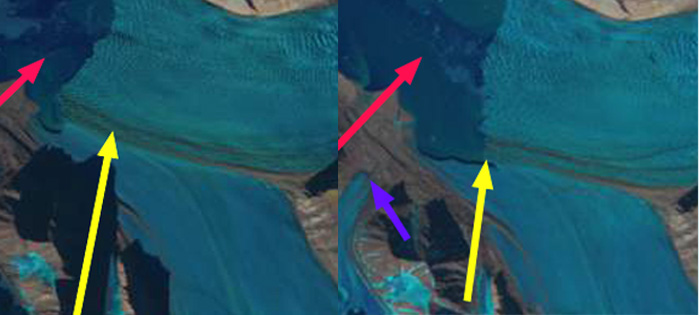
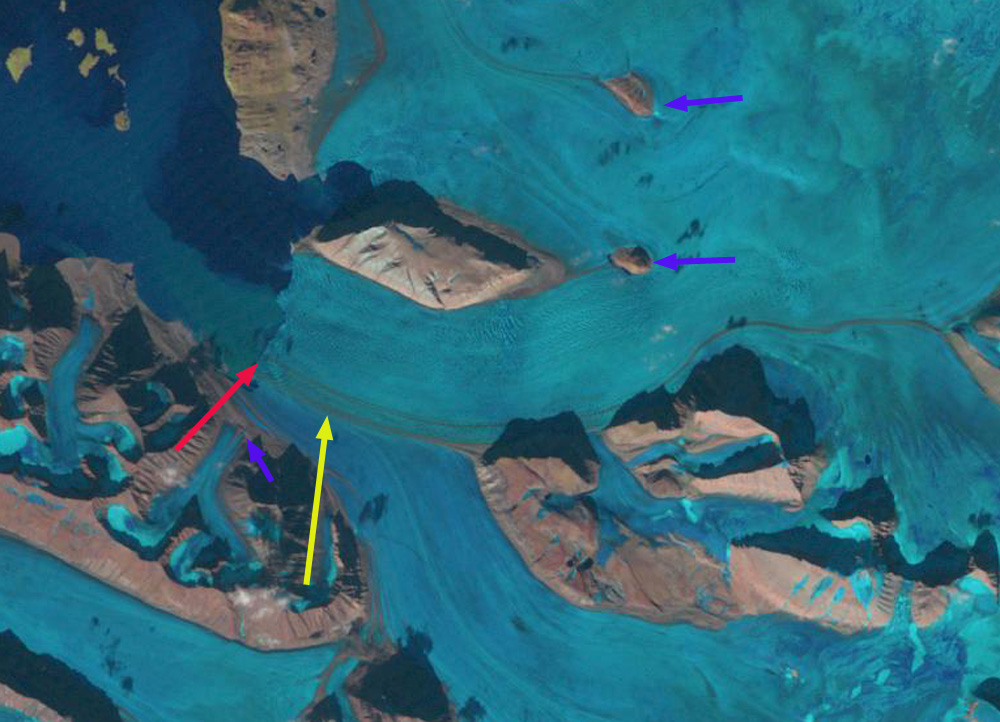
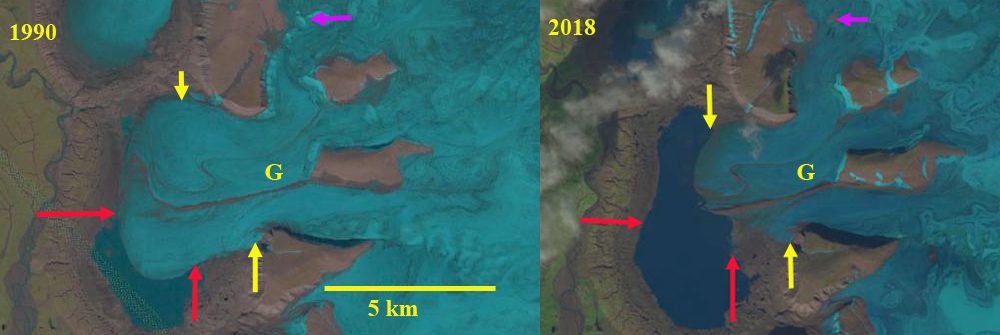
Gandbreen in 1990 and 2018 Landsat images.  The red arrow indicates 1990 terminus location, yellow arrows the 2018 terminus location, and purple arrow a location where bedrock emerges. 

Gandbreen is a western outlet of the Edgeøya Ice Cap, Svalbard.  This is a surging glacier, that has not had an observed surge.  Deltabreen a larger adjacent glacier to the south has no observed either.  Strozzi et al (2017) noted that the western outlet of Edgeøya Ice Cap, Stonebreen had slowly retreating glacier front from 1971 until 2011, followed by a large increase in  velocity since 2012.  This is less of a true surge and potentially a change in frontal dynamics.  Glaciers in Svalbard have experienced significant retreat and volume loss, including surging glaciers. Edgeøya Ice Cap has lost 18% of its area from 1936-2006 (Nuth et al 2013).  ( Möller and Kohler (2018) identified this region as having had an increasing and significant mass loss from 1900-2010 driven largely by ablation increases. Here we examine the glacier changes from 1990-2018 using Landsat images.

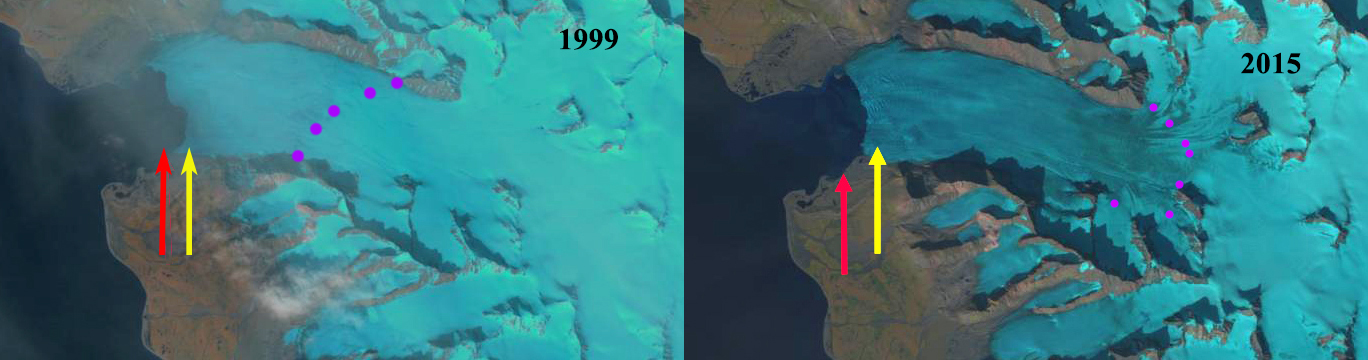
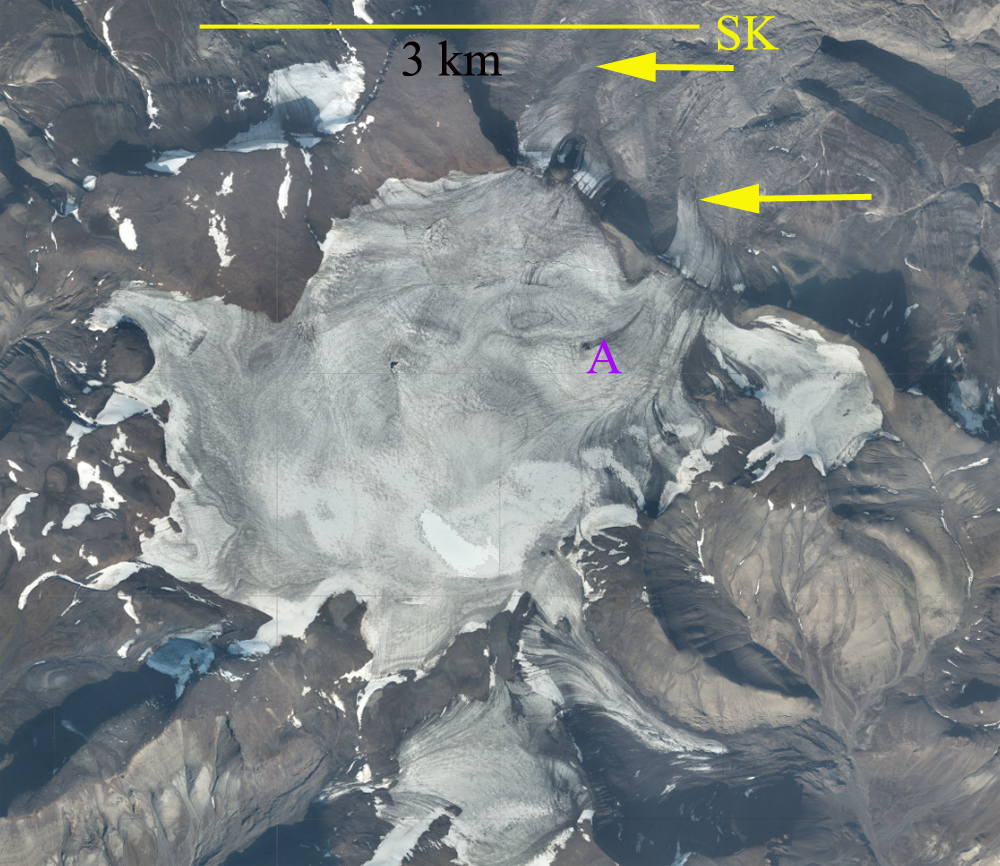
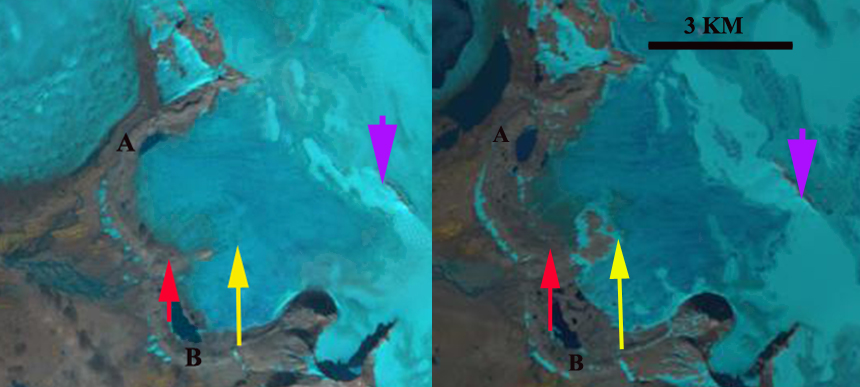
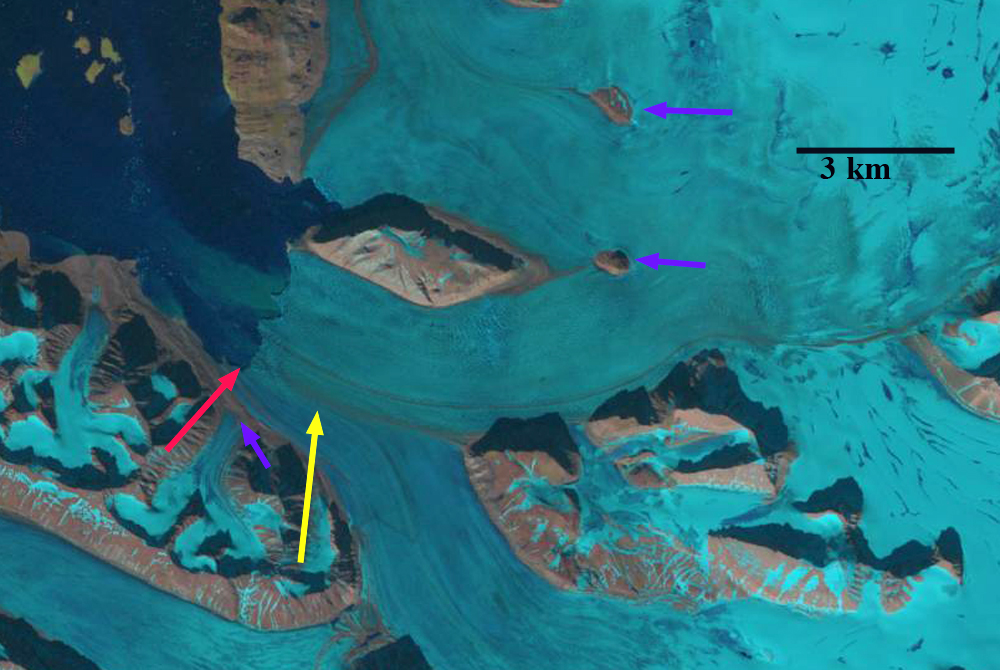
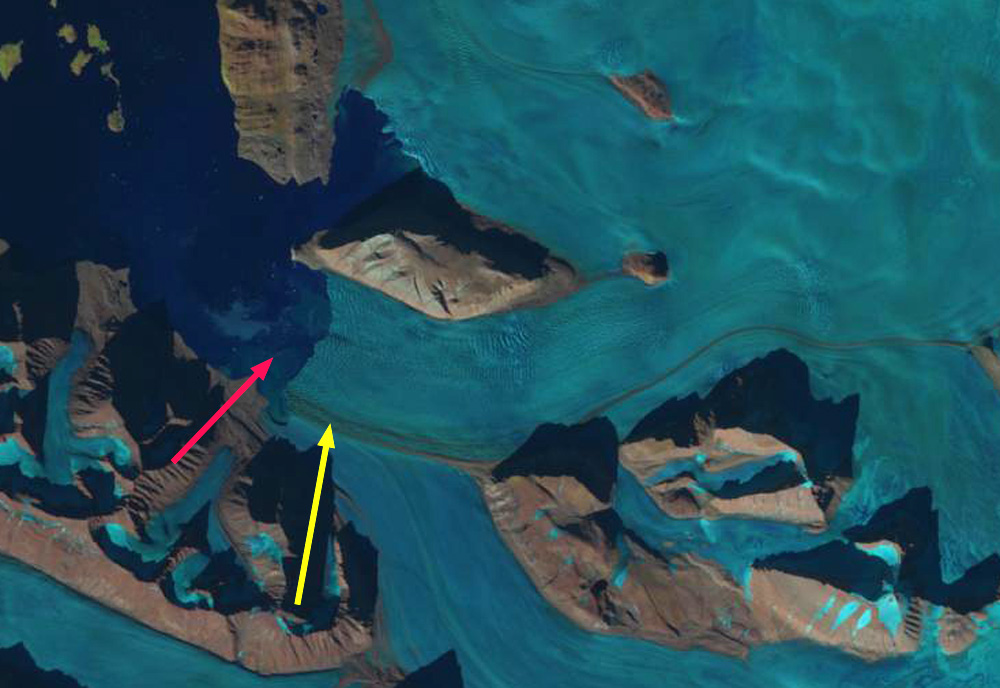
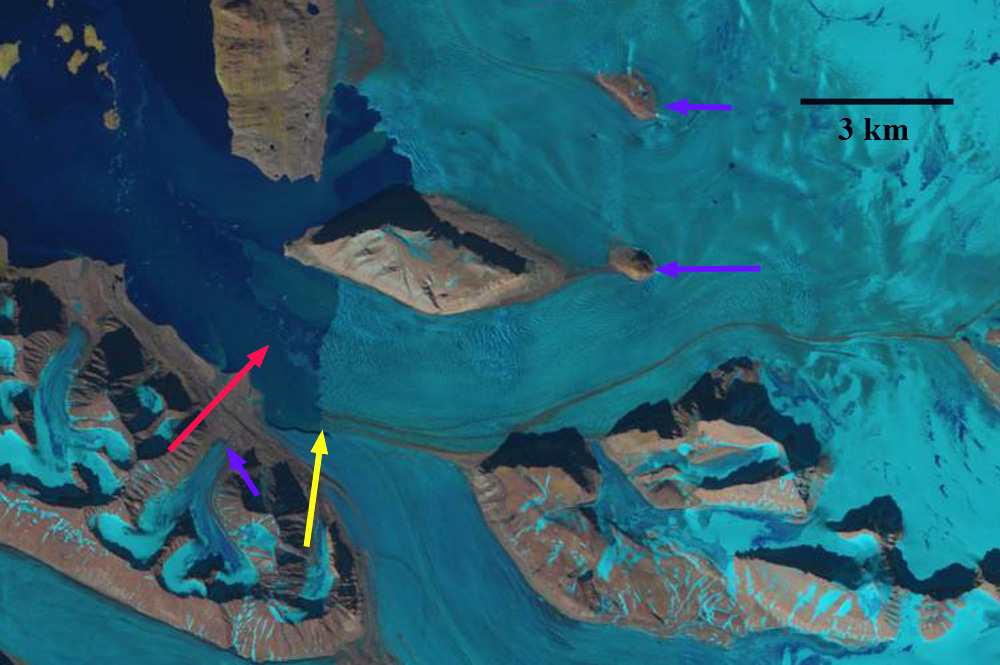
In 1990 Gandbreen’s southern margin terminated in the Gandvatnet proglacial lake, while the northern margin was grounded.  The area of the lake was 3.7 square kilometer and the length of the glacier front in contact with the glacier was 3.4 km. There is not a substantial area of retained snowpack on the ice cap in 1990.  By 2002 the entire margin of the glacier had retreated into the lake and the glacier front in the lake was now 7 km long.  The northern half of the lake was narrow at 100-400 m wide.  By 2016 further retreat and reduced the glacier front in the lake to ~5 km.  A new area of bedrock had appeared, pink arrow, had appeared at an elevation of  300 m, the ice cap divide is at 400-450 m. By 2018 the southern margin of the glacier is grounded on the eastern shore of the lake.  Gandvatnet has expanded to an area of 10.7 square kilometers and the margin of the glacier in the lake is 4.5 km. The terminus has retreated 1800 m on the southern margin, 1250 m in the center, and 2400 m on the north margin.  There is not a substantial area of retained snowpack on the ice cap in 1990, indicating that expanded ablation has driven the retreat.  The retreat of Gandbreen is less significant than at Besselbreen.  Fridtjovbreen has potentially surged for the last time, has Gandbreen?

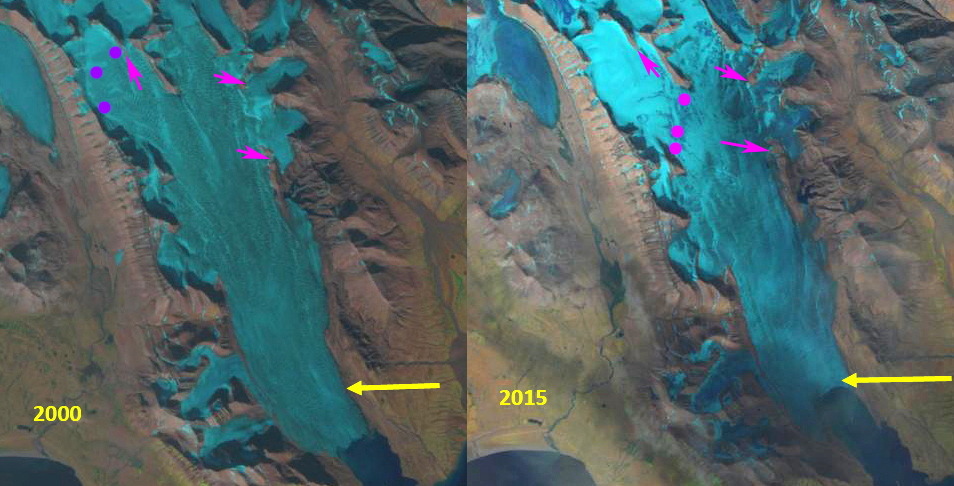
Gandbreen in 2002 Landsat image.  The red arrow indicates 1990 terminus location and yellow arrows the 2018 terminus location. 

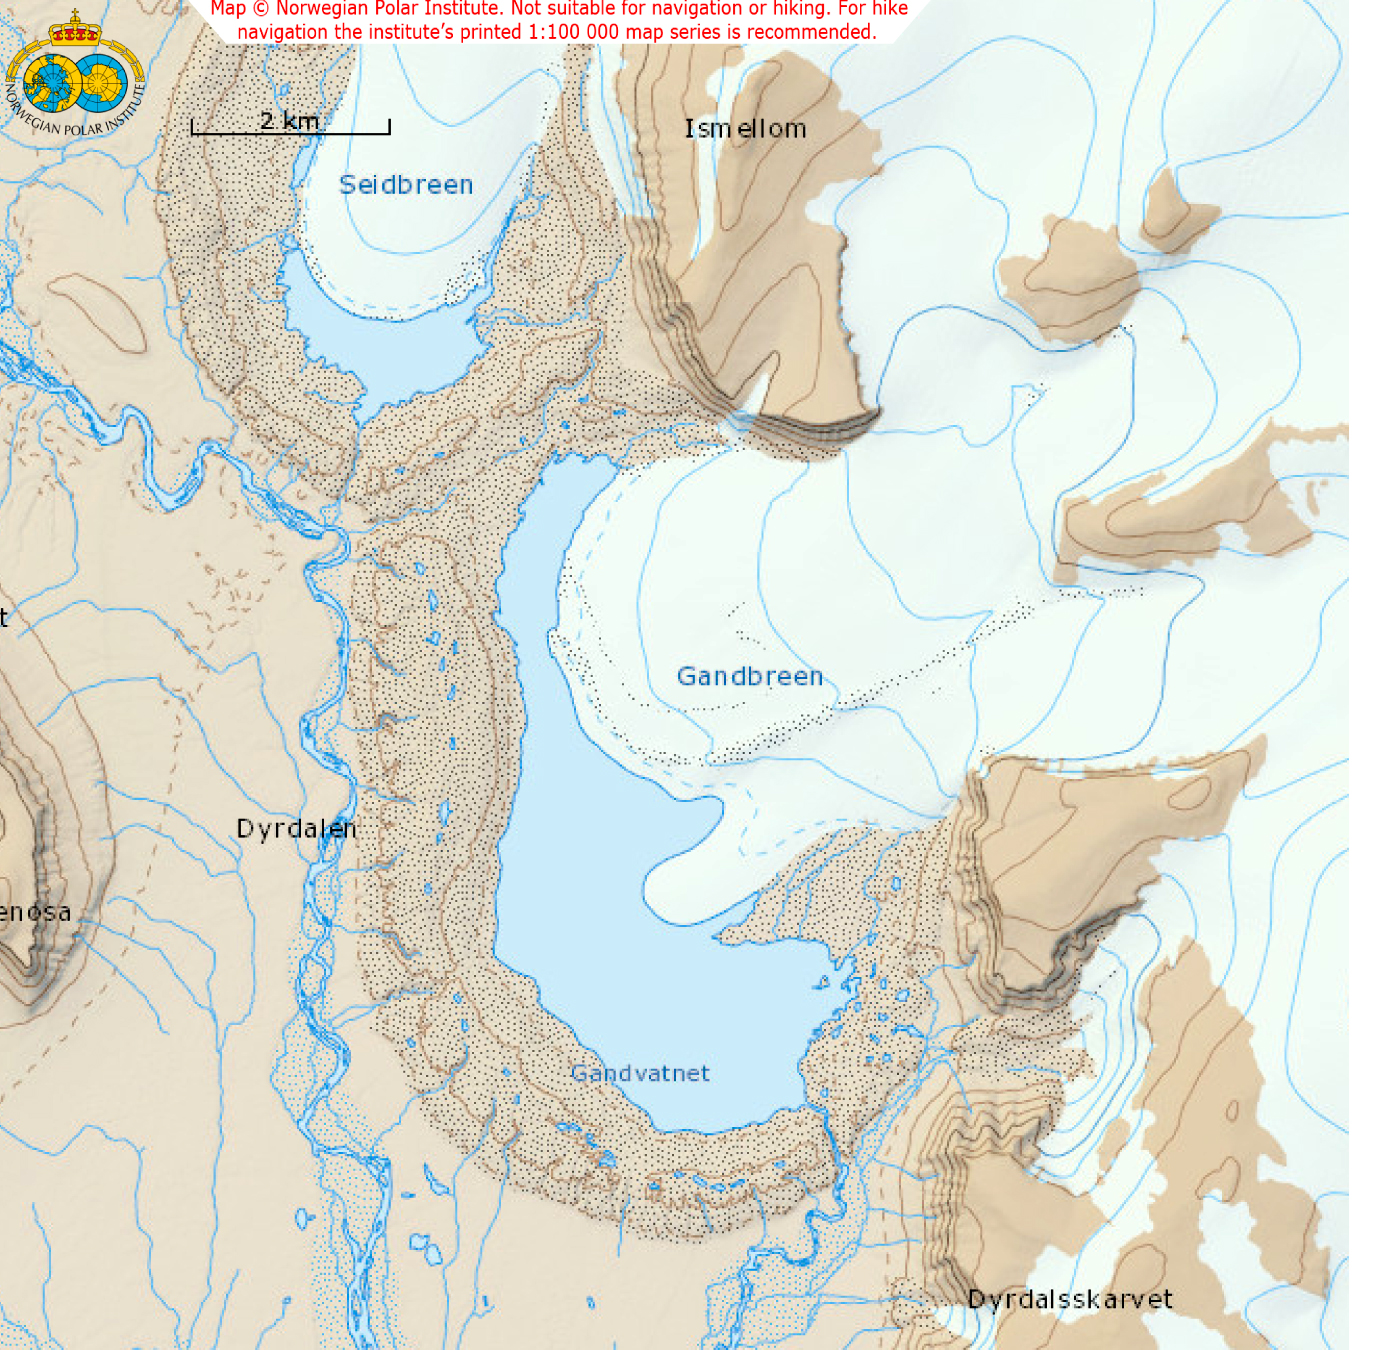
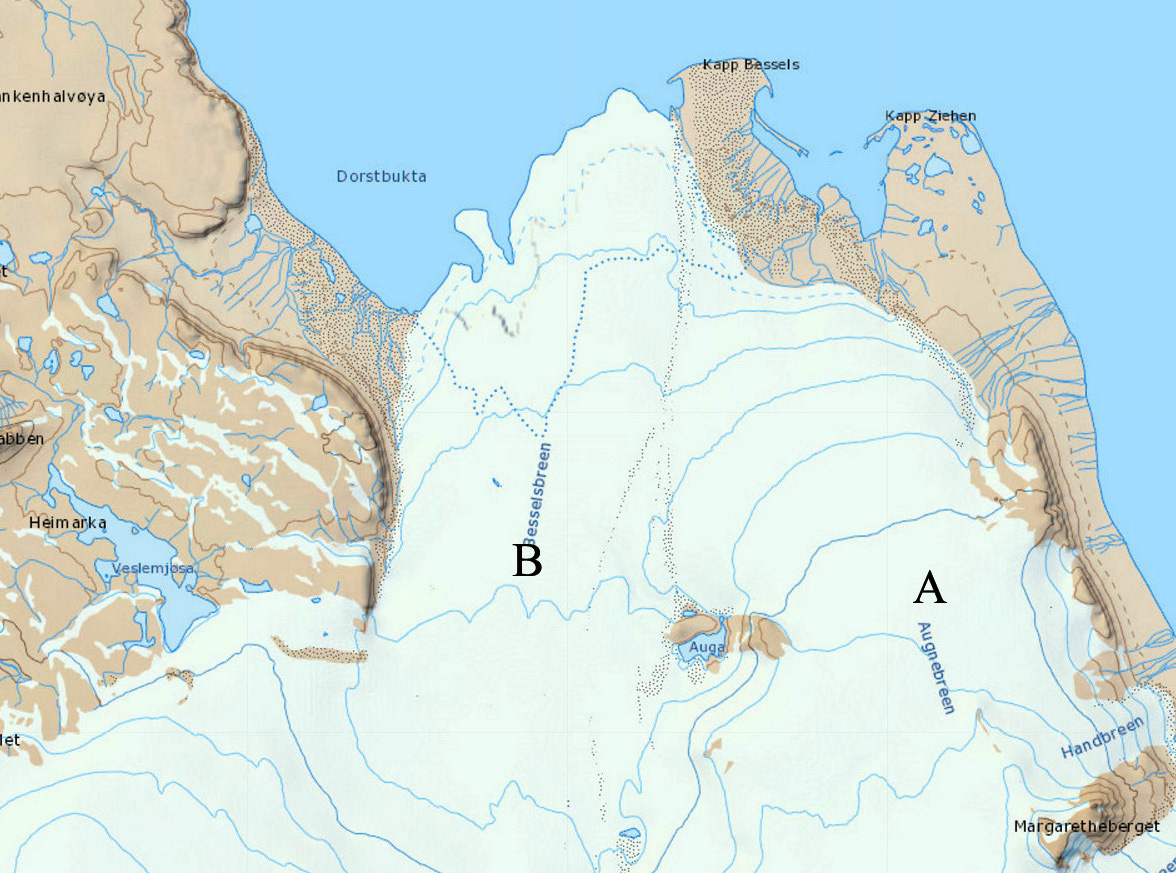
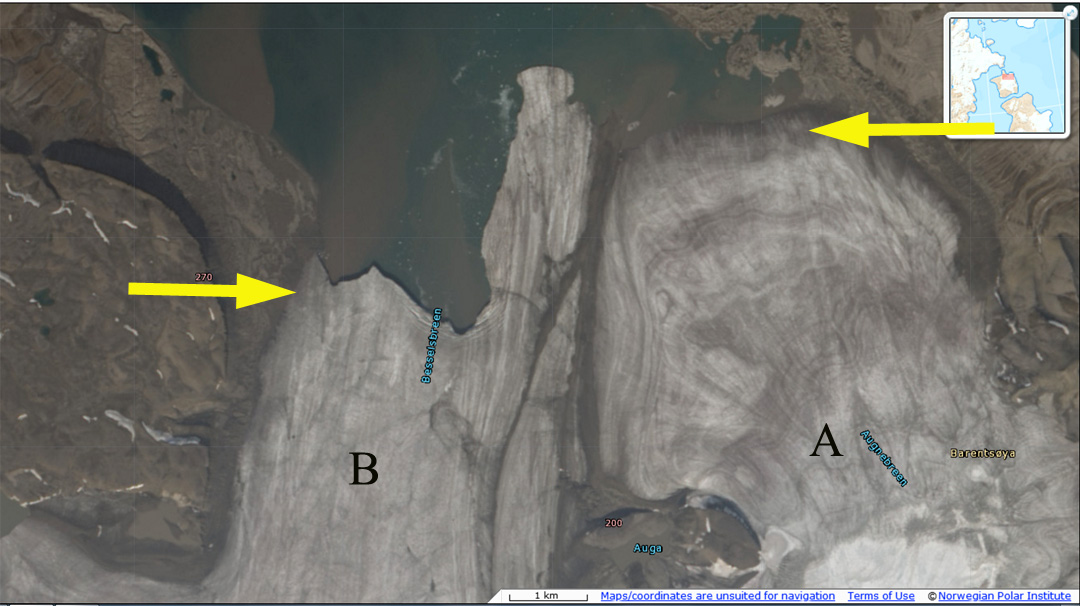
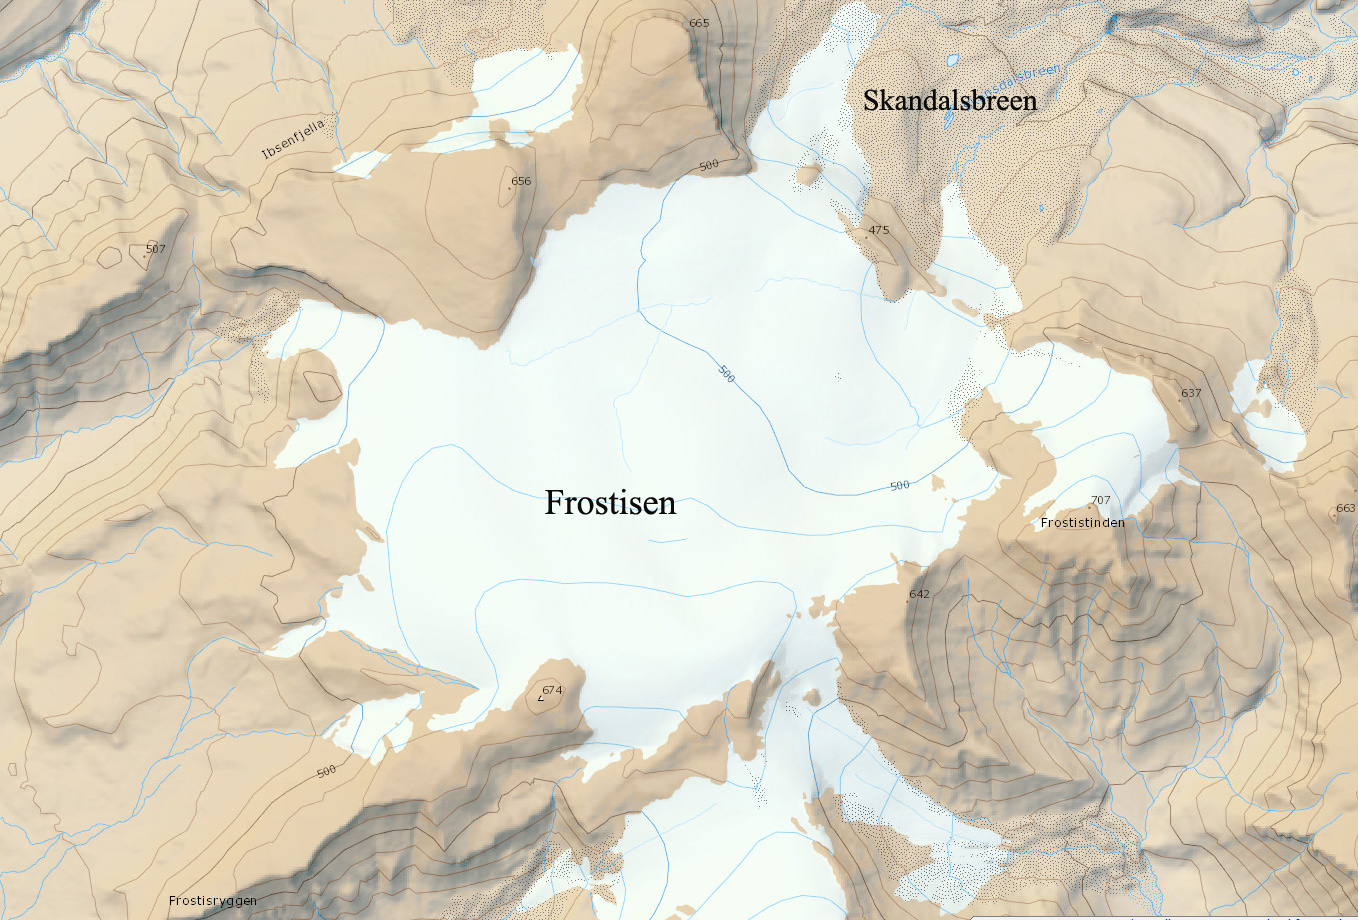
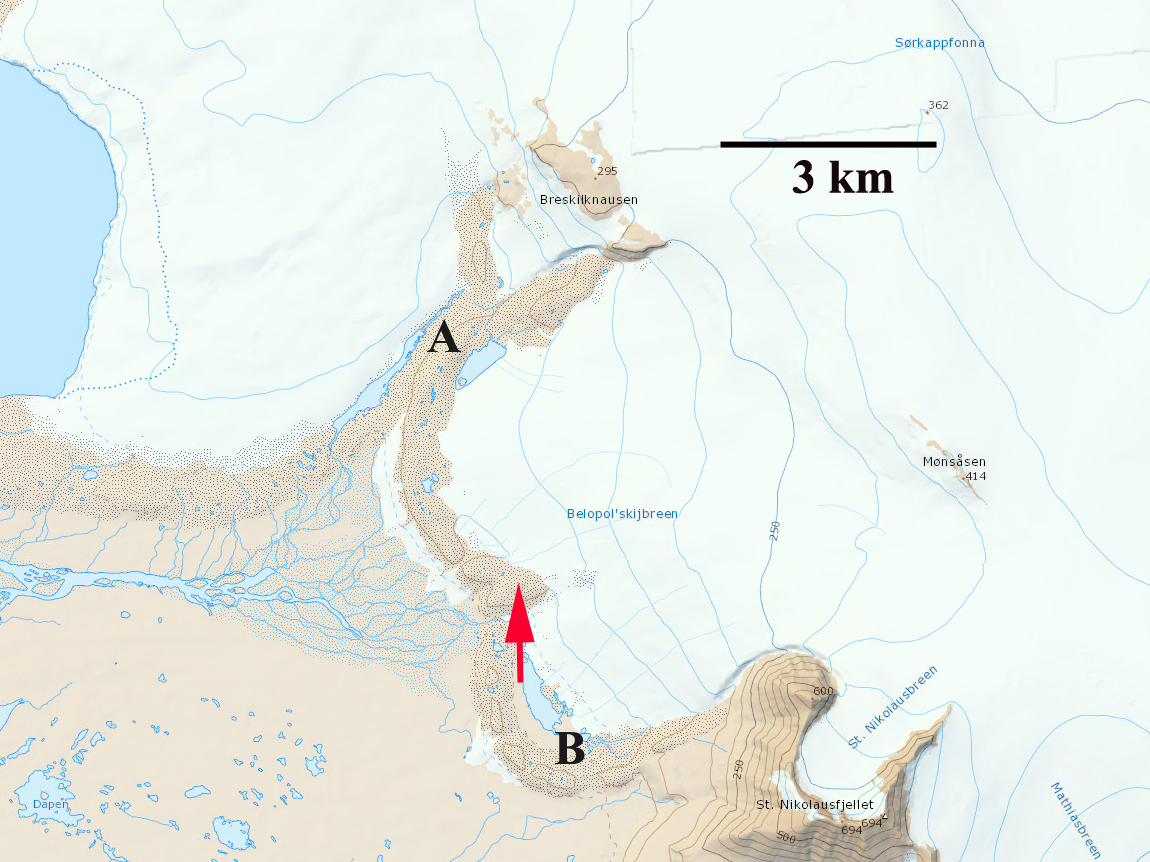
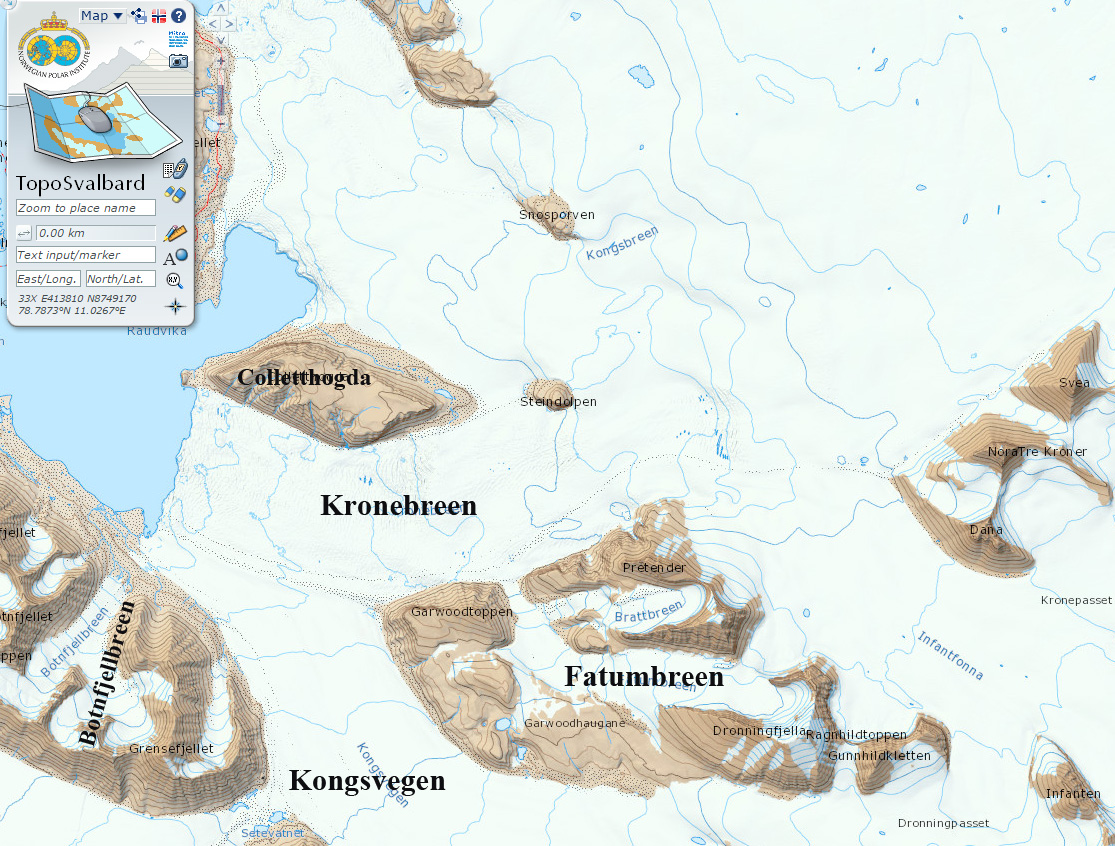
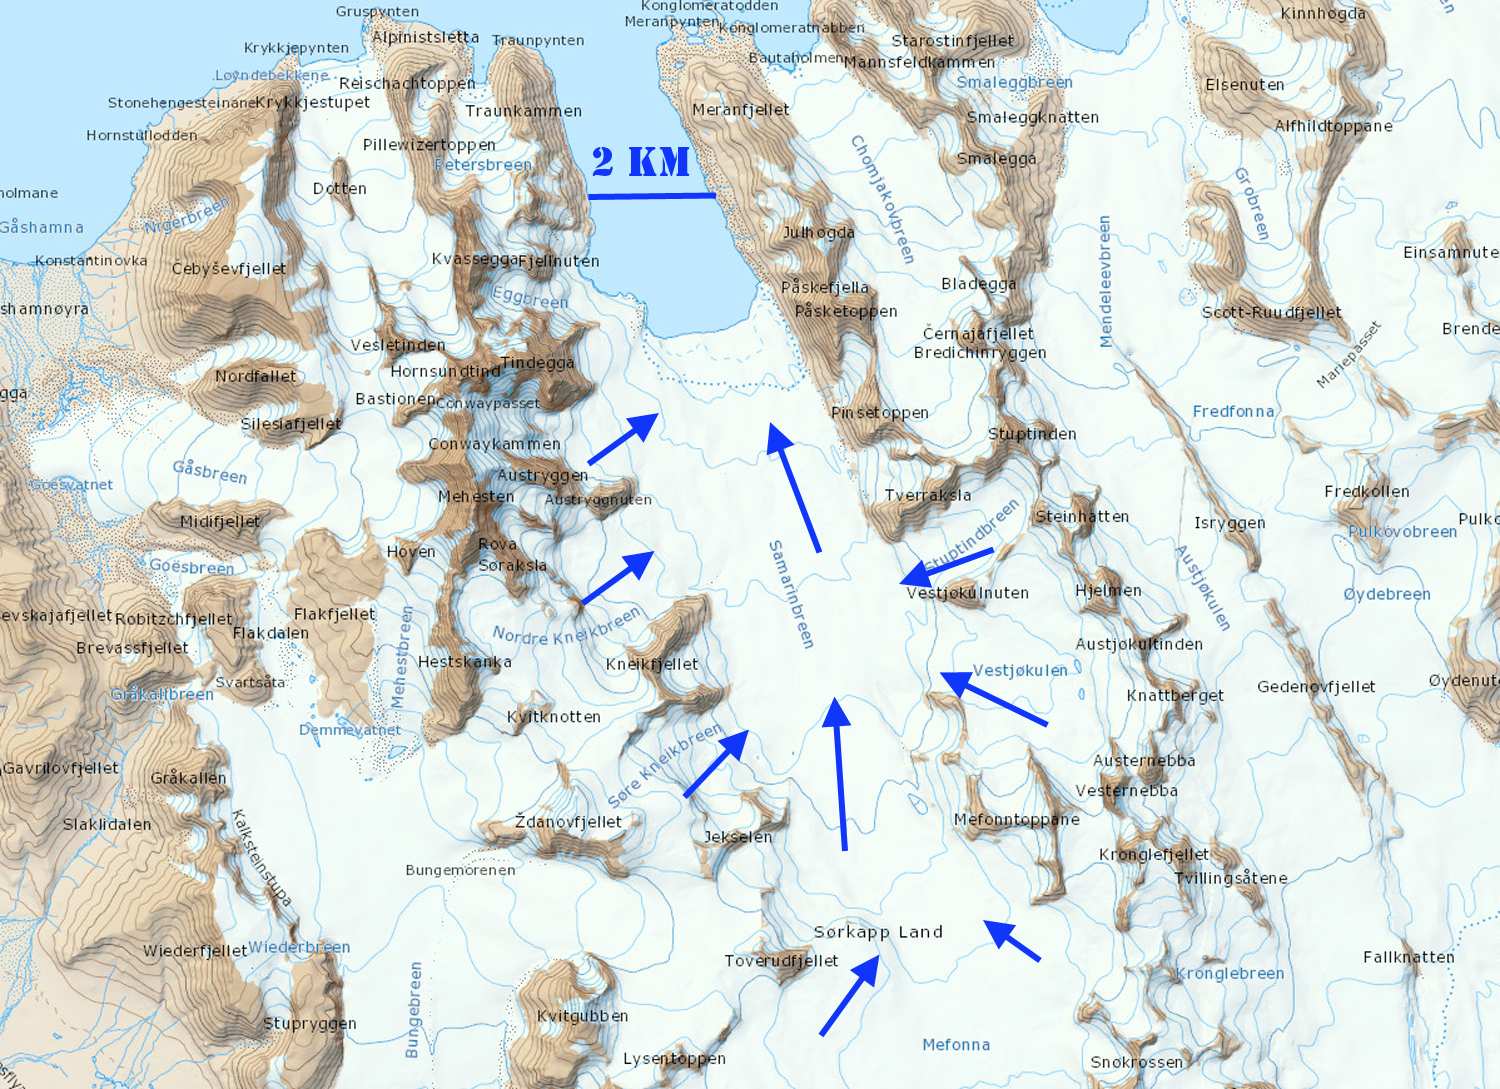
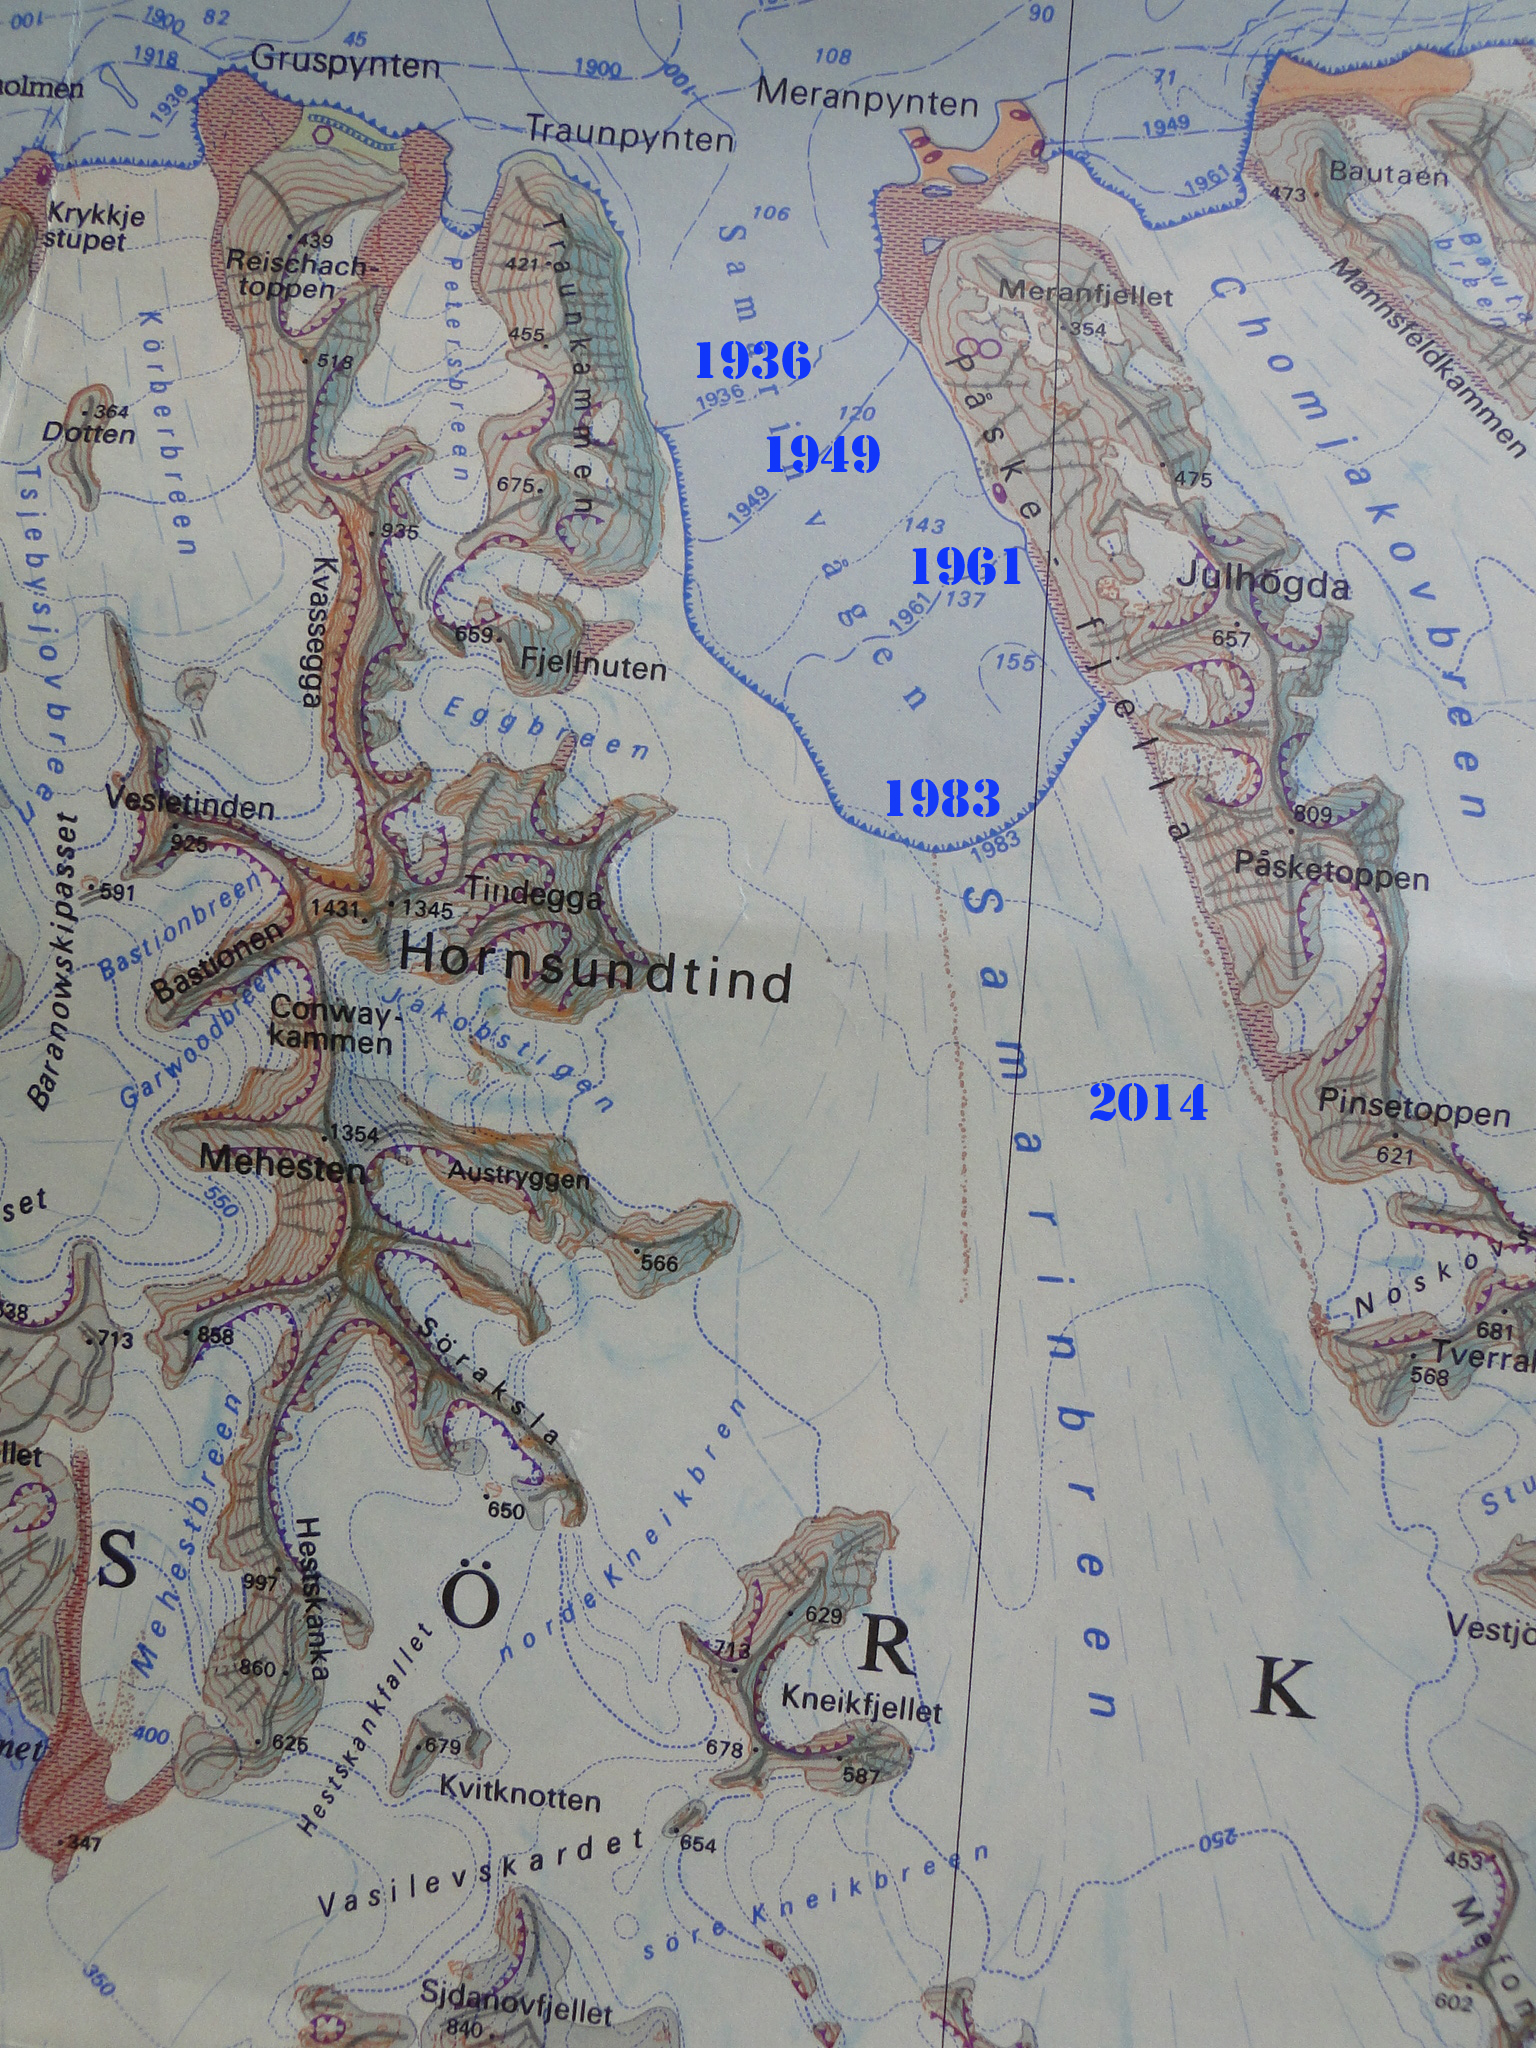
Toposvalbard map of Gandbreen

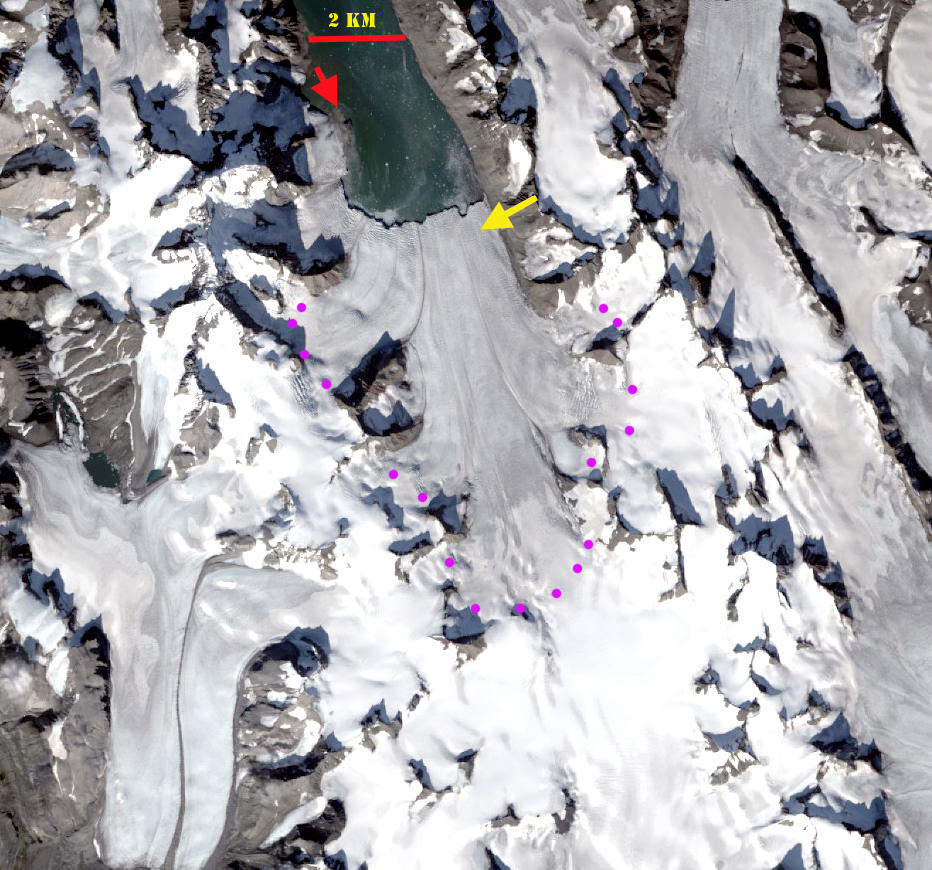
Gandbreen in 2016 Landsat image.  The red arrow indicates 1990 terminus location, yellow arrows the 2018 terminus location, and purple arrow a location where bedrock emerges. 

Aavatsmarkbreen, Svalbard More Calving & Less Accumulation a Deadly Recipe

Aavatsmarkbreen, Svalbard in 1987 and 2017 Landsat images. Red arrow 1987 terminus, yellow arrow 2017 terminus  and purple dots the snowline. 

Aavatsmarkbreen is a tidewater glacier on the west side of Svalbard.  The glacier is the fjord just south of Kongsfjord and Kronebreen Glacier.   Nuth et al (2013) determined that the glacier area over the entire archipelago has decreased by an average of 80 kmper year over the past 30 years, a 7% reduction.  Here we examine Landsat imagery from 1987 to 2017.

In 1987 the glacier terminated at the red arrow and had a 4 km wide front. By 1999 the glacier had retreated 400 m with the retreat being largest in the center of the glacier. In 2015 the calving front was 3.5 km long and nearly straight from north to south.  The snowline in 2015 was at 500 m.  By 2017 the glacier front had developed a significantly concave front with retreat of 1400 m since 1987 in the glacier center and 700 m on the southern and northern margin.  The snowline in 2017 again at 500 m.  The head of the glacier is at 600 m, and a snowline at 500 m leaves much too limited an accumulation zone to sustain the glacier.  A view of the terminus from Toposvalbard indicates the substantial crevassing that indicates greater ice velocity and calving the glacier center.  The combination of reduced accumulation on the glacier and enhanced calving is dangerous recipe for a glacier, one that will drive further significant retreat. The retreat is less than Hinlopenbreen to the northwest and the neighboring Kronebreen Glacier

Aavatsmarkbreen, Svalbard in 1987 and 2017 Landsat images. Red arrow 1987 terminus, yellow arrow 2017 terminus  and purple dots the snowline.

Calving front of Aavatsbreen in 2017, red arrows indicating crevassing indicating acceleration. Black line center retreat. 

Storbreen, Svalbard Major Retreat Opens New Fjord

Storbreen, Svalbard in 1990 and 2017 Landsat images.  The red arrows indicate 1990 terminus , yellow arrow the 2017 terminus and purple dots the snowline in 1990.  A recent snow storm has obscured the actual snowline in Aug 2017. 

Storbreen Glacier (ST) terminates on the north side of Hornsund in southern Svalbard.  From 1990 to 2017 Storbreen has experienced a substantial retreat opening a new fjord and separating from Hornbreen (H).  Svalbard is host to 163 tidewater glaciers with a collective calving front of 860 km Błaszczyk et al, (2009). Nuth et al (2013) determined that the glacier area over the entire archipelago has decreased by an average of 80 km per year over the past 30 years, a 7% reduction. In the most recent period 1990-2007, terminus retreat was larger than in an earlier period from 1930-1990, while area shrinkage was smaller. Hornsund is a fjord that in 2014 almost cuts through the southern Island of Svalbard, and eventually will. The Institute of Geophysics Polish Academy has maintained a Polish Research Station in Hornsund since 1957.  The 1984 map, from the University of Silesia, of the glaciers and geomorphology document the extent of the glaciers in 1983. A more detailed examination by the same researchers, Blaszczyk et al. (2013) reported the total area of the glacier cover lost in Hornsund Fjord area from 1899–2010 was approximately 172 square kilometers. Pelto (2017) reported significant retreat of all 10 major tidewater glaciers of Hornsund Fjord.

In 1990 the terminus of Storbreen on the east side is shared with Hornbreen Glacier (H), joining near the tip of a peninsula that will emerge between the glaciers with retreat.  On the west side the glacier terminates at the southern end of a peninsula.  The snowline is at 400 m in 1990.  In 2002 the glacier has separated from Hornbreen and terminates in a newly opening fjord, with the snowline at 350 m.  In 2013 and 2015 the glacier has retreated substantially up the new fjord with the snowline at 450 m in 2013 and 500 m in 2015.  By 2017 the glacier has retreated 8.7 km in the glacier center from the west margin in 1990, 6.0 km on the centerline and 4.8 km from the east margin of 1990.  The glacier terminus is still tidewater and is 4.7 km wide.  The extensive crevassing at the glacier front in Google Earth imagery, below, indicates continued rapid flow at the terminus.  The retreat continues with significant cahnge after 2013.  The crevassing may indicate a steeper surface slope too.  The topography at TopoSvalbard suggests limited change in surface slope based on older mapping.  The head of the fjord is not likely to occur until at least the junction point of several tributaries. The retreat here is similar to that of adjacent Hornbreen and Paierbreen.

Storbreen, Svalbard in 2013 and 2015 Landsat images.  The red arrows indicate 1990 terminus , yellow arrow the 2017 terminus and purple dots the snowline.   

The crevassed front of Storbreen in 2014 on left.  Indicating active calving but also suggestive of a steeper slope than before.  The Fjord head does not appear to be near though. 


Storbreen, Svalbard in 2002 Landsat image.  The red arrows indicate 1990 terminus , yellow arrow the 2017 terminus and purple dots the snowline. 


Monacobreen Separates from Seligerbreen, Svalbard

Monacobreen Separation from Seligerbreen in 1999 and 2016 Landsat images.  The red arrow is the 1999 terminus location and yellow arrow the 2016 terminus location. 

Moancobreen  is a glacier that terminates at the head of Liefdefjorden , a branch of Woodfjorden in Spitsbergen, Svalbard. NW Spitsbergen is a region that has experienced extensive long term glacier thinning from 1965 to 2007 (Nuth et al, 2010). Svalbard is host to 163 tidewater glaciers with a collective calving front of 860 km (Błaszczyk et al, 2009), Monacobreen has a 4.4 km wide calving front.  The glacier has surged in the past. Oceanwide Expeditions has expeditions to the region that capture the beauty including the polar bears and ringed seals of the area. 

In 1999 Seligerbreen and Monacobreen had a joint terminus that was 6.5 km wide.  By 2013 the glaciers had separated and the tidewater terminus of Monacobreen was 4.4 km long.  Monacobreen had retreated 2200 m from 1999-2016. The snowline in 2016, see below, was at 525 m.  There are significant melt features apparent in the 2013 Google Earth image of the 500 m elevation area and melt ponds in the 1999 image. The retreat of Monacobreen  is similar to that of most tidewater glaciers in Svalbard such as,  PaierbreenHornbreen and Svitjodbreen.

Google Earth image of Monacobreen from 2013, indicating separation had occurred, note plume of sub glacial meltwater outflow. 

TopoSvalbard place name image of the area

Landsat image indicating melt features and snowline in 1999 and 2016 Landsat images. 

Melt water drainage features in the region from 400-550 m on Monacobreen

Besselsbreen Retreat Glacier Wide Thinning , Svalbard

Besselsbreen (B) and Augnebreen (A) comparison in a 1990 and 2016 Landsat image. Red arrows indicate terminus position in 1990, yellow arrow indicates terminus in 2016, purple arrows indicate locations of upglacier thinning from 1990 to 2016 and the yellow line indicates the width of the tongue on the eastern side of Besselsbreen to the medial moraine with Augnebreen

Besselsbreen Glacier flows north to  tidewater from the Barents Icecap on Barentsoya Island in Svalbard.  The glacier has a low slope with the surface elevation reaching 250 m 10 km from the glacier front. The result is limited velocity and crevassing.  The lack of crevasses and flow enables formation of interesting surface stream networks as well. Here we examine Landsat imagery from 1990 to 2016 and Google Earth imagery from 2013 to identify key glacier changes. Dowdeswell and Bamber (1995) indicate the glacier has not surged since its Little Ice Age maximum and that the lowest 4 km of the glacier has a bed that is below sea level.  Gruell et al (2017) mapped the albedo of the glacier using MODIS and found it quite low all the way to the crest in the summer of 2003.  This suggests limited retained snowpack. The recent ocean and atmospheric warming (Isaksen et al , 2016) driving increased summer melt.

In 1990 Besselsbreen extended to within 1.2 km of Kap Bessels on the east side of the glacier and to the embayment widening on the west. The east side of the terminus had a 2.4 km wide tongue that extends beyond the rest of the terminus. There is no lake or tidewater at the terminus of Augnebreen.  The snowline is at 500 m near the top of the glacier. In 2000 the eastern tongue of the glacier is 2.0 km wide, the glacier has retreated a minor amount.  By 2016 the terminus on the west side of the inlet has retreated 1.9 km and 2.6 km on the east side of Besselsbreen.  The eastern tongue of the glacier is now 1.2 km wide.  The snowline in mid-August is at 400 m. Significant thinning has exposed substantial new bedrock areas at the purple arrows which are between 250 m and 350 m in elevation.   This is indicative of higher annual snowlines leading to significant surface melt driven thinning.  The glacier terminus has crevassing only near the embayment where the eastern tongue extends north from the rest of the terminus.  This suggest limited calving, no icebergs are noted in any images used. Warming sea temperatures and reduced sea ice are likely playing a role in enhanced near terminus melt rates. The lack of crevasses and extensive melting has led to substantial stream networks and surface ponds on the lower glacier as seen in Google Earth images below.  The low albedo of the relatively dark surface of the glacier even near the top underscores the failure to retain snow/firn through the summer allowing dust to accumulate on the surface. The medial moraine between Augnebreen and Besselsbreen will be a continuing location of separation.  Augnebreen is retreating less rapidly, 1.2 km from 1990-2016, but now has a significant tidewater embayment at the glacier front that should enhance retreat. 

The retreat here is less than the more calving dominated tidewater glaciers such as Hinlopenbreen, Kronebreen or Svitjodbreen.  In the case of Kronebreen that glacier has also been separating from Kongsvegen. 

Besselsbreen (B) and Augnebreen (A) comparison in a 2000 Landsat image. Red arrows indicate terminus position in 1990, yellow arrow indicates terminus in 2016 and the yellow line indicates the width of the tongue on the eastern side of Besselsbreen to the medial moraine with Augnebreen

Besselsbreen (B) and Augnebreen (A) comparison from TopoSvalbard map

Besselsbreen (B) and Augnebreen (A) comparison from TopoSvalbard image of 2013, yellow arrows indicate 2016 terminus. Note dark color of ice surface.

Besselsbreen in a Google Earth image indicating melt ponds and supraglacial streams.  Yellow dots indicate the ice front. 


Hinlopenbreen, Svalbard 7 km Retreat 1990-2016.

Hinlopenbreen, Svalbard in 1990 and 2016 Landsat imagery.  red arrow is 1990 terminus, yellow arrow is 2016 terminus,and Oslobreen is noted by Point O

Hinlopenbreen is a large tidewater glacier in northern Svalbard.  The glacier has a periodic history of surging, with the last surge occurring in 1970 (Nuth et al 2010). The glacier has the largest negative balance of -0.58 m/year from 1965-2005 (Nuth et al 2010).   The mass loss is ongoing including thinning on the upper glacier, which should be a build up period on a surge glacier.   Here we examine changes from 1990-2016 in Landsat images.

In 1990 Hinlopenbreen extended north terminating adjacent to a small tributary from the east, red arrow.  On the west side the terminus extended past the northern margin of Oslobreen (O) to a small tributary from the west.  The meltwater network is evident, though not as mature as in 2016. By 2016 the terminus has retreated 7 km south of the eastern tributary and several kilometers south of the northern edge of Oslobreen  merging from the west. The terminus of Hinlopenbreen is 5.6 km wide, exclusive of Oslobreen.  The width remains consistent for 10 km upglacier of the calving front. The retreat from 1990-2016 occurring two decades after the last surge is also indicative of a climate driven retreat not surge driven response. A surge driven retreat would feature accumulation zone thickening, such as noted by Murray et al (2012).  The meltwater network in 2016 indicates water flow through saturated firn, green arrows. The bare glacier ice is further down glacier.  Some of this meltwater will refreeze and not escape the glacier.  The snowline marks the region where the firn/snow is not saturated.  This is another glacier where we have to question whether a future surge is possible, as is the case at Fridtjovbreen.  The retreat of Hinlopenbreen Glacier is similar to that of most tidewater glaciers in Svalbard such as,  Paierbreen, Hornbreen and Svitjodbreen   Nuth et al (2013) determined that the glacier area over the entire archipelago has decreased by an average of 80 km2 per year over the past 30 years, a 7% reduction. 

Hinlopenbreen, Svalbard in TopoSvalbard aerial imagery.  red arrow is 1990 terminus and yellow arrow is 2016 terminus.

Hinlopenbreen, Svalbard in TopoSvalbard map, blue arrow indicate flow direction.  

August 20-16 Landsat imagery with the saturated firn in darker blue with meltwater channels evident. 

Has Fridtjovbreen, Svalbard Surged for the last time?

fridtjovbreen-compare

Fidtjovbreen, Svalbard comparison in 1998 and 2016 Landsat imagery.  Red arrow marks the 1998 terminus, yellow arrow the 2016 terminus and purple dots mark the snowline.  The Yellow numbers indicate area of separation between glaciers. Pink arrows indicate areas on the upper glacier where thinning is exposing more bedrock. F=Fridtjovbreen, S=Sagabreen, G=Gronfjordbreen

Fridtjovbreen, Svalbard, is a tidewater-terminating glacier that started a 7-year surge advance during the 1990’s. This central Spitsbergen glacier drains into Van Mijenfjorden and is currently 13.5 km long.  The glacier advanced ~2.8 km during a surge in the 1990’s at a maximum rate of ~4 m per day (Murray et al, 2003).  Murray et al (2012) observed that from 1969 to 1990, the glacier retreated ~500 m and lost 5% of its volume.  During this interval the glacier thinned up to 60 m in the lower elevations while thickening up to 20 m in its higher elevations. The upper part of the glacier is considered the reservoir zone, which after sufficient thickening and slope increase versus lower glacier glacier, receiving zone, surges yielding an increased flux into the receiving zone. If the reservoir zone is not an accumulation zone due to climate change, than the surge mechanism in this case is lost.  Murray et al (2012) observed that the reservoir zone thinned by up to ~120 m and the receiving zone thickened by ~140 m during the most recent surge. Lonne et al (2014) examined glacial surges in Svalbard noting they are protracted and characterized by individual dynamic evolution. Fridtjovbreen provides a well documented example of a 12 year (1991–2002) surge. that Lonne et al (2014) report  relocated 5 km2 of ice into the fjord, yet 15 years later leaves little visual evidence behind. The advance led to the overriding of Sagabreen (S) observed by Glasser et al (1998).

The most recent surge occurred in a climate of decreasing overall ice volume, but in an environment of accumulation zone thickening on Fridtjovbreen (Lonne et al 2014). Here we examine Landsat imagery that illustrates both retreat from 1998 to 2016 and that instead of thickening during the quiescent phase, high snow lines have led to thinning even at the head of the glacier.  From 1998 to 2016 the glacier has retreated 2.2 km.  This had led to separation from Sagabreen (1) from Fridtjovbreen.  Thinning at higher elevations had led to bedrock expansion at each pink arrow in the comparison of 1998 and 2016, as well as the 2000 to 2015 imagery below.  In each of the four years the snowline has risen to above 500 m by the end of the melt season.  In 2016 the image is from the end of July, by early September the snowline had risen well above 500 m. There is also separation of glaciers adjacent to Gronfjordbreen at an elevation of 300 m, at Point 2 and 3. This implies that the reservoir zone is losing mass and cannot initiate a future surge. The thinning, retreat and volume loss parallels that of other glaciers in the area, that are not surging Frostisen and PaierbreenLonne et al (2014) note that although the surge mechanism itself is unrelated to climate, climatic conditions play a major role in the course of a surge.  I would add that climate can eliminate the potential for a surge if the reservoir region is no longer an area of accumulation, without which there will not be thickening.

fridtjovbreen-landsat-tsl

Fridtjovbreen, Svalbard comparison in 2002 and 2015 Landsat imagery.  Yellow arrow the 2016 terminus and purple dots the snowline.  Purple dots indicate the snowline and Pink arrows indicate areas on the upper glacier where thinning is exposing more bedrock. 

 fridtjovbreen-map

Frostisen Ice Cap Svalbard, Ongoing Defrosting 1990-2015

frostisen compare

Frostisen Ice Cap in 1990 and 2015 Landsat images.  Red arrow is the 1990 terminus location, yellow arrow the 2015 terminus location.  Purple arrows indicate thinning on the upper margin of the ice cap, and the letter A indicates an outcrop of rock emerging through the ice.

Frostisen is an ice cap in Dickson Land of Central Svalbard.  The World Glacier inventory of 1960 listed the area of the ice cap at 19 square kilometers, by 2007 the Randolph Glacier Inventory indicated the ice cap area at 13.4 square kilometers.  Malecki (2013) examined seven glaciers in this region and found an acceleration in losses from 1990-2011 compared to 1960-1990 due to an increase in summer temperature post-1990 which led to higher annual equilibrium line altitudes.  The seven glacier lost 39% of their volume from 1960-2009. Here we compare 1990 and 2015 Landsat images to indicate changes in the ice cap . Malecki (2013) also noted evidence of a rapid increase in thinning rates in the upper parts of the studied glaciers, linked to decreasing albedo in former accumulation zones.

In 1990 two outlet glaciers on the east side of the icefield, Skandalsbreen and Studentbreen, after dropping over a prominent sill at 475 m extended approximately 2 km downvalley.  At Point A there is no sign of bedrock. There are limited snowpatches 10% of the ice cap with three weeks left in the melt season. In 2015 the eastern outlet glaciers have a limited extent after descending the sill, Skandalsbreen has retreated 975 m and Studentbreen 1300 m since 1990.  At Point A bedrock has emerged, this is easier seen in the image below. This is an indication of thinning in the midst of what should be the accumulation zone.  In 2013 and 2015 and many other years the ice cap has lost all of its snowcover indicating it has no accumulation zone and cannot survive (Pelto, 2010). The purple arrows indicate thinning at the upper margin of the glacier near 650 m, this would not happen if this area was acting as an accumulation zone. Nuth et al (2013) noted a 7% loss in glacier area in the last 30 years in Svalbard. The tidewater glaciers of Svalbard get most of the attention, but Frostisen like other inland terminating glaciers such as Belopolskijbreen is losing volume rapidly. .

frostisen image

TopoSvalbard satellite view above and map view below of Frostisen Ice Cap.  The maximum elevation of 650 m has been below the regional snowline many recent years. 

frostisen map

Belopolskijbreen Retreat Generates Terminus Split, Svalbard

BELOPOL COMPARE

Belopolskijbreen comparison in 1990 and 2014 Landsat images.  Red arrow is the 1990 terminus location, yellow the 2014 extent of the a bedrock ridge separating the two lobes of the glacier, and purple arrow an area of thinning at the head of the glacier. 

Most of the attention on Svalbard glaciers goes to the larger tidewater glaciers, which collectively having been losing volume rapidly.  Belopolskijbreen in Sorkappland near the southern tip of Svalbard a land based glacier that we examine here using Landsat images from 1990 to 2014.  The glacier is adjacent to Olsokbreen a rapidly retreating tidewater glacier. In 1990 and in the TopoSvalbard maps indicate the glacier terminating in proglacial lakes A and B. The snowline is restricted to the very top of the glacier.  With limited retained snowpack anywhere, the glacier will thin and retreat significantly.  In the middle of the glacier near the red arrow is a bedrock ridge that 700 m into the glacier.  By 2014 the bedrock ridge has extended to the yellow arrow, an additional 700 m.  The glacier has retreated 500 m from Lake A and 650 m from Lake B. The retreat of approximately 500 m across a 4 km wide glacier front plus the expansion of bedrock in the middle, represents more than 2 square kilometers of area lost.  This retreat will continues as the snowline has been limited to the very top of the glacier in 2013, 2014 and 2015. The 2013 Landsat image below indicates the snowline with purple dots.  The snowline is above 375 m with the top of the glacier at just over 400 m.  The glacier has 10% snowcover retained at a maximum, the minimum needed for equilibrium is 50%.

Nuth et al (2013) determined that the glacier area over the entire archipelago has decreased by an average of 80 km2 per year over the past 30 years, a 7% reduction. In the most recent period 1990-2007, terminus retreat was larger than in an earlier period from 1930-1990, while area shrinkage was smaller. Svalbard is host to 163 tidewater glaciers with a collective calving front of 860 km (Błaszczyk et al, 2009). Blaszczyk et al. (2013) reported the total area of the glacier cover lost in Hornsund Fjord area from 1899–2010 was approximately 172 square kilometers, which is just north of Sorkappland.

belopol

TopoSvalbard map of Belopolskijbreen, terminating at Lake A and B. Red arrow marks ridge separating glacier terminus into two lobes.

belopol 2013sn

2013 Landsat images.  Note the snowpack limited to the very top of the glacier, purple dots

Paierbreen Rapid Calving Retreat, Svalbard

paierbreen compare
1990 and 2014 Landsat images indicating Paierbreen (P), Muhlbacherbreen (MU) and Hansbreen (H). The red arrow and red dots indicate the 1990 terminus location and yellow arrows and yellow dots the 2014 terminus location. The purple arrow indicates the location of a supraglacial lake that was persistent in the 1990’s but is no longer evident in 2013, 2014 and 2015.

From 1990 to 2014 all four of the glaciers terminating along the north coast of Hornsund have retreated significantly: Hansbreen (H), Paierbreen (P), Muhlbacherbreen (MU), Storbreen. Svalbard is host to 163 tidewater glaciers with a collective calving front of 860 km (Błaszczyk et al, 2009). Nuth et al (2013) determined that the glacier area over the entire archipelago has decreased by an average of 80 km2 per year over the past 30 years, a 7% reduction. In the most recent period 1990-2007, terminus retreat was larger than in an earlier period from 1930-1990, while area shrinkage was smaller. Hornsund is a fjord that in 2014 almost cuts through the southern Island of Svalbard. The Institute of Geophysics Polish Academy has maintained a Polish Research Station in Hornsund since 1957.  The 1984 map, from the University of Silesia, of the glaciers and geomorphology document the extent of the glaciers in 1983. A more detailed examination by the same researchers, Blaszczyk et al. (2013) reported the total area of the glacier cover lost in Hornsund Fjord area from 1899–2010 was approximately 172 square kilometers. This groups ongoing research, Petlicki et al (2015) , identified the impact of a waterline notch that enhances calving at Hansbreen. This study identifies the importance of water temperature and reduced sea ice cover in the fjord.

Paierbreen in 1990 terminated in Burgerbutka with a 1900 meter long calving front. At the purple arrow a supraglacial lake existed that is also seen in the TopoSvalbard Map. The snowline on Paierbreen is further upglacier of the calving front than for the adjacent glaciers indicating a lower surface slope. By 2014 the glacier has retreated 2200 m with the current terminus at a narrow point in the fjord.  Beyond this point the fjord again expands, which will enhance calving and retreat.  There is no significant step in glacier slope indicating where the tidewater limit is, given the low slope, it is not likely close to the current ice front.  The calving front is 1600 m wide in 2014. The supraglacial lake is only a sliver in 2013 and 2014. The snowline in the Landsat image from 2013 is at 450 m. The story of retreat here is the same as at Samarinbreen and Hornbreen
paierbreen 2013
2013 Landsat Image

paierbreen map
Topographic Map from TopoSvalbard

paierbreen aerial
Satellite Image from TopoSvalbard

Kronebreen and Kongsvegen, Svalbard Initiation of Glacier Separation 2015

kronebreen terminus2
Kronebreen terminus in 2013 (left) and 2015 (right), note the configuration change and separation initiation of Kronebreen and Kongsvegen at yellow arrow.
Kronebreen is a large, (450 km2) tidewater glacier on the northwest coast of Svalbard terminating in a shared terminus with Kongsvegen at the head of Kongsfjorden.  Changes in 2015 indicate the shared terminus will not continue.  Luckman et al (2015) observed Kronebreen has a winter speed of 1.5–2 m/day, with summer peaks of 3–4 m/day associated with positive air temperatures and periods of high rainfall.  The terminus of the glacier was relatively stable from 1990 to 2001 with even a slight advance at the end of that period (Trusel et al, 2010).  The fjord lacks a significant sill at its mouth resulting in significant connectivity with water masses of the West Spitsbergen Shelf, including Atlantic Water  Trusel et al, 2010). This aspect during summer can aid in frontal ablation and terminus retreat as noted in Figure 2a from Luckman et al (2015). Shellenberger et al (2014) observed that the period of Kronebreen stability ended in 2007 and that the glacier retreated 850 m and lost 2.1 square kilometers from 2007-2013. Long term they observed that the ablation loss of the terminus reach increased from 0.14 Gt per year from 1960-1990, to 0.20 Gt per year from 1990-2007 and was 0.21 Gt per year in 2013. The University Centre in Svalbard has established a set of cameras for time lapse work at the terminus, which is fortuitous given the changes that have occurred recently. In 2015 returning in the spring University Centre in Svalbard researchers noted the thinning and stretching of the terminus reach: Doug Benn, Penelope How, Heidi Sevestre and Nick Hulton. Penelope How examines the deployment of the cameras in 2015. Here we examine Landsat images to provide a snapshot of the changes that the above researchers have examined in detail.konebreen map
Map of Glacier front from TopoSvalbard.
In 1987 the joined front terminated near the western tip of Colletthogda, red arrow. The purple arrows indicate locations for comparison to 2015 of glacier thinning. By 1998 there has been a small retreat, that will be erased by a small advance the following years. I 2011 the front remains a single linear front, the greater level of crevassing of Kronebreen is evident as well as the shallower water on the southern margin of the fjord the Kongsvegen terminus. In 2013 a larger retreat has begun, the calving front is concave with more retreat on the southern, Kongsvegen side of the terminus. In 2015 substantial changes have occurred. The front of Kronebreen has retreated 1200 m on the northern margin since 1998 and 1500 m on the southern lateral moraine, this is 300-500 m since 2013. The most striking element is the right angle turn in the calving front at the lateral moraine with Kongsvegen. This is not a stable configuration. This represents the initiation of the separation of Kronebreen and Kongsvegen. The weakness along which the process is taking place is the lateral moraine. Kronebreen terminates in deeper water and can retreat more rapidly via calving. This retreat has been driven by enhanced ablation both at the surface and by the ocean. The higher velocity of Kronebreen is clear in the video of the glacier from the University Center of Svalbard. The process of separatiion is a trend in Svalbard note Samarinbreen.and Vasilievbreen.kronebreen 1987
1987 Landsat image

kronbreen 1998
1998 Landsat image
kronebreen terminus ge 2014
2011 Image from TopoSvalbard, note the differenence in level of calving between Kronebreen and Kongsvegen.

kronebreen 2013
2013 Landsat image

kronebreen 2015
2015 Landsat image

Samarinbreen, Svalbard Rapid Retreat 1990-2014

samarinbreen compare
Samarinbreen (SA) 1990 left, and 2014 right, Landsat image comparison.  KO=Korberbreen, CH=Chomjakovbreen,
ME=Mendeleevbreen Red arrows indicate 1990 terminus position, yellow arrows 2014 terminus. and purple dots the snowline.

Samarinbreen terminated in a calving front in Samarinvagan, a bay on the southern side of Hornsund Fjord. Hornsund is a fjord that in 2015 almost cuts through the southern Island of Svalbard, due to the retreat of Hamberbergbreen and Hornbreen. The Institute of Geophysics Polish Academy have maintained a Polish Research Station in Hornsund since 1957. The 1984 map, from the University of Silesia, of the glaciers and geomorphology document the extent of the glaciers in 1983 in the region. Blaszczyk et al (2009) analysis identified 163 Svalbard glaciers that are tidewater with the total length calving ice−cliffs at 860 km for the 2001-2006 period. They observed that 14 glaciers had retreated from the ocean to the land over the last 3-4 decades. Nuth et al (2013) determined that the glacier area over the entire archipelago has decreased by an average of 80 km2/year over the past 30 years, a 7% reduction.In the most recent period 1990-2007, terminus retreat was larger than in an earlier period from 1930-1990, while area shrinkage was smaller. A more detailed examination by the same researchers, Blaszczyk, Jania and Kolondra (2013) reported the total area of the glacier cover lost in Hornsund Fjord area from 1899–2010 was approximately 172 km2. The average glacier area retreat increased from a mean of 1.6 square kilometers per year to 3 square kilometers per year since 2000. Samarinbreen begins near the height of land of Sorkappland sharing the divide with Olsokbreen at an elevation of below 400 m.
samarinbreen map
Map from Topo Svalbard
Samarinbreen retreat is documented by the map produced by the University of Silesia; 1936-1949 retreat equals 750 m, 1949-1961 retreat equals 1200 m, 1961-1983 retreat equals 1700 m. Landsat imagery from 1990-2014 illustrates that the retreat of the glacier has been 2.1 km. The 1990 terminus is indicated by the red arrow, and the 2014 terminus is the yellow arrow. The tidewater front shows limited icebergs from calving in all images I have reviewed, yet calving must be a key means of volume loss.   The snowline in 1990 is between 300 m in 1900. In 2014 the image is earlier in the melt season, but is at at 275 m.  The 2012 image of the terminus region illustrates the snowline again near 300 m. There is limited glacier area above 400 m, indicating the high snowfall and low melt rate of the region allowing a glacier to have such a low mean elevation. That the snowline is consistently so close in elevation to the highest section of the glacier indicates that mass loss will continue as will retreat.

samarinbreen silesia map

University of Silesia Map of Hornsund


saraminbreen image
Samrinbreen 2012 image from Topo Svalbard, red arrow indicates new island.