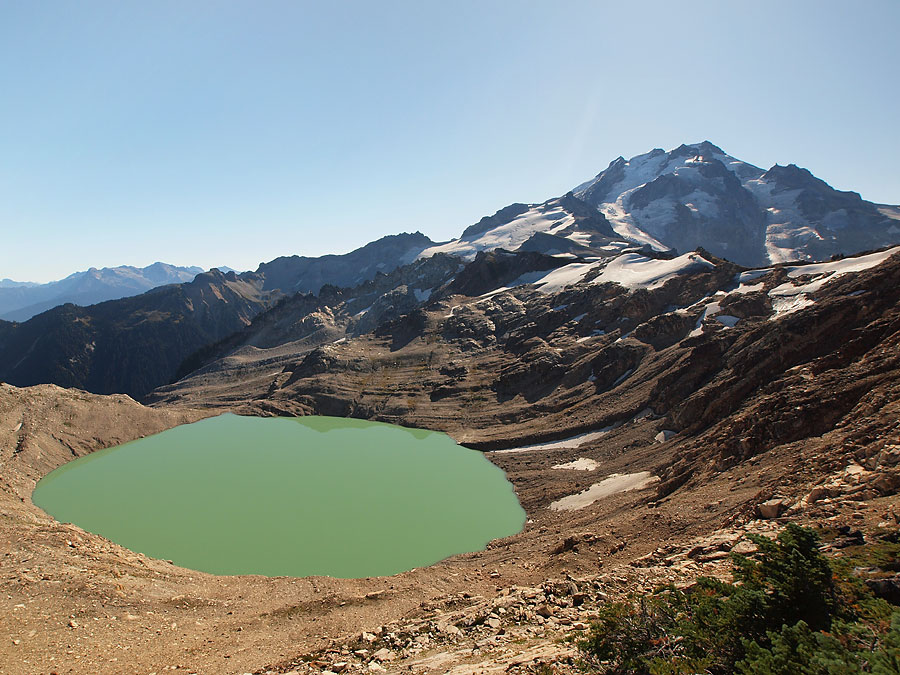
Conard Glacier looking south across Conrad Lake in 1993. Glacier terminates 193 m from lake.
In 1993 we surveyed the glaciers of the Goat Rocks Wilderness, Washington. Conrad Glacier was our main focus, we worked with a field class from Pacific Lutheran University to measure snowpack, area and runoff from the glacier. In 1958 the glacier reached Conrad Lake and had an area of 0.5 km². In 1993 at our first visit the glacier had retreated 193 m from the lake and had an area of 0.25 km². There was no movement on the lower glacier. In 1998 and 2006 we noted continued retreat and thinning with retreat from the lake of 495 m in and an area of 0.16 km² of the largest upper eastern segment. The western upper section had completely separated from the lower western part, and both had separated from the upper eastern segment. In 2015 the USGS inventory indicated an area of 0.13 km² for Conrad Glacier. The area of the largest ice mass (C1 and C2) had further declined by 2020 to 0.10 km². Summer of 2021 and 2022 were years of exceptional melt from Mount Shasta through southern British Columbia that further reduced the four glacier fragments by October 2022. The largest having an area of less than 0.04 km², too small to qualify as a glacier as this small area does not allow for movement. The combined area of all four fragments is less than 0.1 km². The loss of volume of this glacier parallels that of many North Cascade glaciers we have observed annually for 40 years including glaciers that have disappeared such as Hinman, Lewis, Lyall, Milk Lake and Spider Glacier.
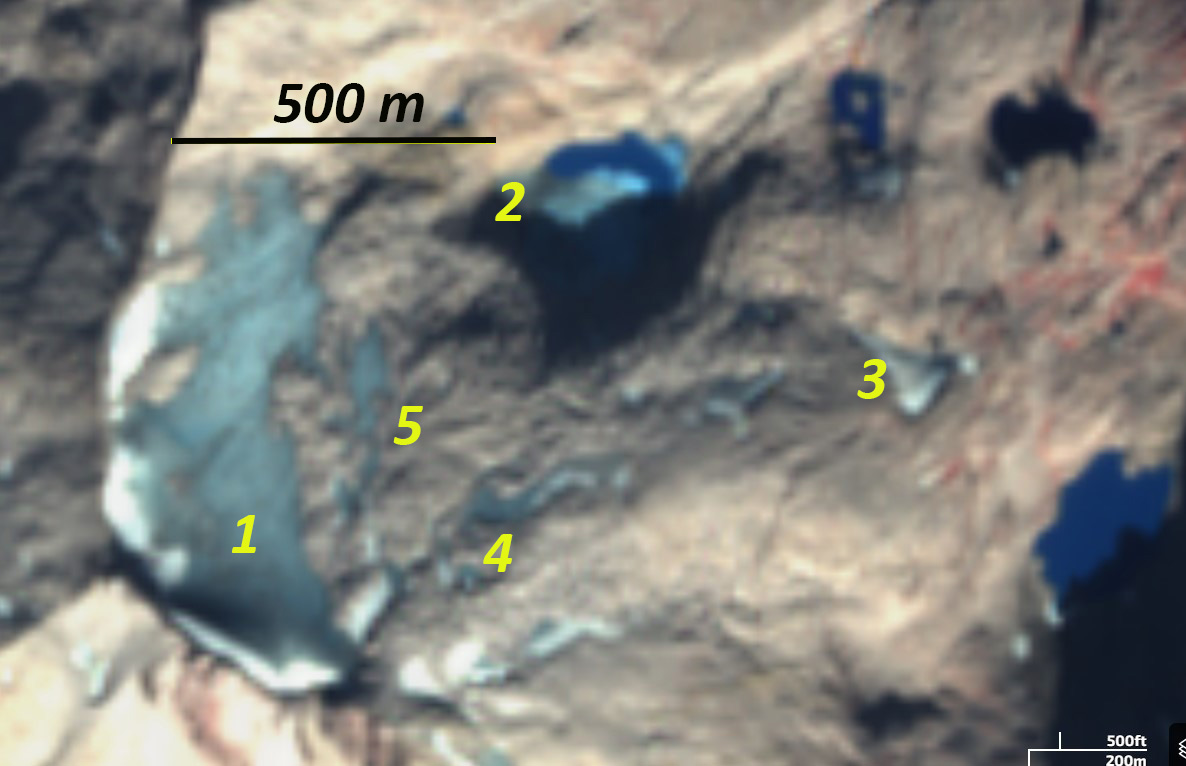
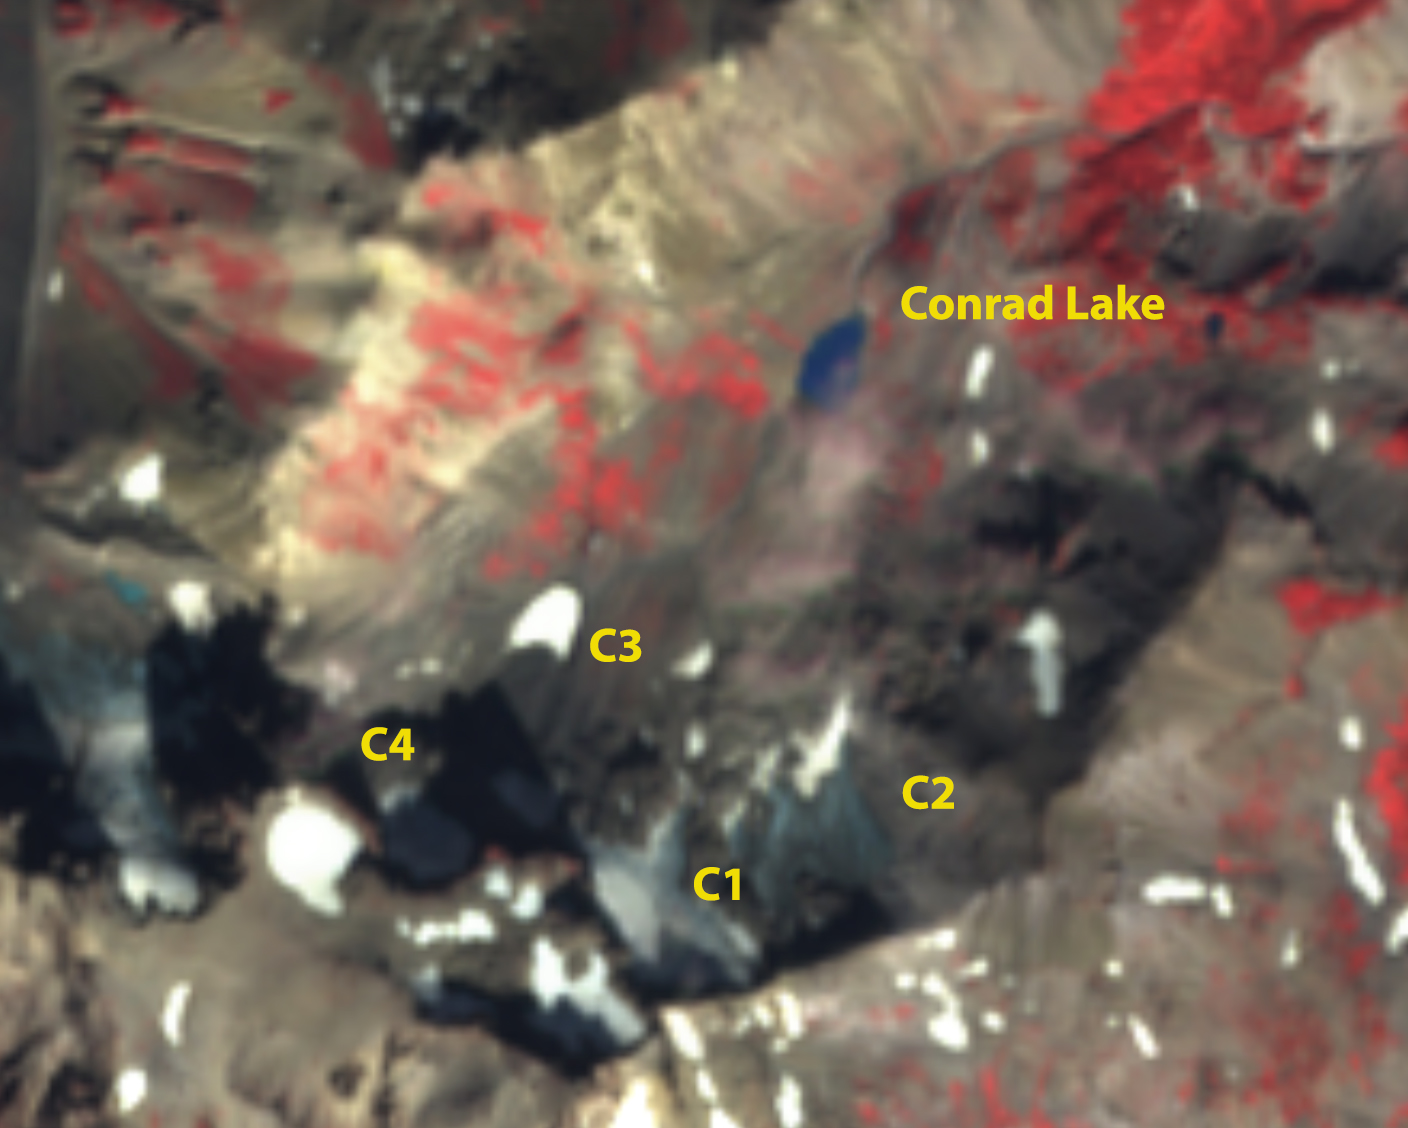
Conrad Glacier in October 2022 false color Sentinel images indicating the four remaining fragments the largest C1 is less than 0.04 km².
Conrad Glacier in 2020 Google Earth image indicating the fragmentation that has occurred.
Conrad Glacier in 2006 Google Earth image indicating the retreat of the glacier and fragmentation. Glacier now terminates 495 m from lake.
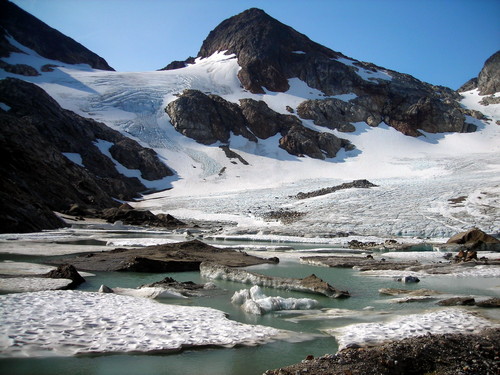
Traversing the lower Conrad Glacier in 1993, notice the low slope of this section that melted away by 2006. The steeper slopes with blue ice are where C1 and C2 developed.
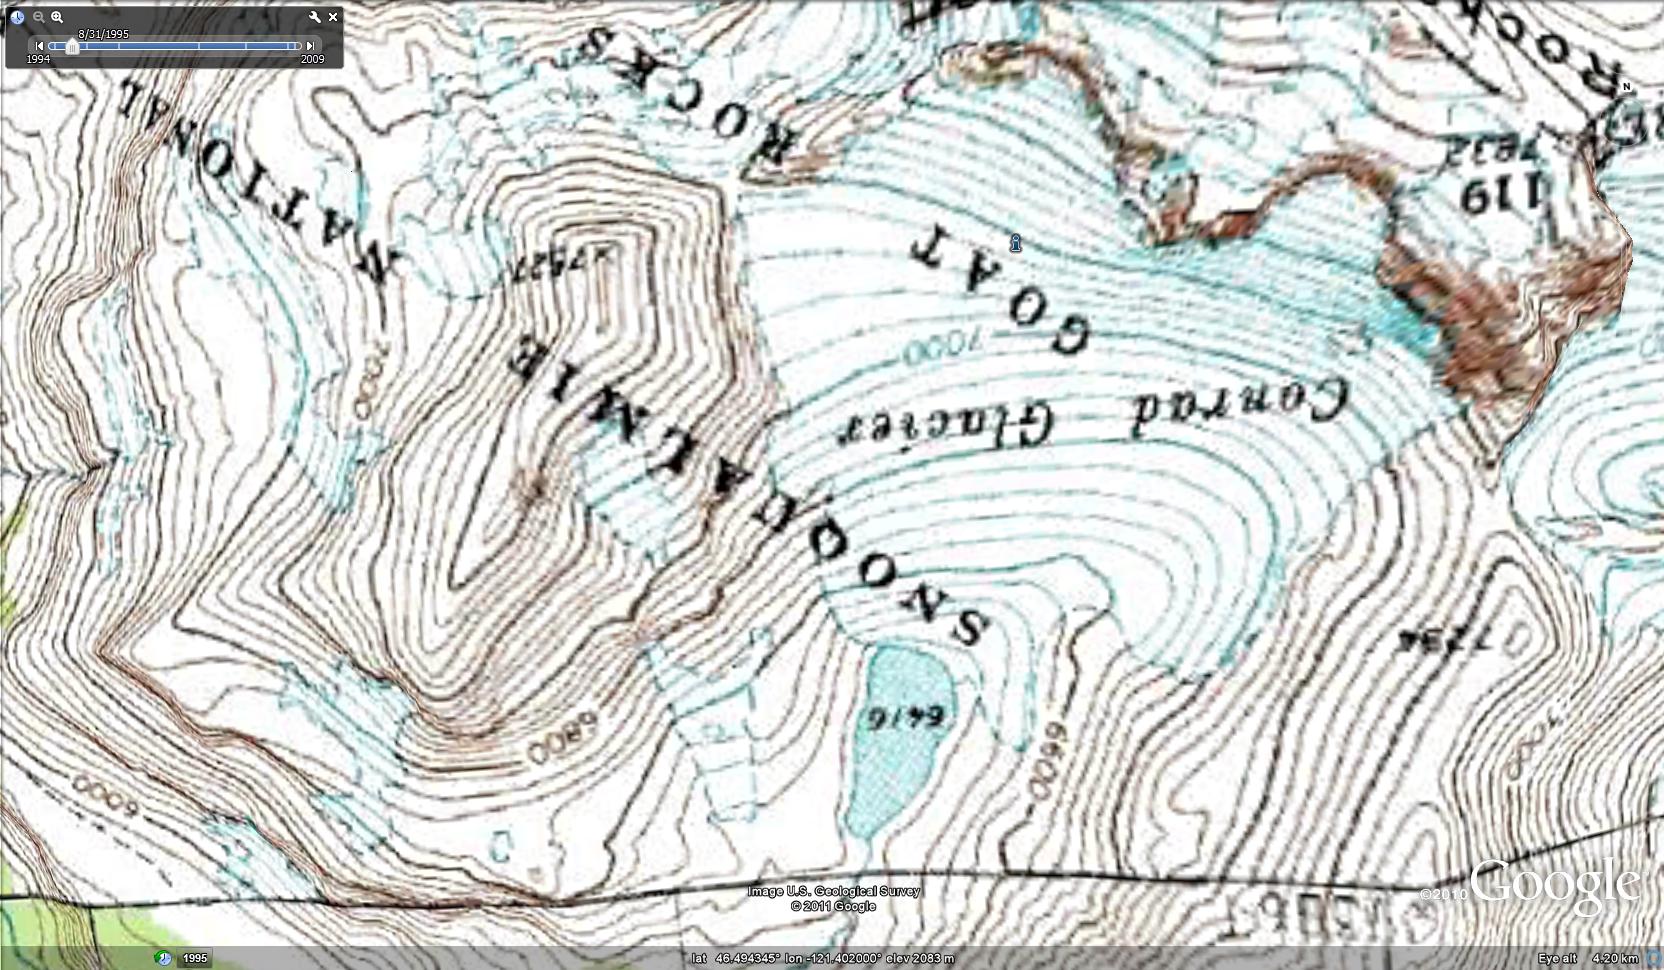
Conrad Glacier in 1958 USGS map when it connected to Conrad Lake.
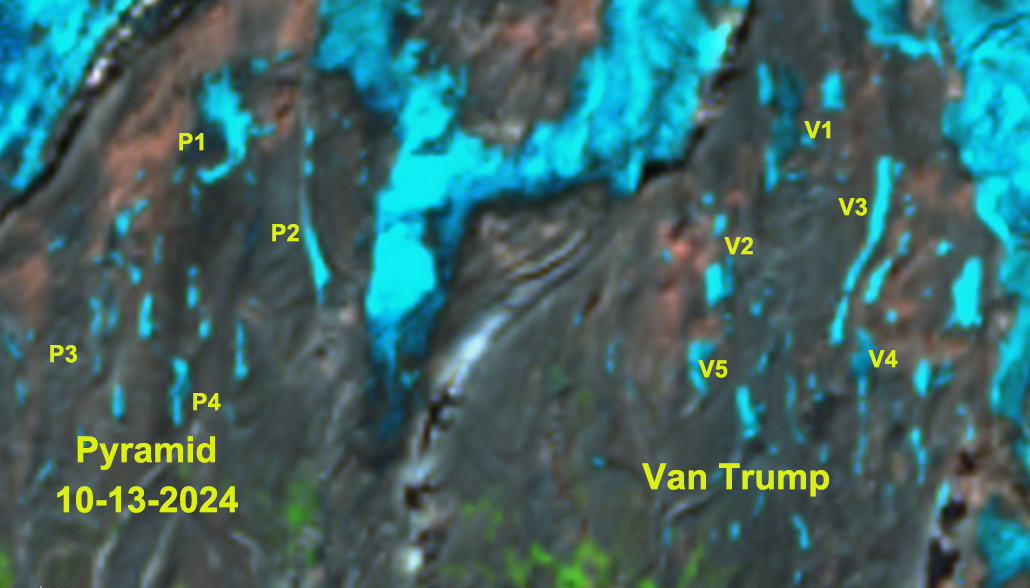
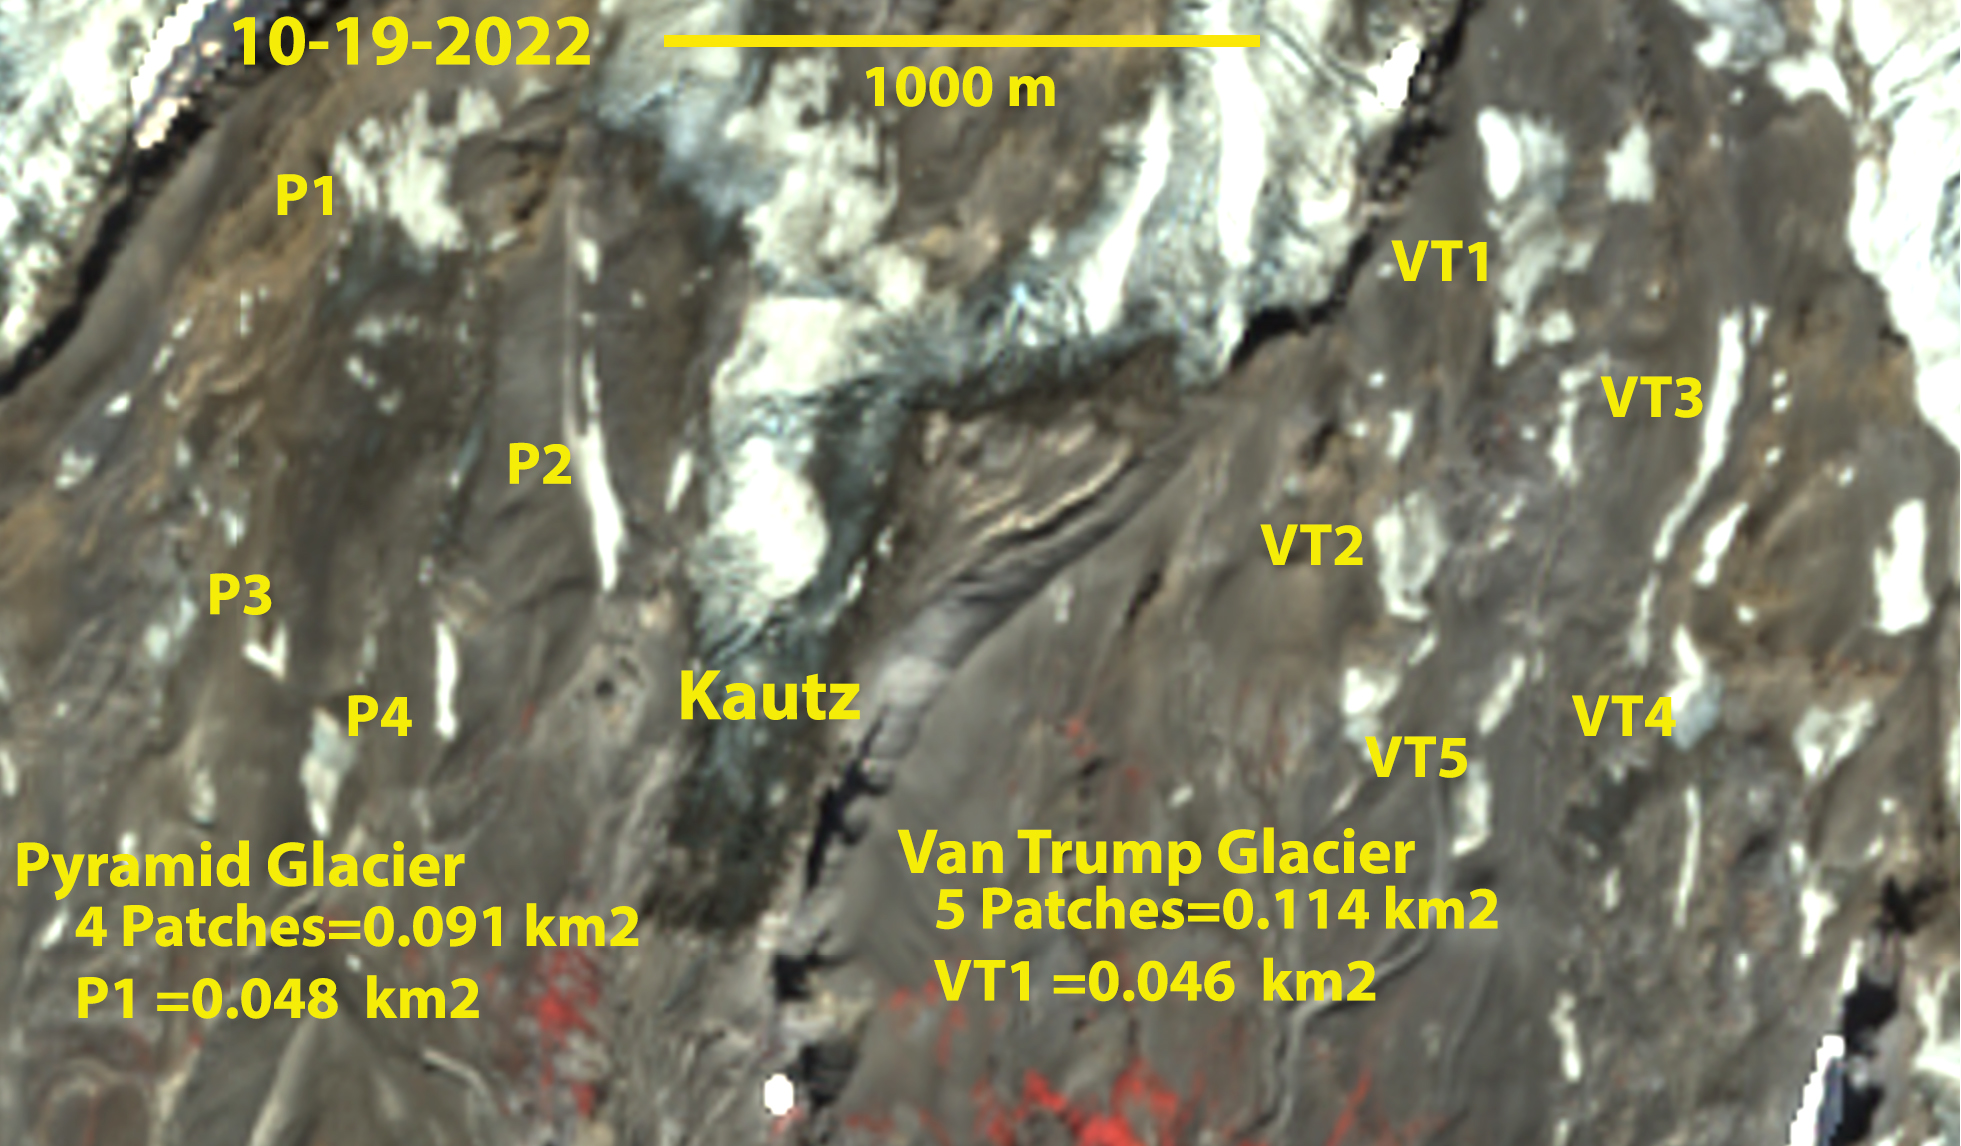
Van Trump (VT) and Pyramid (P) Snowfields Oct. 19, 2022 false color Sentinel image. VT1 and P1 are the largest at ~0.046 and 0.048 km² respectively.
Scott Beason, Taylor Kenyon, Rob Jost and Lauren Walker (2023) provide an excellent record of glacier extent change on Mount Rainier Glaciers for the 1896-2021 period. They note a 41.6% reduction in Mount Rainier glacier area during this 125 year period. This study identified Stevens Glacier as no longer existing as of Sept,. 2021. They also note that Pyramid and Van Trump Glacier are in serious peril having lost 33% of their area from 2015-2021. For Van Trump they mapped the combined area of six separate snow/ice areas at 0.117 km² (Beason et al 2023). For Pyramid they mapped the combined area of eight separate snow/ice areas at 0.176 km² (Beason et al 2023).
The summer of 2021 and 2022 both led to substantial mass losses in the Cascade Range, with many glaciers losing all snowcover. The typical minimum size threshold for a glacier is 0.1 km², with areas smaller than this to small to generate the ice motion that identifies a glacier from a perennial snowfield. On October 19, 2022 it is evident that there is no single ice mass/patch with an area of more than 0.05 km² for Pyramid or Van Trump Glacier. The collective five primary pathces of Van Trump combined = 0.114 km² and four on Pyramid Glacier combined=0.091 km². Smaller patches (crumbs) that add up to the minimum threshold as in this case, cannot be put together to qualify these as glaciers (cookies). Hence, it is evident that Van Trump and Pyramid Glacier as of 2022 do not meet the threshold to be glaciers. In the North Cascade Range I have witnessed a number of glaciers disappear including Hinman, Lewis, Lyall, Milk Lake, Snow Creek and Spider Glacier. This led to the identification of three key thresholds that lead to glacier loss.
Van Trump (VT) and Pyramid (P) Snowfields Sept. 25, 2019 false color Sentinel image, with USGS map above.
Threshold 1-Disquilibrium Response
Glaciers respond to climate in an attempt to achieve equilibrium. A glacier advances due to a climate cooling/snowfall increase that causes positive mass balance. A climate warming/snowfall decrease leads to negative mass balances and glacier retreat. To reestablish equilibrium a retreating glacier must lose enough of its highest ablating sections, usually at the lowest elevations, so that accumulating snows in the near the head of the glacier once again are equivalent to overall ablation, and an equilibrium balance is approached. This is the expected response for glaciers.
From 1984-2022 I have worked annually in the field on North Cascade glaciers monitoring their resonse to climate change. By 2005 it was apparent that many of the glaciers were experiencing a disequilibrium response, and were not able to reestablish equilibrium through retreat. This was not what I had expected in 1984, but in 2005 the disappearance of Lewis, Milk Lake and Spider Glacier had forced me to develop this model (Pelto, 2006). A glacier that is in disequilibrium with present climate will melt away with a continuation of this climate, because it cannot retreat to a point where it is sustaining. A key trait of a glacier in disequilibrium is when the glacier is experiencing significant thinning from the terminus through the accumulation zone.
Foss Glacier, North Cascades with bedrock emerging as glacier thins and fragments even near the top of the glacier.
Rapid area loss of Colonial Glacier, North Cascades not just at the terminus but also at the top of the glacier.
Threshold 2-Accumulation Zone Lacks Persistence
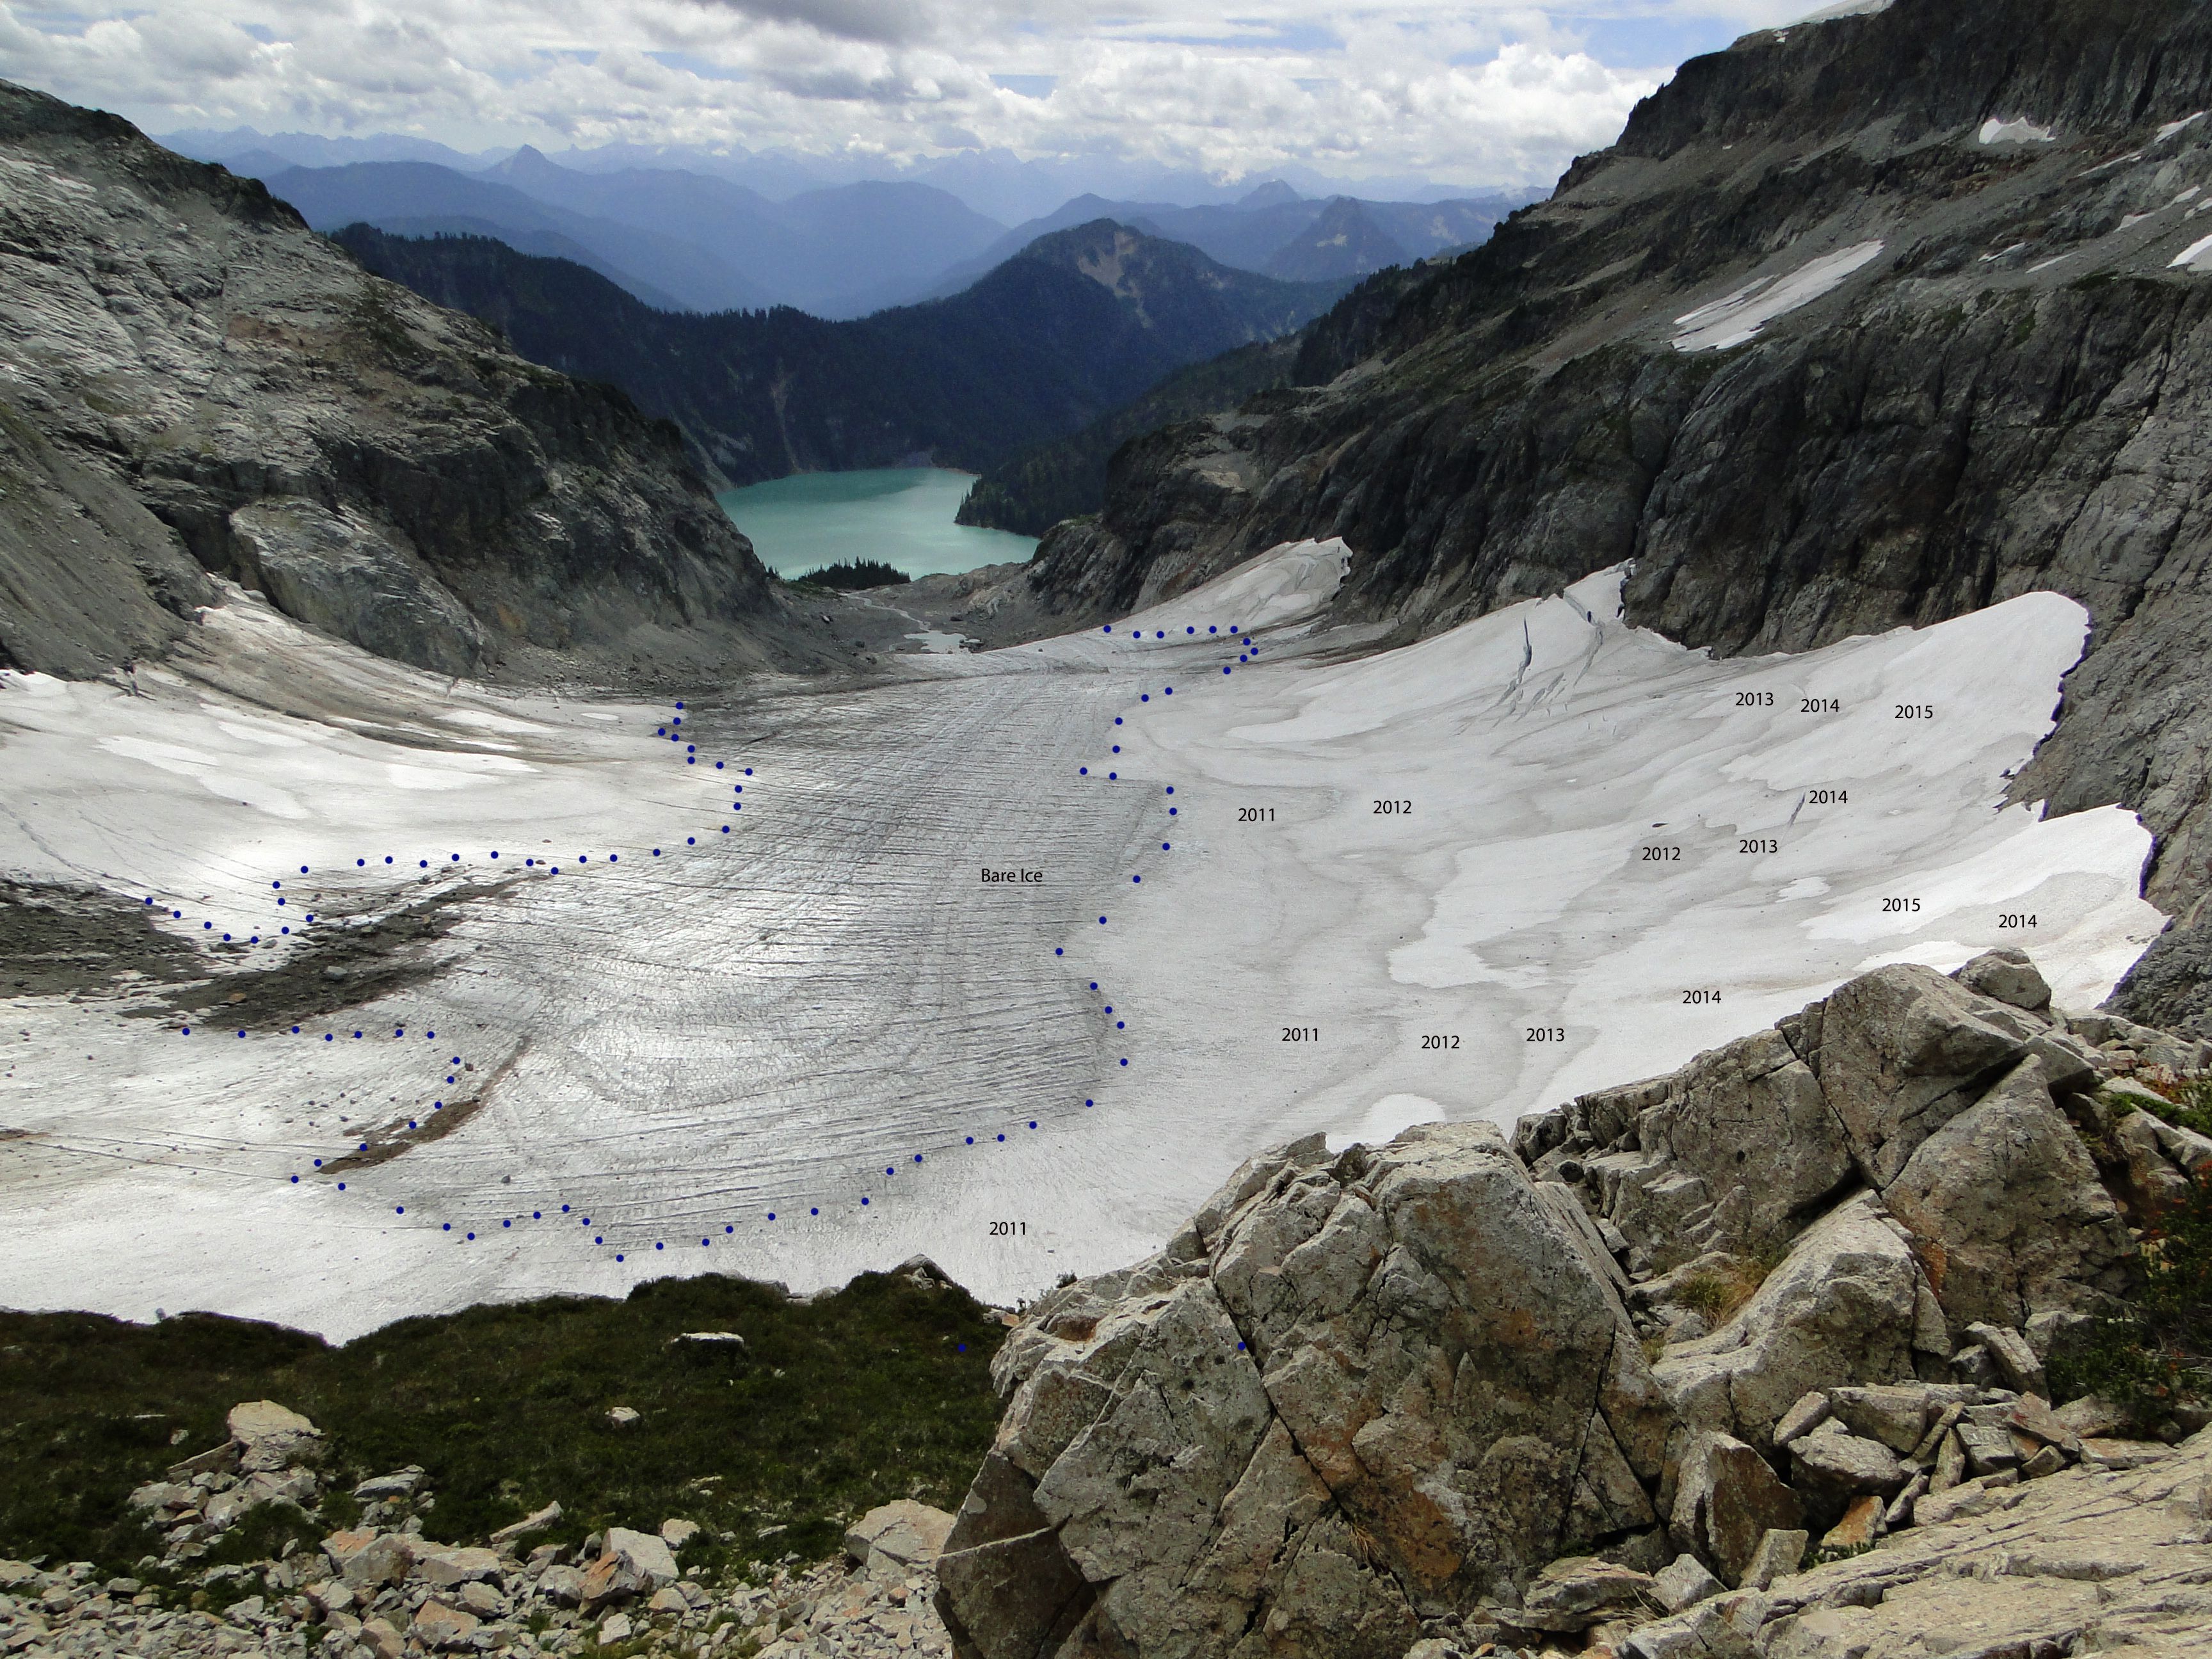
Temperate alpine glacier survival is dependent on the consistent presence of an accumulation zone (Pelto, 2010). The accumulation zone area is the region where snowcover persists through the year, and is referred to as the accumulaiton area ratio (AAR), typically 50-65% to be in balance. Low AAR values are indicative of the lack of a sizable accumulation zone during a specific year. Periodic years with low AAR values identify inconsistent accumulation zones. During consecutive years with low AAR values there is a loss of nearly all accumulated snow and considerable firn in the accumulation zone. The multiple annual firn layers exposed to ablation eliminates accumulation layers from the years when the AAR was higher. There are years where an accumulation zone exists, but this accumulation does not persist through the aforementioned years of extensive negative mass balances, hence there is no persistent accumulation zone. This is observed to have occurred on many North Cascade glaciers in 1992, 1993, 1994, 1998, 2003, 2004, 2005, 2009, 2014, 2015, 2019, 2020, 2021 and 2022. In 2005 and 2015 on Columbia Glacier the exposed annual layers in the accumulation zone are evident and indicate no preserved firn from recent years. This indicates no persistent accumulation zone, which leads to substantial thinning of the glacier in the accumulation zone
.
Columbia Glacier accumulation zone in 2005 in early August, with limited snowpack and many exposed annual layers.
Columbia Glacier accumulation zone in 2015 in early August, with limited snowpack and many exposed firn layers.
Threshold 3-Glacier Loss
If there is an ongoing lack of a persistent accumulation zone a glacier will disappear. Repeated consecutive years of exceptional mass loss, bring the process into clear focus. Many alpine glaciers have experienced this scenario in 2021-2022, resulting in a clear delineation of those that have no persistent accumulation zone. I have observed the disappearance of quite a number of glaciers after 40+ years of working in glaciated mountain ranges. It is no longer a shock. The pace is quickening, and the number of glaciers experiencing a disequilibrium response is skyrocketing.
Milk Lake Glacier in the North Cascade Range disappears.
Hinman Glacier in the North Cascade Range disappears. Remanant small ice patches in 2021 Sentinel false color image.
Anderson Glacier, Olympic Range disappears. Green arrow is 1959 terminus, pink arrow is 1990 terminus location and red arrow is bare rock area that emerged from below the glacier in this 2009 Google Earth image.
By 2024 further loss of area of each fragment of the former Van Trump and Pyramid Glacier further indicated that their capacity to return to glacier status anytime soon is non-existent. Largest fragments now under 0.025 km2
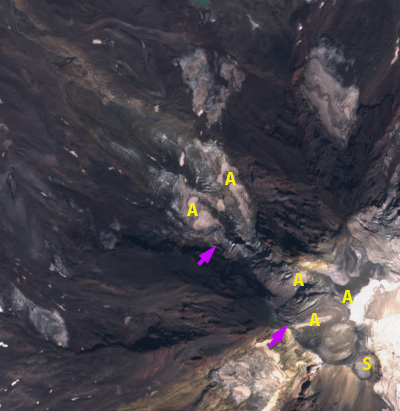
Adams Glacier in Sentinel 2 False Color image from 8-30-2021. Green dots indicate margin of the Adams Glacier and the now separated Adams Outlier section. The pink arrows indicate the top and bottom of the icefall. F=regions of exposed firn, A=areas of perennial retained accumulation.
Adams Glacier descends the north side of Mount Adams a 3743 m stratovolcano in the Cascade Range of Washington. The glacier begins from the summit plateau between 3600 m and 3700 m, before descending a steep icefall down to 2750 m and then diverging on lower slopes terminating at 2225 m. Sittts et al (2010) mapped the area change of Mount Adams glaciers from 1904 to 2006. The area was 6.93 km2 in 1904 declining to 5.16 km2 by 1969, 4.62 km2 by 1998, and 3.68 km2 in 2006. This decline since 1969 has been due largely to increased summer temperatures (Sittts et al 2010) . Here we examine the impact of the particularly warm summer of 2021 on snowpack, glacier volume and reassess the area of the glacier. The winter of 2021 had above average snowfall with 157% of the mean peak winter snowpack in April at the nearest Snotel site at Potato Hill ( 1375 m), the snowpack loss date after a dry May was the same as usual, see figure below. The mean June-August temperature at the Mount Adams Ranger Station (600 m) was the second warmest for the 1984-2021 period to 2015.
Snowpack loss from June 21 to August 25 in Sentinel images. AO=Adams Outlier, T=Terminsu Zone, I=Icefall, S= bergshrunds on upper glacier.
On June 21, 2021 nearly the entire glacier is snowcovered, which is typical. By July 1, 2021 areas of the glacier below the icefall are rapidly losing snowcover. By August 15, 50% of the glacier has retained 2021 snowcover. This rapidly diminishes to ~10% by Aug. 25, 2021. On Aug. 30, 2021 there are large areas above 10000 feet that typically retain snowcover to the end of the summer that have lost all snowcover and are particularly dirty firn, snow that fell in recent years but has not been converted to glacier ice. The retained snowcover is in five patches, the lower three are all avalanche runout zones and the upper two regions, above the icefall, of wind drift redeposition.
Adams Glacier in Sentinel 2 True Color image from 8-30-2021. Pink arrows indicate icefall top and bottom. S=summit area, A=Areas where limited pockets of 2021 snowpack has been retained through August.
Similar to Whitney Glacier on Mount Shasta , Adams Glacier will not retain snowcover in 2021. The early exposure of bare firn and ice, which melt at a faster rate than snow is causing rapid mass losses on the upper glacier this summer, as we have reported from Easton Glacier on Mount Baker. The current area of the main glacier is 1.9 km2, with the outlier have an area of 0.3 km2. The combined area of 2.2 km2 is less than 50% of the 1998 total. The loss of snowpack from the Adams Glacier is greater than in any year since 1984, exceeding 2015. The winter of 2015 had less snowfall and the mean summer temperature was warmer. The key difference is likely the excessive melt of the late June 2021 heat wave that is particularly impactful early in summer. Finn et al (2017) noted that the upper reaches of Adams Glacier ranged from ~25 to 60 m thick, while lower down on the volcano are the glacier is less than<~30m thick. This summer mass losses will be in the 2-3 m range on Adams Glacier, based on the duration of exposed ice and percentage of the glacier in the accumulation zone. This will represent a 5-10% volume loss for this glacier in 2021.
Snowpack at Potato Hill (1375 m) a Snotel site. The 2021 winter had above average peak snowpack (black line), but typical melt out date.


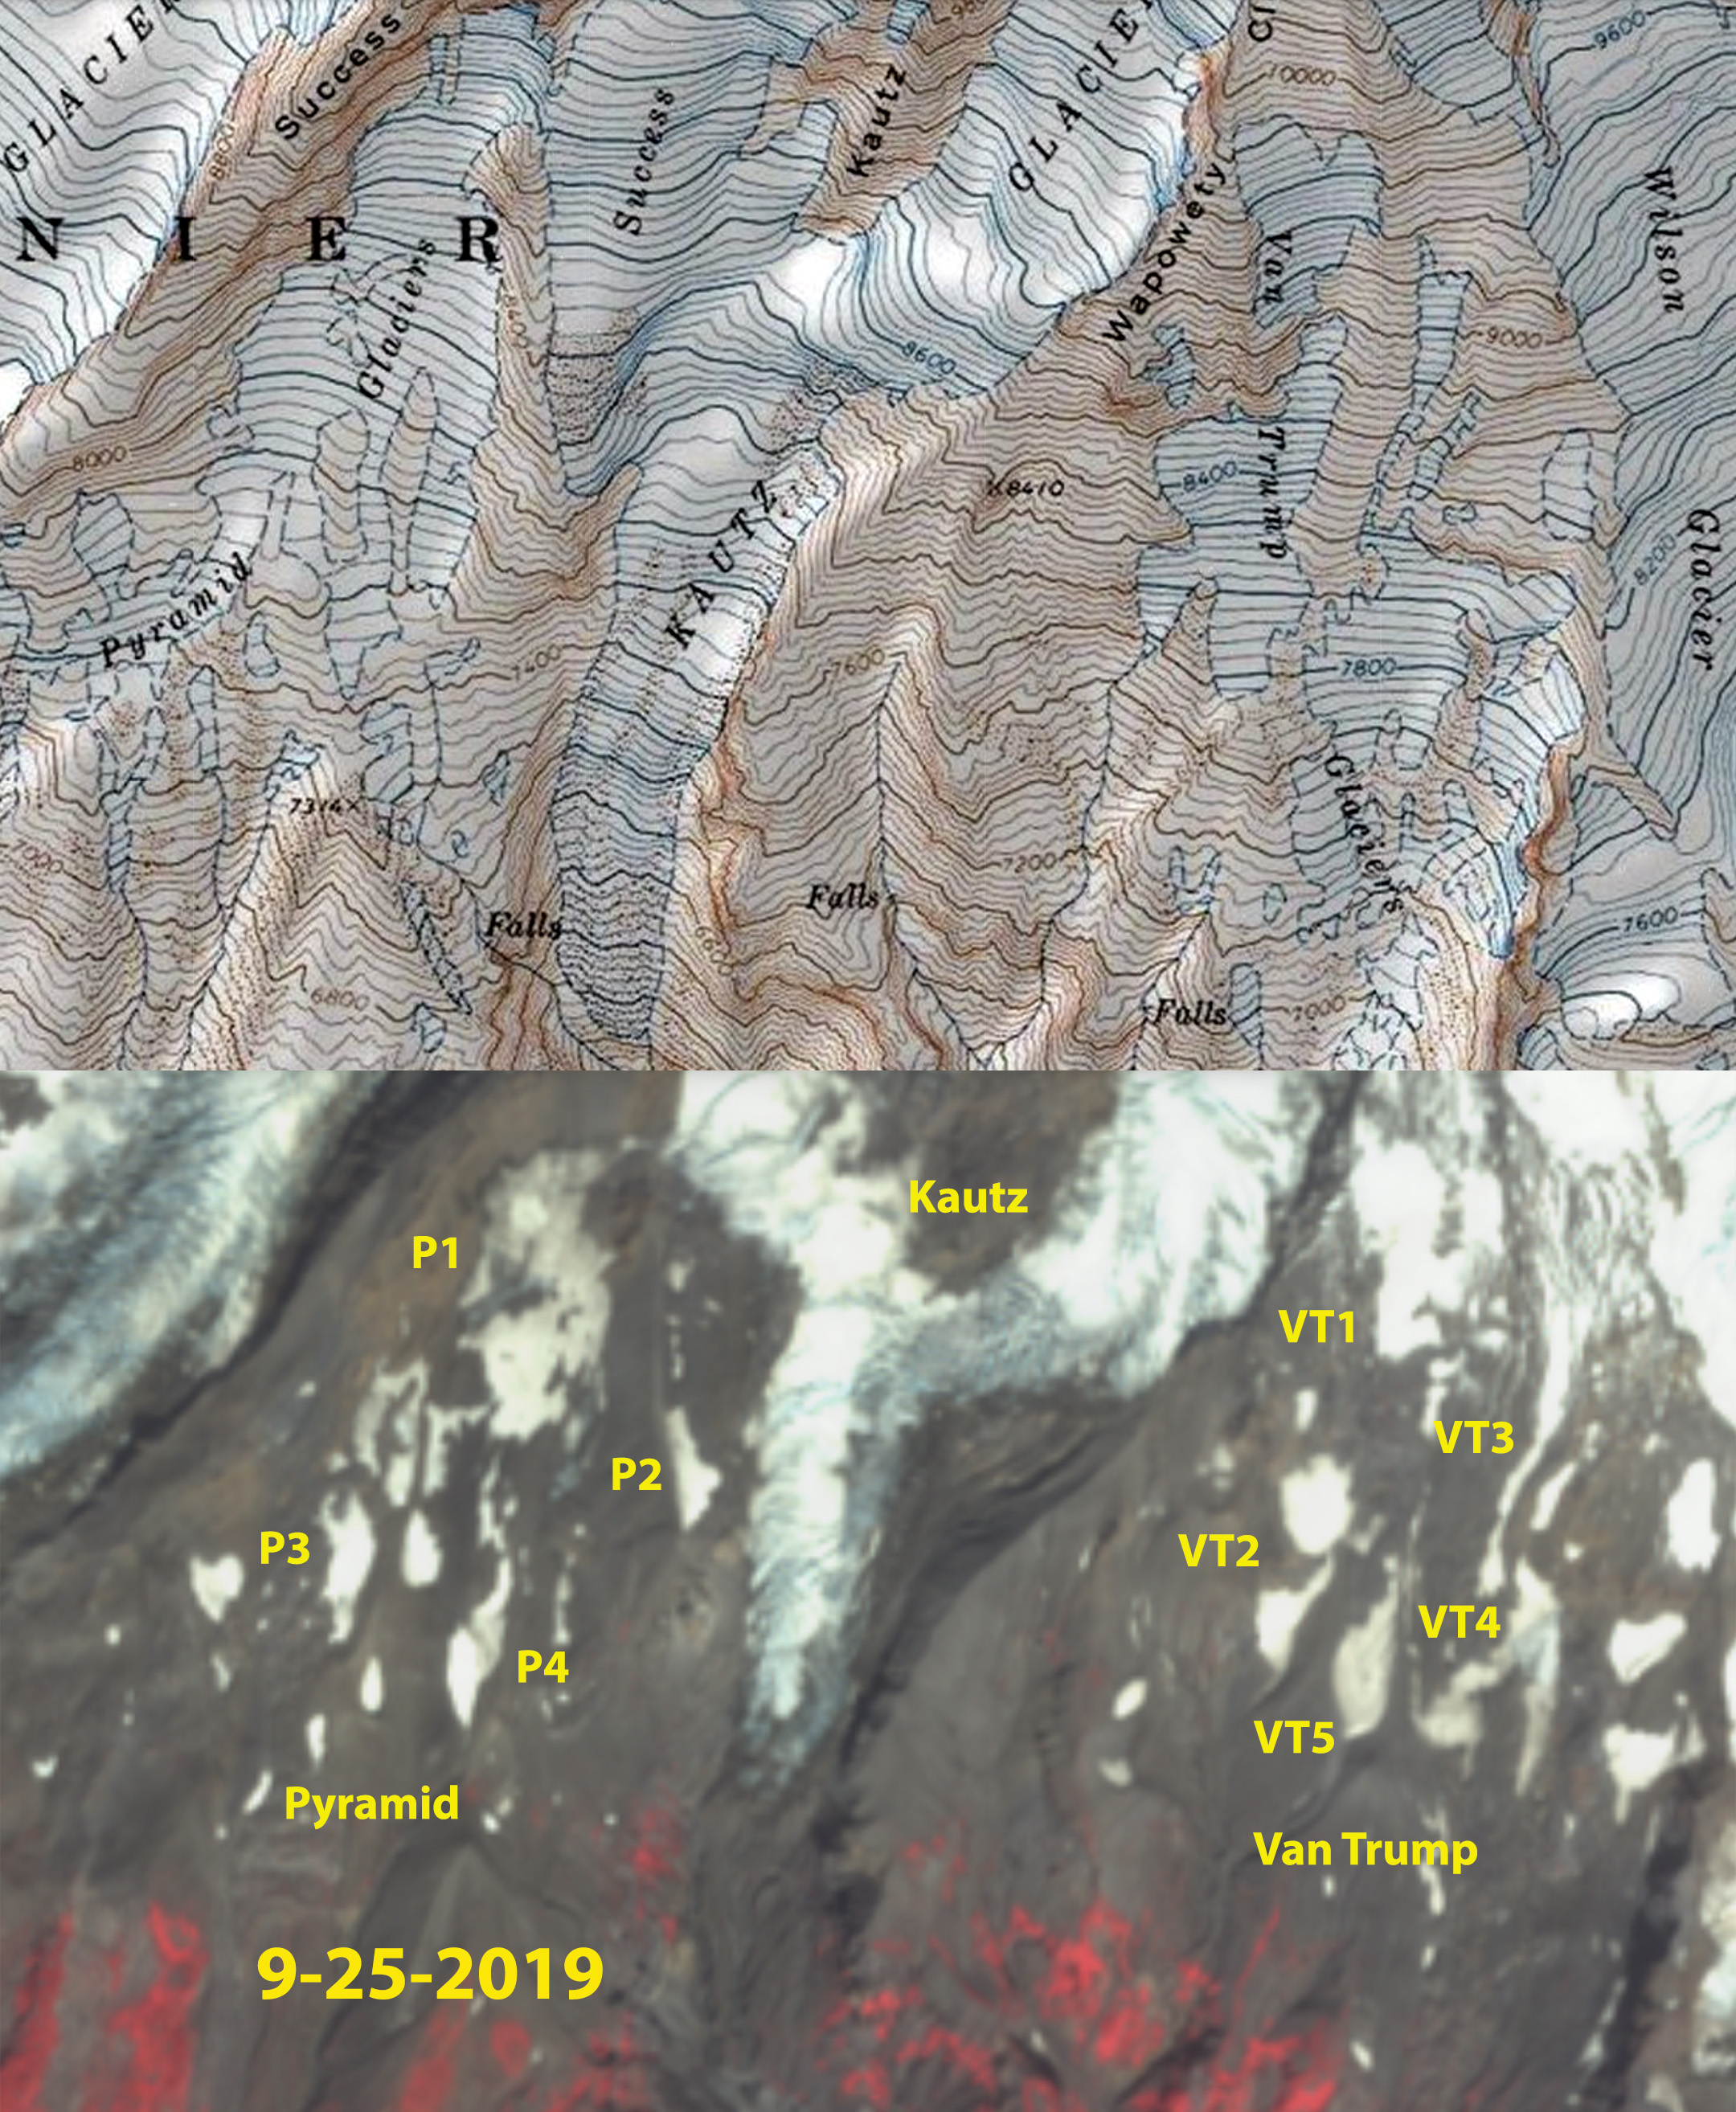 Van Trump (VT) and Pyramid (P) Snowfields Sept. 25, 2019 false color Sentinel image, with USGS map above.