Klippi Glacier Retreat Causes Separation, British Columbia

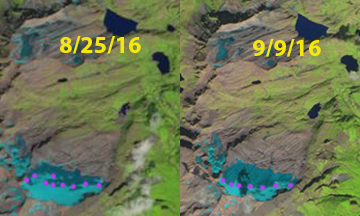
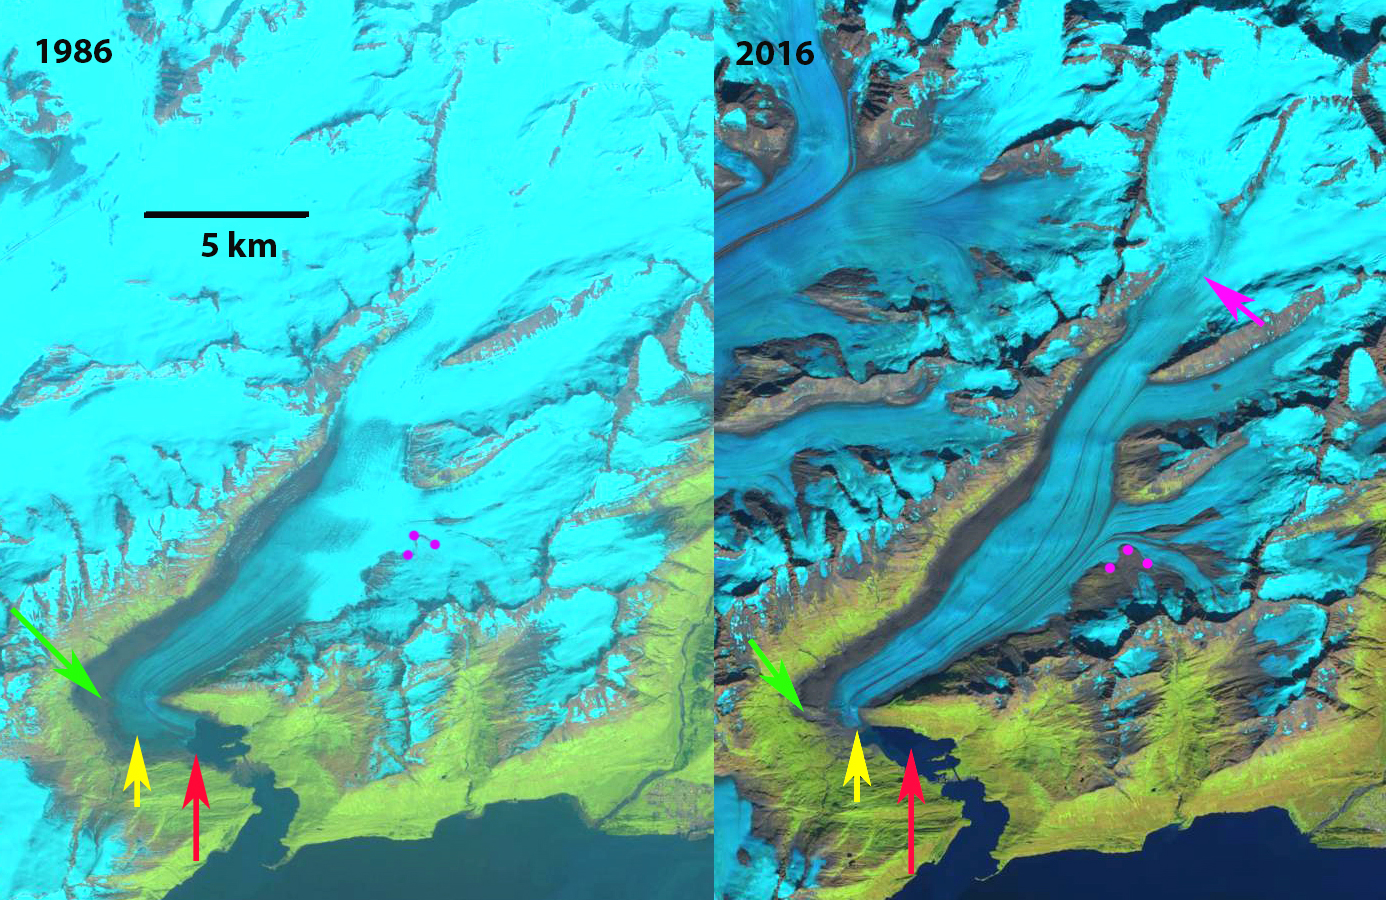
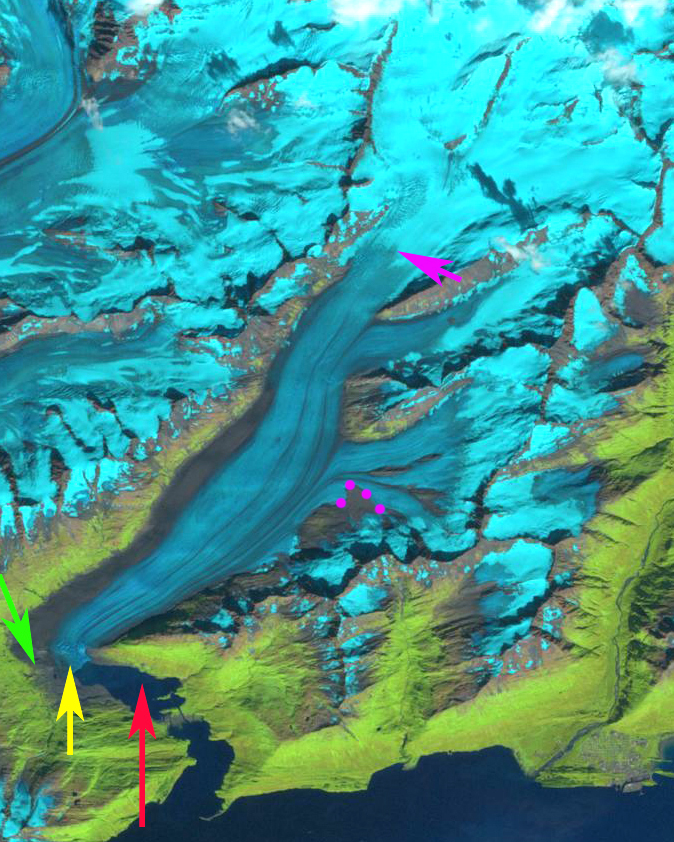
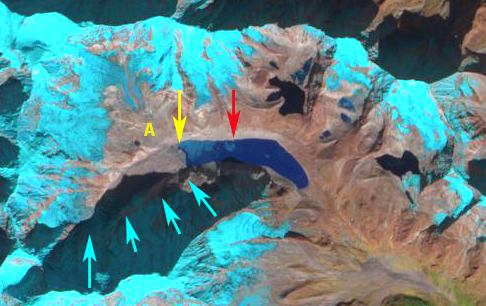
Klippi Glacier in Landsat images of 1987 to 2016. Red arrows indicate 1987 terminus, yellow arrows 2016 terminus and purple dots the transient snowline. 

The glacier beings at 2600 m sharing a divide with Klinaklini Glacier, flowing northwest from Silverthrone Mountain and terminating at  1040 m in 1987. Klippi Glacier drains into the Machmell River, Owikeno Lake and then River Inlet on the British Columbia Coast. The Machmell River is an important spawning area in its lowest 20 km, particularly for sockeye salmon, with chinook, coho, pink and chum salmon also present  The Machmell River is accessible to anadromous fish to the cascades just downstream of junction with Pashleth Creek, where runoff from the Pashleth Glacier enters (Hillaby, 1998).  The Rivers Inlet sockeye stock is the second largest in BC and has recently received much attention because of a dramatic decline in total abundance from the 1980s.  In the 1980’s Machmell River escapement numbers averaged 20,000, dropping to 5000 in the 1990’s  (Rutherford et al 1998).  This has led to an ecosystem study by UBC and SFU  of Rivers Inlet. Rivers Inlet in the 1970’s began to experience sockeye population  decline. Harvest rates were reduced in the 1980’s and the commercial fishery closed in 1996.  In 1999 the  stock reached a record low of ~ 3600 fish, just 0.1% of historic levels (Rivers Inlet Ecosystem Study). The commercial fishery has remained closed since 1996, with  a small amount of fishing permitted by the Wuikinuxv First Nation for cultural purposes, the stock has not recovered.

Here we examine the response of this glacier to climate change from 1987-2016 using Landsat imagery. In 1987 Klippi Glacier’s two main tributaries joined 1.8 km from the terminus, red arrow in each image.  The transient snow line was at 1800 m, purple dots.   By 1995 the glacier had retreated 750 m but still had a joined terminus. The transient snowline remained close to 1850 m.  In a 2012 Google Earth image the tributaries are still connected, but barely as a drainage stream has nearly isolated them.  The lower 800 m of both glaciers illustrate limited crevassing and significant downwasting. By 2016 the tributaries had separated with a retreat of  1400 m since 1987.  The transient snowline in 2016 was at 1900-1950 m. The glaciers will continue to retreat due to high snowlines in recent years with each of the last three years being above 1950 m by the end of the melt season.  The retreat here is similar to that of other valley glaciers in the region Jacobsen Glacier and Bridge Glacier.

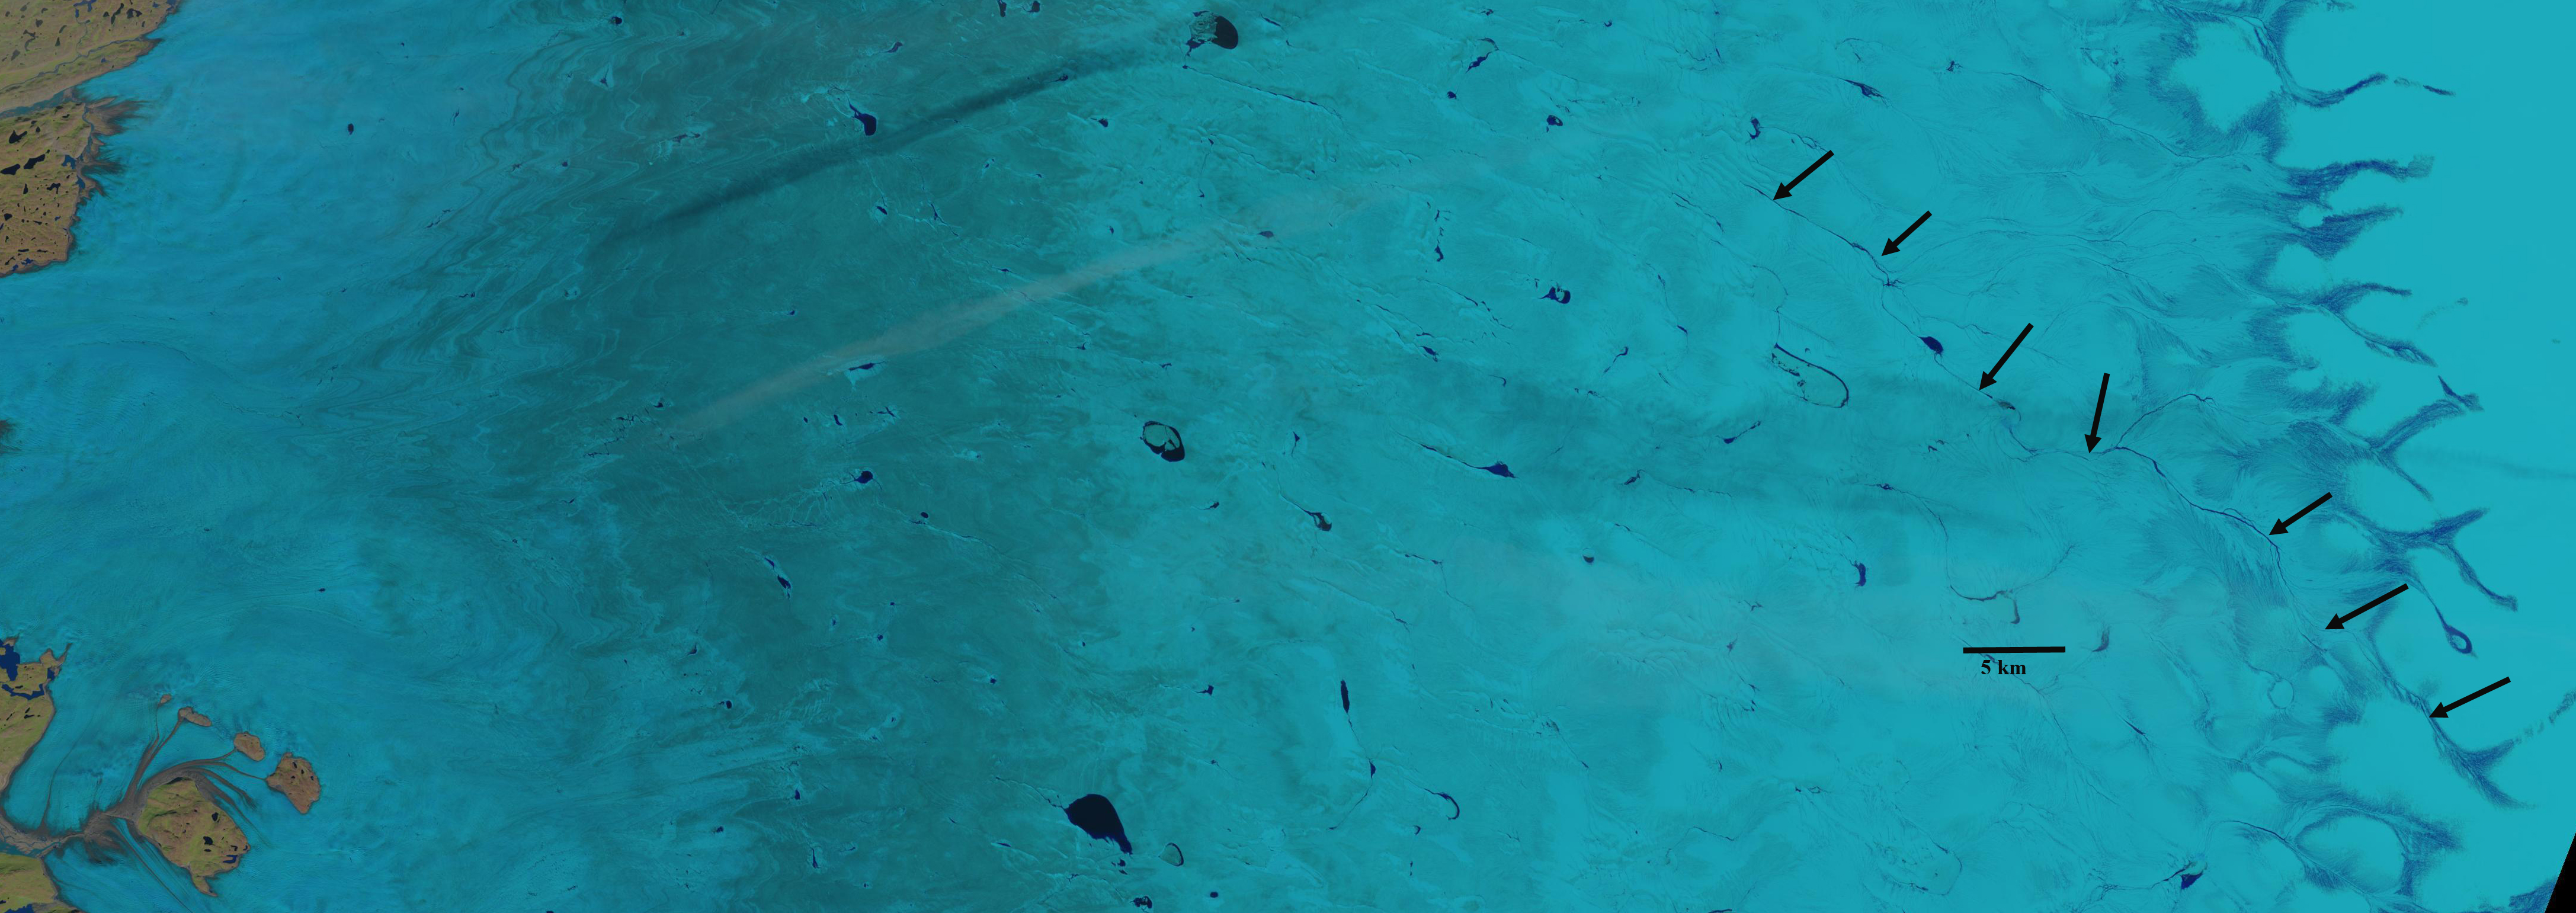
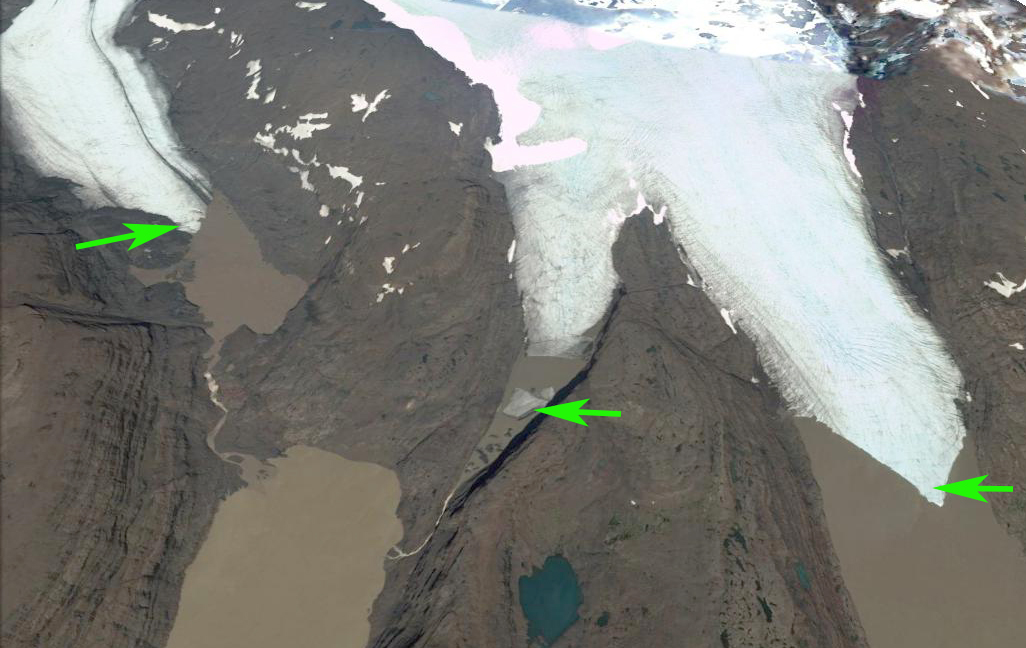
Map of the Klippi Glacier region reflecting the 1980’s terminus position of the glacier. Red arrows indicate 1987 terminus, yellow arrows 2016 terminus

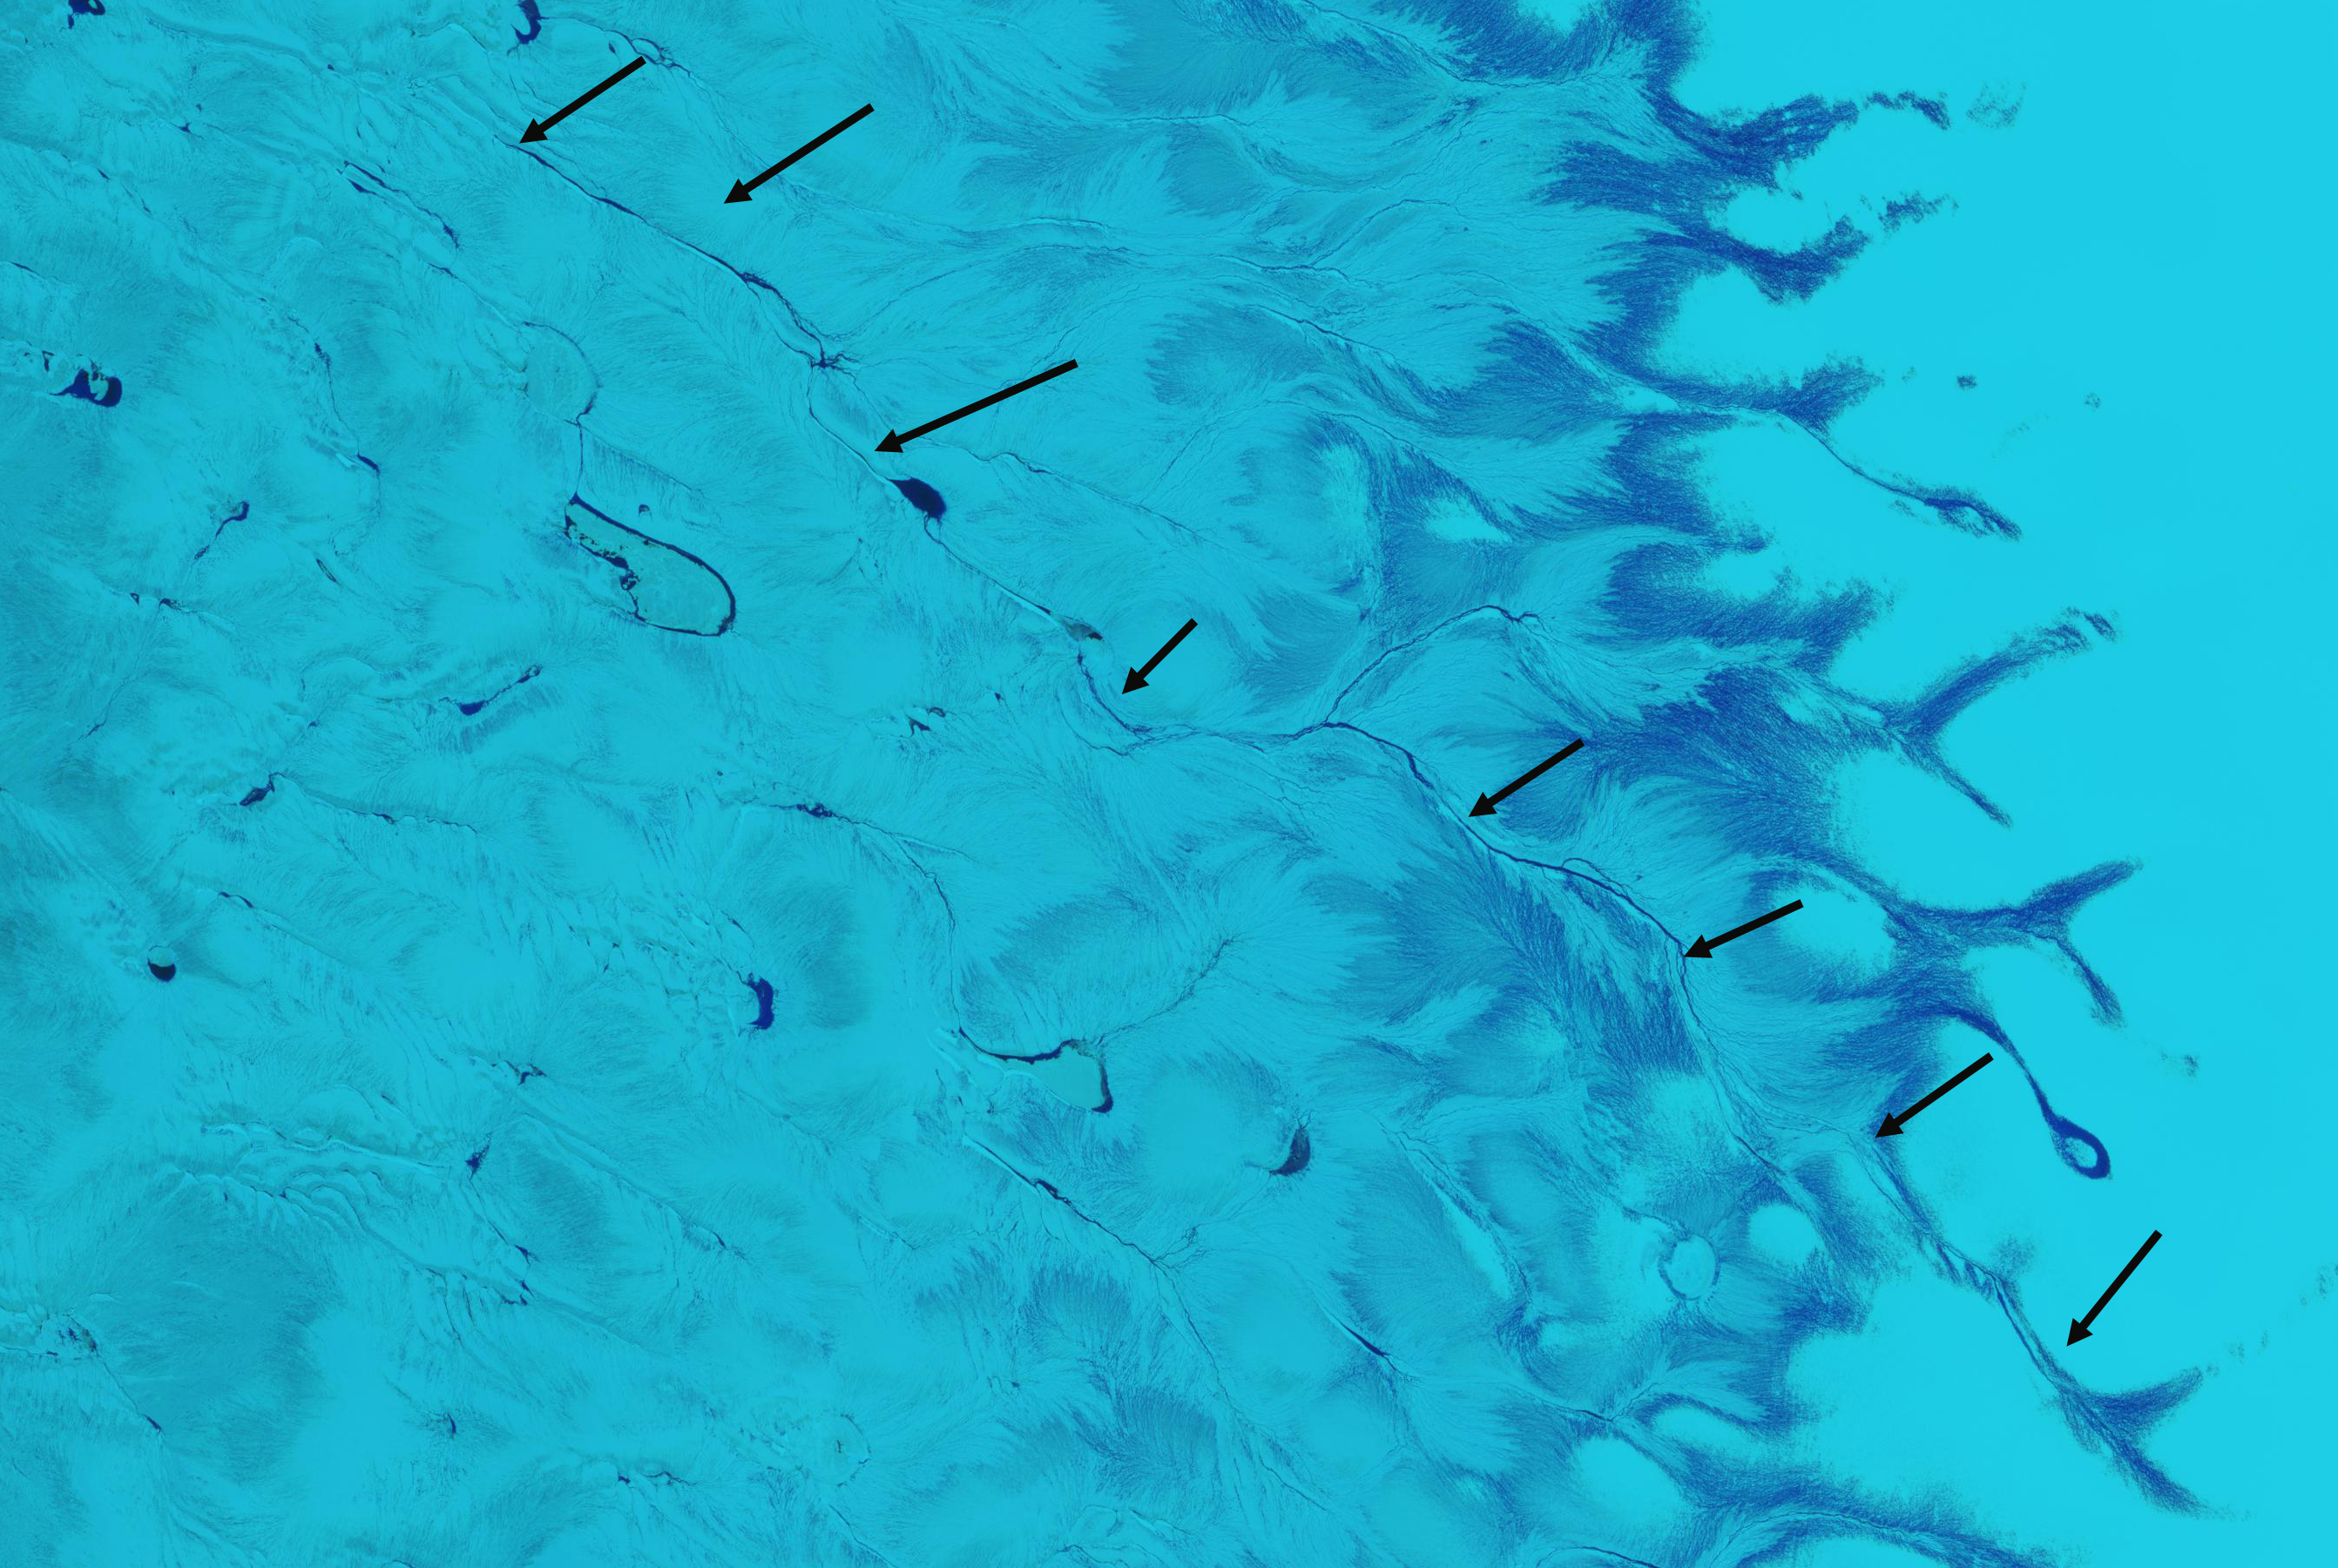
Klippi Glacier in Landsat image from 1995. Red arrows indicate 1987 terminus, yellow arrows 2016 terminus and purple dots the transient snowline. 

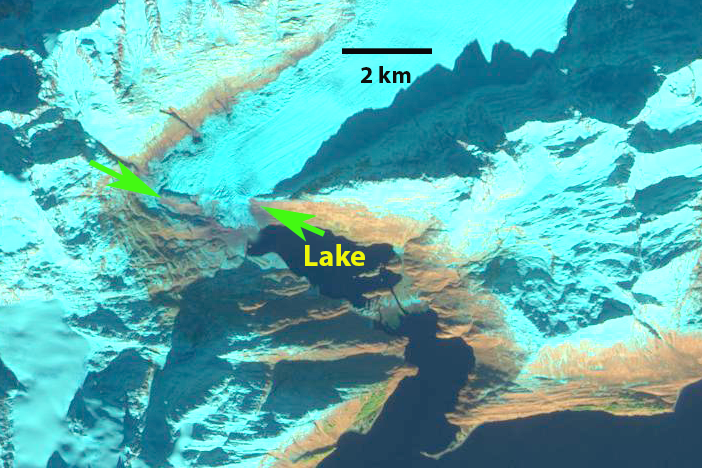
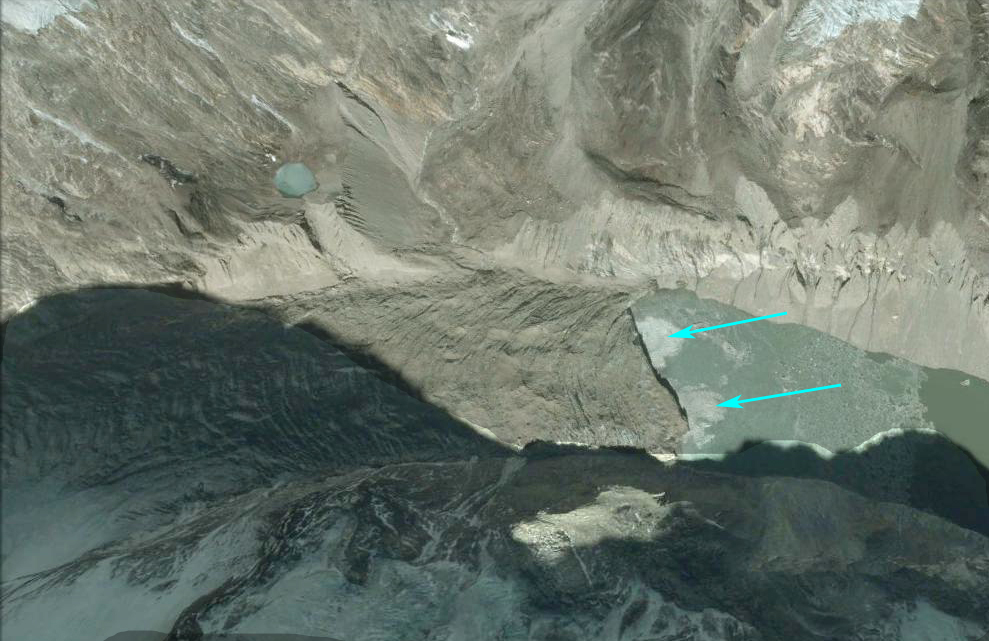
2012 Google Earth image of the terminus area of Klippi Glacier. Yellow arrow indicate 2016 terminus location. 

Cavagnoli Glacier, Switzerland Fading Away

Google Earth image of Cavagnoli in 2010 and a Sentinel 2 image from Sept. 9  2016.  Ice masses are numbered.  No retained 2016 snowpack, note the lighter colored snow on the upper Basodino Glacier

Cavagnoli Glacier (Ghiacciaio dei Cavagnöö) drains south into Lago dei Cavagnoli (Lago dei Cavagnöö), which is impounded by a dam that is 111 meters high.  The glacier like its neighbor Basodino Glacier  is in the Ticino River watershed and supplies the Robiei/Cavagnoli Hydropower system. The Cavagnoli Hydropower plant can provide 28 MW of power. The Swiss Glacier Monitoring Network noted that glacier area in 1973 was 1.36 square kilometers, when the glacier was a single ice mass.. The Swiss Glacier Monitoring Network has observed the annual retreat of this glacier since 1980, total retreat up through 2013 is 378 m of the main glacier.  The top of the glacier has also been retreating this is a symptom of a glacier that will not survive (Pelto, 2010). Huss and Fischer (2016) indicate that the majority of the small alpine glaciers, less than 0.5 square kilometers will disappear in the next 25 years.

This glacier has no accumulation zone in 2003, 2005, 2007 or 2010 Landsat and Google Earth imagery. The glacier itself by 2010 had separated into five separate ice masses that are each melting quickly away.  The glacier as viewed from below and from directly above in Google Earth Imagery indicates a thin glacier with few crevasses.This has become a reoccurring pattern for this glacier, and also is a sign of a glacier that cannot survive.   In 2010 Google Earth imagery the largest ice mass was 0.4 square kilometers and none of the ice masses appear destined to survive. In 2016 the Sentinel 2 image indicates there are four remaining ice masses, with a combined area of 0.3 square kilometers, with the largest ice mas now at less than 0.2 square kilometers.  There is no retained snowpack in the 2016 Sentinel image either. On the main ice mass there is a meltwater stream from the top to the bottom of the glacier indicating that even the top of the glacier is usually snow free by summer’s end. This glacier is a small relic of its former mapped extent.   The glacier will not persist, but is also an example that even small glaciers in poor health do not disappear quickly.

[ngg_images source=”galleries” container_ids=”47″ display_type=”photocrati-nextgen_basic_imagebrowser” ajax_pagination=”1″ template=”/nas/wp/www/sites/blogsorg/wp-content/plugins/nextgen-gallery/products/photocrati_nextgen/modules/ngglegacy/view/imagebrowser-caption.php” order_by=”sortorder” order_direction=”ASC” returns=”included” maximum_entity_count=”500″]


Basodino Glacier, Switzerland Mass Balance Loss & Hydropower

Basodino Glacier in August and September of 2016 illustrating the upward shift of the snowline in the 15 days between the Landsat (left) and Sentinel (right) image. purple dots mark snowline. 

Basodino Glacier is a small northeast facing slope glacier in the southern Swiss Alps.  The glacier is in the Ticino River watershed and supplies the Robiei Hydropower system. The glacier is in the same basin as Cavagnoli Glacier, which is fading away. The main branch presently covers an area of 1.8 km2 and extends from 2562 to 3186 m.  In 1973 the glacier had an area of 2.3 km2 .  Detailed mass balance investigations have been carried out since 1990.  During this period the glacier has lost more than 11 m w.e. thickness.  In seven years from 1980-2014 the glacier has had an AAR below 10 (Bauder, 2016).  This is indicative of minimal retained accumulation and not a consistent accumulation zone (Pelto, 2010) .  Huss (2012) noted that mean glacier mass balance in the European Alps was −0.31  m w.e./ year from 1900–2011, and −1 m w.e. /year over the last decade.  For Basodino Glacier the loss during this enite period averaged ~-0.2 m w.e./year (Huss, 2012).  The glacier advanced 95 m from 1967-1986 and has retreated 260 m since, front observations are completed and submitted by Claudio Vallegia of Ticino, Sezione Forestale (Swiss-ETHZ, 2016).

Water from glacier melt  is channelled to the Robiei-Zött reservoirs and hydro plants, generating enough electricity for a city. The Cavagnoli and Naret reservoirs at 2310 m feed the Robiei power station, situated 400 m below. The Robiei power station is also capable of pumping the water from the Robiei-Zött up to the higher Cavagnoli-Naret reservoirs.

Basodino Glacier in late August of 2016 had 5-60% of the glacier still in the accumulation zone. two weeks later on Sept. 9, 2016 the glacier had 35% of the glacier in the accumulation zone.  This is the accumulation area ratio, which needs to be above 55% for equilibrium.  For Basodino Galcier 2016 will be another year of mass balance loss and retreat.  The detailed monitoring will provide specific values for each reporting to the Swiss Glacier Monitoring Network system and the WGMS.

[ngg_images source=”galleries” container_ids=”48″ display_type=”photocrati-nextgen_basic_imagebrowser” ajax_pagination=”1″ template=”/nas/wp/www/sites/blogsorg/wp-content/plugins/nextgen-gallery/products/photocrati_nextgen/modules/ngglegacy/view/imagebrowser-caption.php” order_by=”sortorder” order_direction=”ASC” returns=”included” maximum_entity_count=”500″] 

Trinity-Wykeham Glacier Retreat, Causing Separation, Ellesmere Is. Canada

Trinity (T) and Wykeham (W) Glacier in 1999 and 2016 Landsat images.  Red arrow indicates 1999 margin, yellow arrow 2016 margin, yellow dots the actual ice front. 

Trinity (T) and Wykeham (W) Glacier flow east from Ellesmere Island into a fjord off of Nares Strait.  Until recently the two have been joined just before the terminus. Millan et al (2017) observed glaciers in the region.  They noted a change  in ice loss from Queen Elizabeth Islands glaciers, during the 1991–2005 mass loss was 52% from ice discharge and 48% from surface mass balance. During 2005–2014, the mass loss increased dramatically with 10% from ice discharge and 90% from surface balance losses. They reported that Trinity and Wykeham Glacier had a stable velocity from 1991-2009 and doubled in speed by 2015.  They noted a retreat of 1.8 km for Wyjkeham Glacier form 1991-2015 and 5 km for Trinity Glacier.  Here we examine Landsat imagery from 1999, 2002, 2004 and 2016 to identify changes in the two glaciers.

In 1999 the two glaciers are joined with a 14 km long ice front.  The ice front of Trinity to the North extends to an outlet glacier entering the fjord from the north.  The southern margin of the joint front extends 4 km beyond a mountain marking the southern entrance to what will be Wykeham Fjord (SW).  In 2002 there is little change in the icefront.  By 2004 Trinity Glacier has retreated 4 km along the northern edge and 5 km on the southern edge, now terminating at the eastern end of a ridge marked (MR).  Wykeham Glacier has experienced a minor retreat.  From 2004 to 2016 there is little change in the front of Trinity Glacier, while Wykeham Glacier has retreated  1.5 km along the southern margin.  This illustrates the substantial ice discharge loss before 2004 of the two glaciers and limited ice discharge net loss after 2004, as Millan et al (2017) noted. The strong surface mass balance losses of recent years has led to thinning, which should drive further retreat. The two glacier will enter their own developing fjords. In 2016 it is evident that the melt area extends quite high on the glacier, bottom image.  Melt ponds extend up to at least 800 m, purple arrows.  The acceleration in 2015 if it continues will deliver a much higher flux further reducing volume and driving retreat.  We have seen this pattern of  thinning, acceleration and retreat on many glaciers typically driven by greater surface melt and frontal/basal melt, depending on flotation. The retreat here is similar to that of Mittie Glacier also on Ellesmere Island.

Trinity (T) and Wykeham (W) Glacier in 2002 Landsat image.  Red arrow indicates 1999 margin, yellow arrow 2016 margin, yellow dots the actual ice front. 

Trinity (T) and Wykeham (W) Glacier in 2004 Landsat image.  Red arrow indicates 1999 margin, yellow arrow 2016 margin, yellow dots the actual ice front. 

Trinity (T) and Wykeham (W) Glacier in 2016 Landsat image.  Red arrow indicates 1999 margin, yellow arrow 2016 margin, yellow dots the actual ice front and purple arrows melt ponds. 

A River Runs 40 km Across the Greenland Ice Sheet

Supraglacial stream, on July 26, 2016 Landsat image, stretching 40 km across the ice sheet from the transient snowline, which marks the boundary between the percolation zone and the wet snow zone,  west toward the ice sheet margin, note black arrows.  

The Greenland Ice Sheet has experienced a significant increase in surface melt.  This is due both to warmer temperatures and enhanced melt due to a reduction in reflectivity-albedo. The expansion in melt area, duration and intensity (NSIDC, 2015)  has also generated large volume of meltwater transported via supraglacial streams.  Recent work by Tedesco et al (2016) and Kintisch et al (2017) illustrate three key reasons for the albedo change in the melt zone.

1) Upon melting and refreezing, ice crystals lose their branched shape, grow larger and rounder, which reduces the reflectivity of the snow by as much as 10%.

2) Satellite data show that the margins of the ice sheet have darkened by as much as 5% per decade since 2001. Dust trapped over the centuries has become concentrated at the melting edge of the ice sheet.

3)   The combination of algae and bacteria with dust generates a sludge—known as cryoconite. This dark material gathers in depressions decreasing albedo. Black and Bloom is a project focused on how dark particles (black) and microbial processes (bloom) darken and accelerate the melting of the Greenland Ice Sheet

Tedesco et al (2016) noted the negative trend in albedo is confined to the regions of the ice sheet that experience summer melting. They also observed no trend during the 1981–1996 period. Their analysis indicates the albedo decrease is due to the combined effects of increased air temperatures, which enhances melt promoting growth in snow grain size and the expansion of bare ice areas, and to increasing concentration of dark impurities on ice surfaces. Kintisch et al (2017) noted the same mechanisms with warmer summers also enhancing microbes and algae growth on the wetter surface of the ice, producing more cryocontie, that reduces albedo absorbing more solar energy. Cryoconite is more spatially limited than the other mechanisms. They also observed that soot and dust that blow in from lower latitudes and darken the ice are also increasing.

The darker surface enhances melt which generates more meltwater largely drained in the melt zone by supraglacial streams. Smith et al (2015) documented the surface drainage in the ablation zone of the southwest GIS. They focused on documenting the distribution of over 500 high order stream channel networks in a 6812 square kilometer region, inland from Kangerlussuaq.  All of the stream networks terminated in moulins before the ice sheet edge (NASA, 2015).  This indicates that moulins are common, important and sparse.

Poinar et al (2015) observe the longest streams in the 30-50 km range. Here we examine two streams one in detail using Google Earth that is 30 km long and a 40 km long surface stream in 2016 observed in Sentinel 2 and Landsat images. That the surface rivers can travel this distance across the surface before draining via a moulin indicates that the glacier is not structurally like Swiss cheese (Pelto, 2015).  The Google Earth detailed view illustrates both the darker surface, the maturity and hydrologic efficiency of the thermally incised meltwater streams.

The stream observed in Google Earth in its mid-reach has an average of 15 m in width.  The slope of the ice sheet is 1/120 in this region, with the river beginning at 1320 m and ending at 1070 m.  Gleason et al (2016) examined numerous supraglacial streams and noted that supraglacial streams with a width of 15-20 m and slopes of 1/100 to 1/200 had a depth of 1.5-2.0 m and velocity of ~0.5 m/sec.  This suggests the stream here has a discharge  of 7-10 cubic meters per second. The darkness of the ice surface indicating a low albedo is also apparent.  The ice is not nearly as dark when standing directly on it as it is in the macro-scale.

[ngg_images source=”galleries” container_ids=”52″ display_type=”photocrati-nextgen_basic_imagebrowser” ajax_pagination=”1″ template=”/nas/wp/www/sites/blogsorg/wp-content/plugins/nextgen-gallery/products/photocrati_nextgen/modules/ngglegacy/view/imagebrowser-caption.php” order_by=”sortorder” order_direction=”ASC” returns=”included” maximum_entity_count=”500″]

The second stream is seen in a Sentinel  image from July 15 and a Landsat image from July 26. The black arrow indicate the stream that is 40 km long.  The stream extends from 110 km from the edge of the ice sheet to within 75 km. The stream begins near the transient snowline at 1650 m and ends near 1400 m, creating a slushy valley above the local percolation zone. The stream in early July flows through the wet snow zone. By the end of the July the lower section of the stream becomes a bare ice region, the upper remains in the  wet snow zone.

Supraglacial stream in mid-July Sentinel images stretching 40 km across the ice sheet from the transient snowline west toward the ice sheet margin. 


Shoup Glacier, Alaska Retreat, Thinning, Velocity Decline

Shoup Glacier comparison in 1986 and 2016 Landsat images.  The glacier retreated 1900 m in this interval.  Red arrow is 1986 terminus, yellow arrow the 2016 terminus, green arrow rock rib emerging from beneath glacier, purple dots a landslide deposit, and purple arrow the snowline.

Shoup Glacier is between the Columbia Glacier and Valdez draining from the Chugach Mountains in southern Alaska.  The glacier was a tidewater terminating glacier until 1953 (McNabb et al, 2014).  From 1985 to 2011 McNabb et al (2014) noted a 1.7 km retreat.  The retreat was enhanced by significant lacustrine calving in an expanding tidal lagoon.  Here we examine Landsat and Sentinel images from 1986-2016 to identify recent and potential future changes.

In 1986 the glacier extends to the red arrow in the midst of a tidal lagoo. The glacier is 2.5 km wide at the sharp bend in the glacier 2.5 to 3 km from the terminus, green arrow.  There is significant crevassing at this bend indicating an increase in slope.  There is an landslide/avalanche deposit near the junction with a tributary, purple dots.  By 2002 the glacier has retreated 1.5 km since 1986, the minor ice cliff at the terminus indicates the glacier ends in shallow water near the end of the tidal lagoon.  The glacier is now 2 km wide at the sharp bend.  The landslide deposit, purple dots,  has shifted little since 1986. The snowline is at 1200 m in 2002.  By 2016 the glacier has retreated an additional 400 m since 2002, 1900 m since 1986.  The glacier no longer terminates in the lagoon.  A bedrock rib at the sharp bend has been exposed and the glacier is only 500 m wide now and this bend is just 500 m from the terminus, green arrow.  A closeup of this rib in a 2016 Sentinel image indicates why the crevassing had occurred, it is also clear this is an extension of the ridge that runs east from the glacier.  This is a band of erosion resistant rock.  This suggests that a basin exists above the this bedrock rib/ridge and a new lake will form.  The glacier slope from the green arrow for the next 2 km upglacier is quite low 1/40, again indicative of a basin beneath the lower glacier.  There is an increase in crevassing 2 km above the current terminus,  suggesting another increase in surface slope and the probable limit of the basin.  In 2016 the snowline is at 1250 m.  The landslide deposit remains little changed since 2002, indicating a low velocity in this region.  Burgess et al (2013) indicates the velocity of the Shoup Glacier near the terminus is in the range of 100 m annually.  The tributary is clearly significantly less. The low velocity, thinning and retreat indicates the glacier is continuing to lose volume via surface melting, despite no longer calving as Larsen et al (2015) have indicated is the prime mechanism for ice loss.  The retreat of this glacier is similar to that of nearby Valdez Glacier.

Shoup Glacier comparison in 2002 Landsat image.  Red arrow is 1986 terminus, yellow arrow the 2016 terminus, green arrow rock rib emerging from beneath glacier, purple dots a landslide deposit, and purple arrow the snowline.

Shoup Glacier terminus in 2016 Sentinel 2 image.  Green arrows indicate rock rib. 

Sulmeneva Glacier Retreat from Lakes, Novaya Zemlya

Sulmeneva Glacier retreat in comparison of 1999 and 2016 Landsat images. Red arrow indicate the 1999 terminus position and yellow arrows 2016 terminus location. 

Sulmeneva Bay is on the west coast of Novaya Zemlya and is the southern most extent of the continuous glaciation that extends along the northern half of the island.  Here we examine an unnamed glaciers that terminates in a piedmont lobe near the shore of Sulmeneva Bay. The glacier flows south from a shared accumulation zone with glaciers of the Lednikovoye Lake area, which are retreating like all tidewater glaciers in northern Novaya Zemlya (LEGOS, 2006). The glacier in 1999 had a terminus front that measured 9.5 km.  Carr et al (2014) identified an average retreat rate of 52 meters/year for tidewater glaciers on Novaya Zemlya from 1992 to 2010 and 5 meters/year for land terminating glaciers.Here we use Landsat images to examine changes from 1999 to 2016.

The terminus of the glacier in 1999 terminates in three substantial and two smaller proglacial lakes, the three larger lakes were all 1 to 1.5 km across.  In 2000 the ablation season is further along and the lake levels somewhat higher, causing most of the expansion from 1999.  By 2015 the glacier has retreated from the easternmost lake, which has also expanded to 2 km long and 1.7 km wide.  In 2016 there is only a minor connection to the northeastern lake of the group that is now 2.1 km wide and 1.8 km long. Retreat of the terminus ranges from 600 m to 900 m along the terminus front that now measures 7.8 km, equating to an area loss of 4 square kilometers in the terminus lobe alone. A supralglacial lake has also formed at purple arrow in 2016 indicating substantial melting at an elevation of 400 m.

Red dots indicate the terminus of the glacier in 2000 Landsat.  

Yellow dots indicate the terminus in 2015 Landsat. 

State of Alpine Glaciers in 2016-Negative for 37th Consecutive Year

Figure 1. Global Alpine glacier annual mass balance record of reference glaciers submitted to the World Glacier Monitoring Service.

Each year I write the section of the BAMS State of the Climate on Alpine Glaciers.  What follows is the initial draft of that with a couple of added images and an added paragraph.

The World Glacier Monitoring Service (WGMS) record of mass balance and terminus behavior (WGMS, 2015) provides a global index for alpine glacier behavior.  Globally in 2015 mass balance was -1177 mm for the 40 long term reference glaciers and -1130 mm for all 133 monitored glaciers.  Preliminary data reported to the WGMS from Austria, Canada, Chile, China, France, Italy, Kazakhstan, Kyrgyzstan, Norway, Russia, Switzerland and United States indicate that 2016 will be the 37th consecutive year of without positive annual balances with a mean loss of -852 mm for reporting reference glaciers.

Alpine glacier mass balance is the most accurate indicator of glacier response to climate and along with the worldwide retreat of alpine glaciers is one of the clearest signals of ongoing climate change (Zemp et al., 2015).  The ongoing global glacier retreat is currently affecting human society by raising sea-level rise, changing seasonal stream runoff, and increasing geohazards (Bliss et al, 2014; Marzeion et al, 2014).  Glacier mass balance is the difference between accumulation and ablation.  The retreat is a reflection of strongly negative mass balances over the last 30 years (Zemp et al., 2015).  Glaciological and geodetic observations, 5200 since 1850, show that the rates of early 21st-century mass loss are without precedent on a global scale, at least for the time period observed and probably also for recorded history (Zemp et al, 2015). Marzeion et al (2014) indicate that most of the recent mass loss, 1991-2010 is due to anthropogenic forcing.

The cumulative mass balance loss from 1980-2015 is -18.8 m water equivalent (w.e.), the equivalent of cutting a 21 m thick slice off the top of the average glacier (Figure 2).  The trend is remarkably consistent from region to region (WGMS, 2015).  WGMS mass balance based on 40 reference glaciers with a minimum of 30 years of record is not appreciably different from that of all glaciers at -18.3 m w.e.  The decadal mean annual mass balance was -228 mm in the 1980’s, -443 mm in the 1990’s, 676 mm for 2000’s and – 876 mm for 2010-2016.  The declining mass balance trend during a period of retreat indicates alpine glaciers are not approaching equilibrium and retreat will continue to be the dominant terminus response. The recent rapid retreat and prolonged negative balances has led to some glaciers disappearing and others fragmenting (Figure 2)(Pelto, 2010; Lynch et al, 2016).

Below is a sequence of images from measuring mass balance in 2016 in Western North America from Washington, Alaska and British Columbia.  From tents to huts, snowpits to probing, crevasses to GPR teams around the world are assessing glacier mass balance in all conditions.

[ngg_images source=”galleries” container_ids=”7″ display_type=”photocrati-nextgen_basic_imagebrowser” ajax_pagination=”1″ template=”/nas/wp/www/sites/blogsorg/wp-content/plugins/nextgen-gallery/products/photocrati_nextgen/modules/ngglegacy/view/imagebrowser-caption.php” order_by=”sortorder” order_direction=”ASC” returns=”included” maximum_entity_count=”500″]

Much of Europe experienced record or near record warmth in 2016, thus contributing to the negative mass balance of glaciers on this continent. In the European Alps, annual mass balance has been reported for 12 glaciers from Austria, France, Italy and Switzerland. All had negative annual balances with a mean of -1050 mm w.e.  This continues the pattern of substantial negative balances in the Alps continues to lead to terminus retreat.  In 2015, in Switzerland 99 glaciers were observed, 92 retreated, 3 were stable and 4 advanced.  In 2015, Austria observed 93 glaciers; 89 retreated, 2 were stable and 2 advanced, the average retreat rate was 22 m.

In Norway, terminus fluctuation data from 28 glaciers with ongoing assessment, indicates that from 2011-15 26 retreated, 1 advanced and 1 was stable.  The average terminus change was -12.5 m (Kjøllmoen, 2016).  Mass balance surveys with completed results are available for seven glaciers; six of the seven had negative mass balances with an average loss of -380 mm w.e.

In western North America data has been submitted from 14 glaciers in Alaska and Washington in the United States, and British Columbia in Canada.  All 14 glaciers reported negative mass balances with a mean loss of -1075 mm w.e.  The winter of and spring of 2016 were exceptionally warm across the region, while ablation conditions were close to average.

In the high mountains of central Asia five glaciers reported data from Kazakhstan, Kyrgyzstan and Russia.  Four of five were negative with a mean of -360 mm w.e.  Maurer et al (2016) noted that mean mass balance in the eastern was significantly negative for all types of glaciers in the Eastern Himalaya from 1974-2006.

Figure 2. Landsat images from 1995 and 2015 of glaciers in the Clephane Bay Region, Baffin island.  The pink arrows indicate locations of fragmentation.  Glaciers at Point C and D have disappeared.


Cook Ice Cap Outlet Glacier Retreat Lake Fromation, Kerguelen 2001-17


Comparison of eastern outlet glaciers of the Cook Ice Cap in 2001 and 2017 Landsat images.  Red arrow indicates a location of tributary separation. Pink arrow the 2017 terminus location of the northernmost glacier. Orange arrow the 2017 terminus location of the middle glacier.  Yellow arrow tip the 2001 terminus position of glacier ending in newly formed lake.  Green arrow the southernmost glacier 2017 terminus location. 

On the east side of the Cook Ice Cap on Kerguelen Island a series of outlet glaciers have retreated expanding and forming a new group of lakes.  Here we examine the changes from 2001-2017 along using Landsat imagery. Retreat of glacier in the region was examined by Berthier et al (2009) and is exemplified by the retreat of Ampere Glacier.  Verfaillie et al (2016) examined the surface mass balance using MODIS data, field data, and models.  They identified that accelerating glacier wastage on Kerguelen Island is due to reduced net accumulation and resulting rise in the transient snowline since the 1970s, when a significant warming began.

In 2001 at the red arrow is where the north tributary of a glacier ending in the northern most lake joins the main glacier.  In the second lake is a peninsula, marked with point A that the glacier terminus is 1 km from. The next two glaciers terminating at the yellow arrow and beyond the green arrow do not have lakes at their termini.  By 2014 the northern tributary has lost its connection with the main glacier terminating in the lake. The distance from the island for the middle glacier has increased.  A lake is forming at the yellow arrow. For the third glacier a lake has formed at the green arrow. In 2017 the northern glacier has retreated to the pink arrow a distance of  750 m and is no longer terminating in the lake. The terminus at the orange arrow has retreated  main terminus has retreated 900 m, expanding the lake it terminates in.   The glacier at the yellow arrow has retreated into a new lake basin, with a retreat of 850 m since 2001. The terminus is thin and in the Google Earth image indicates some substantial thin icebergs have separated from the glacier. The green arrow marks the 2017 terminus of the southern most lake. This glacier has retreated 950 m leading to the continued expansion of a new lake.  In just a decade we see the formation of two new lakes and the expansion of two others at the terminus of the eastern outlet glaciers of Cook Ice Cap, rapid landscape change driven by climate change.

2014 Landsat image of the eastern outlet glaciers of Cook Ice Cap.Red arrow indicates a location of tributary separation. Pink arrow the 2017 terminus location of the northernmost glacier. Orange arrow the 2017 terminus location of the middle glacier.  Yellow arrow tip the 2001 terminus position of glacier ending in newly formed lake.  Green arrow the southernmost glacier 2017 terminus location. 

Terminus of three outlet glaciers from left to right the green arrow, yellow arrow and orange arrow terminus glacier on the Landsat images.  The green arrows indicate places where the terminus or icebergs illustrates how thin the glacier ice is. 

Lumding Glacier Rapid Retreat, Nepal 1992-2016

Landsat comparison of Lumding Glacier terminating in Lumding Tsho. Red arrow on each Landsat image indicates 1992 terminus and yellow arrow 2016 terminus location.

Lumding Glacier, Nepal terminates in Lumding Tsho, a proglacial lake, in Dudh Khosi Valley in the Mount Everest region of Nepal. This lake poses a hazard for a glacier lake outburst flood in the Dudh Khosi valley. The lake expansion results from retreat of the Lumding Glacier. International Centre for Integrated Mountain Development (ICIMOD) study examined the changes in Lumding Tsho from 1962-2000 and found the lake grew from 0.2 km2 in 1962 to 0.77 km2 in 2000. ICIMOD has an ongoing specific focus on assessing glacier lake outburst flood potential. The lake growth was the result of a retreat of 40 meters/year from 1976-2000 and 35 meters/year from 1962-2007, as noted in figure below from Bajracharya  & Mool (2009). Here we update the changes to 2016 using Landsat imagery.

The lake begins at the end of the heavily debris covered Lumding Glacier draining east from Numbur Himal . Red arrow on each Landsat image indicates 1992 terminus and yellow arrow 2016 terminus location. The lake was 1675 meters long in 1992, 1950  meters long in 2000, 2350 meters long in 2009 and 2800 meters in 2016. This 1100 m retreat in 25 years is a retreat rate of 45 meters/year. The lake at 2.8 km in length now has an area of over 1 square kilometer. The glacier is fed largely by avalanching off the flanks of Numbur, blue arrows. King et al (2017) noted a mean mass balance of all 32 glaciers examined in the Mt. Everest region from 2000-15 was  −0.52  water equivalent per year. The mean mass balance of nine lacustrine terminating glaciers, like Lumding Glacier, was 32 % more negative than land-terminating debris-covered glaciers.  An additional problem for the glacier in the future is the retreat of the terminus of the tributary glaciers that avalanche onto the lower Lumding Glacier. The yellow letter A in the 2016 Sentinel images indicates the retreat of a feeder glaciers, 300 m since 1992.  The lower section of the Lumding Glacier is heavily debris covered, noted best in Google Earth image, which insulates the underlying ice, reducing melting and retreat. This also indicates the avalanche source of much of the accumulating snow and ice. The increased distance to the feeding snow and ice slopes will reduce this input.  The two blue arrows indicate plumes of glacier runoff into the lake.  This glacier loss in mass driving the retreat is like that on Hinku Nup Glacier and Middle Lhonak Glacier

A 2016 Sentinel image of Lumding Glacier with avalanche paths shown by blue arrows, and retreating tributary above Point A.

Google Earth image of Lumding Glacier front.  This illustrates the debris cover and also meltwater plumes entering lake. 

Recent Climate Change Impacts on Mountain Glaciers-Mauri Pelto

Book Description:

Recent Climate Change Impacts on Mountain Glaciers-Mauri Peltocover

Glaciers are considered a key and an iconic indicator of climate change. The World Glacier Monitoring Service has noted that global alpine balance has been negative for 35 consecutive years. This highlights the dire future that alpine glaciers face.

The goal of this volume is to tell the story, glacier by glacier, of response to climate change from 1984-2015. Of the 165 glaciers examined in 10 different alpine regions, 162 have retreated significantly. It is evident that the changes are significant, not happening at a “glacial” pace, and are profoundly affecting alpine regions. There is a consistent result that reverberates from mountain range to mountain range, which emphasizes that although regional glacier and climate feedbacks differ, global changes are driving the response. This book considers ten different glaciated regions around the individual glaciers, and offers a different tune to the same chorus of glacier volume loss in the face of climate change. Below are some sample image pairs all Landsat images from the book.  The red arrow indicates the earlier terminus, yellow arrow later terminus position and purple arrows upglacier thinning.

I continue to post two blogs a week on glaciers at https://glacierchange.blog/

Continue reading “Recent Climate Change Impacts on Mountain Glaciers-Mauri Pelto”

Hinku Nup, Nepal Downwasting Lake Development

Hinku Nup Glacier in November 2016 Sentinel 2 image.  Yellow arrows indicate three supraglacial lakes that have formed.  

Hinku Nup is a valley glacier in the Dudh Khosi basin in the Mount Everest region of Nepal.  The glacier is heavily debris covered in its lowest 4 km which is a low slope section extending from 5100-4900 m.  In 1992 Landsat images there are only small supraglacial lakes, less than 100 m across on the glacier surface.  In 2000 this remains the case on Hinku Nup proper, though a lake has formed at the terminus of a former tributary, northwest yellow arrow.  By 2013 a lake has formed at the junction of Hinku Nup and Hinku Shar Glacier and a lake near the terminus of the glacier.  By 2016 the terminus lake has expanded to a length of 600 m.  There are a series of lakes that appear ready to coalesce that will extend the lake to 800 m in length, smaller yellow arrow.  The lake at the junction of Hinku Nup and Hinku Shar is 200 m across in 2016.  The proglacial lake at the terminus of the former tributary to Hinku Nup is now 500 m wide and 400 m long.  The coalescing of the lakes near the terminus will lead to the formation of lake large enough to enhance melting and lead to calving.  This should lead soon to a rapid retreat of the terminus, such as occurred on nearby Lumding Glacier.  Glacier lakes have been inventories by ICIMOD, who found little change in glacier lake area from 2001 to 2009 but a sharp decrease in the number of lakes, primarily due to coalescing.  The lake here lacks the clearcut moraine dam that exists on Thulagi Glacier and typifies glaciers that pose a Glacier lake outburst flood hazard.

King et al (2017) noted a mean mass balance of all 32 glaciers examined in the Mt. Everest region from 2000-15 was  −0.52  water equivalent per year. The mean mass balance of nine lacustrine terminating glaciers was 32 % more negative than land-terminating, debris-covered glaciers.  This mass loss is what has been driving the widespread glacier retreat in the region.  Bajracharya and Mool (2009) noted the glaciers in the Mount Everest region retreated at a rate of 10–59 m/year from 1976-2009.

[ngg_images source=”galleries” container_ids=”9″ display_type=”photocrati-nextgen_basic_imagebrowser” ajax_pagination=”1″ template=”/nas/wp/www/sites/blogsorg/wp-content/plugins/nextgen-gallery/products/photocrati_nextgen/modules/ngglegacy/view/imagebrowser-caption.php” order_by=”sortorder” order_direction=”ASC” returns=”included” maximum_entity_count=”500″]