
The above video looks at the effort behind a long term field study, looking at images from 11 of the 30 years of our research, digital cameras became good then. Long term monitoring programs have until recently been unattractive for federal grantmakers, since they are not directly advancing the frontiers of science. However, many long duration time series from monitoring programs do advance science eventually as the response to changes in environmental or climate conditions are documented. In 1984, I responded to a request from the US National Academy of Sciences, “to monitor glaciers across an ice clad mountain range”, something that was not being done anywhere in Norther America. Thirty years later we are still pursuing this project. We have developed a 30 years time series of glacier mass balance on glaciers across the North Cascades of Washington. To ensure that the program could be sustained, we did not pursue any federal funding for the project. The data we, collect is submitted to the World Glacier Monitoring Service (WGMS) each year, the regional time series built in the North Cascade is just part of the contribution to the global glacier mass balance time series at WGMS. The cumulative North Cascades glacier mass balance record is in fact quite similar to the cumulative global mass balance time series. For the globe there have been 22 consecutive years of negative mass balance, that is the reality of the impact of global warming on mountain glaciers around the globe. The impact on the glaciers of Mount Baker was recently published Pelto and Brown (2012)

Bromley Glacier Retreat, NW British Columbia
Bromley Glacier is the largest outlet glacier of the Cambria Icefield near Stewart, BC. The glacier drains north into the Bear River.  Dan Smith and his graduate students of the University of Victoria have been busy searching for fossil wood as it emerges from beneath the rapidly retreating glaciers of British Columbia. They have found numerous pieces from former forest that have emerged in the last decade after being buried for at least 2000 years. Smith, points out this is due to the rapid retreat that began in the area in the 1980’s. Bolch et al (2010) noted a reduction of 0.3% per year in glacier area in the Northern Coast Mountains of British Columbia from 1985 to 2005. Scheifer et al (2007) noted an annual thinning rate of 0.8 meters/year from 1985-1999. One of the glacier they visited was Bromley Glacier in 2011. This led to a publication from Smith and Kira Hoffman (Hoffman and Smith, 2013) that found periods of glacier expansion at ca. 2470–2410, 1850, 1450, and 830 years BP.
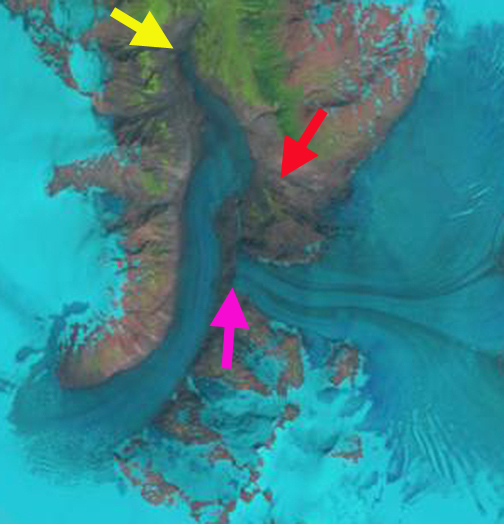
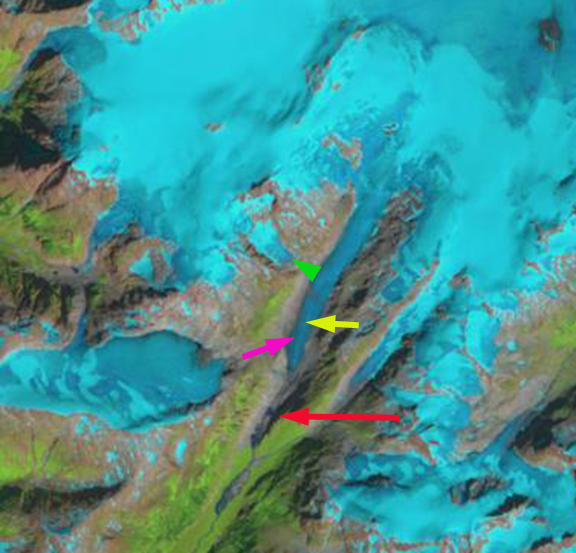
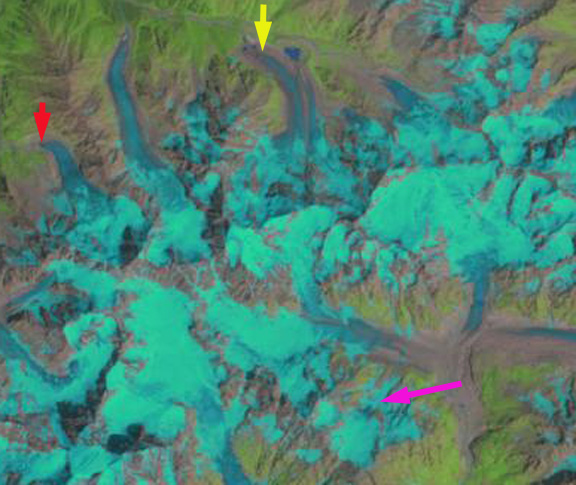
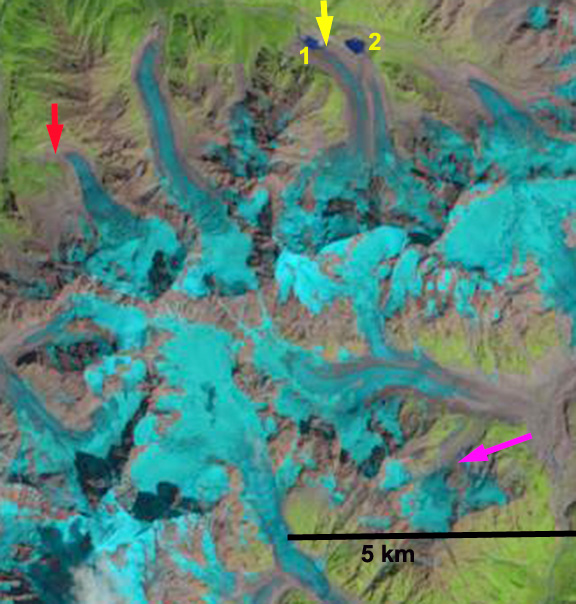
Here we examine satellite imagery from 1986, 1997, 2010 and 2013. The yellow, red, and green arrows indicate the same location in each image. In 1986 as in the map the Bromley Glacier was comprised of three large glacier tributaries, two flowing from the east red and pink arrow and from due south. In 1986 the eastern tributaries still contributed directly to Bromley Glacier. The terminus was at the lime green arrow, 500 meters beyond a side valley on the west marked by the yellow arrow. In 1997 the tributary at the red arrow is no longer feeding the Bromley Glacier while the tributary at the pink arrow connection has narrowed. The terminus has retreated 200 m since 1986, but still rounds the bend heading northeast. In 2010 the separation at the red arrow is greater than 1 kilometer. The pink arrow tributary is also no longer in contact with Bromley Glacier. The terminus has retreated to the yellow arrow, a 700 m retreat since 1986. The lower 500 meters of the glacier are narrow and thin. By 2013 the glacier has retreated to the dark green arrow, an additional 500 m since 2010 and 1200 m since 1986. The red tributary has retreated 1400 meters from Bromley Glacier and the pink arrow tributary 250 m from Bromley Glacier.
The loss of contributions from two of the three main tributaries will spur continued extensive retreat of the glacier. The snowline of the main glacier has been at close to 1600 m in the imagery here, too high for anything but a very negative mass balance. This retreat is similar to that of nearby Chickamin Glacier, Porcupine Glacier and Nass Peak Glacier. There is an exceptional photo gallery provided by the Tree Ring Lab at University of Victoria, the album does not get to the Cambria Icefield and Bromley Glacier until image 123, though images 65-68 have excellent examples of fossil trees. Figure 2 from Hoffman and Smith (2013) is below. This is in the area rendered ice free by the retreat of the red arrow tributary since 1986. 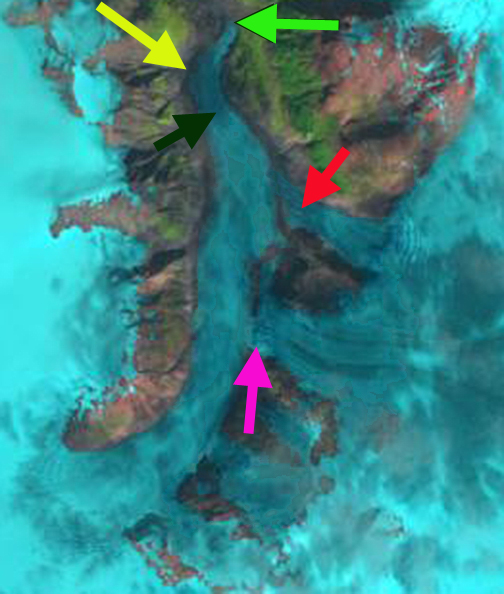
1986 Landsat image

1997 Landsat image
2010 Landsat Image

2013 Landsat image
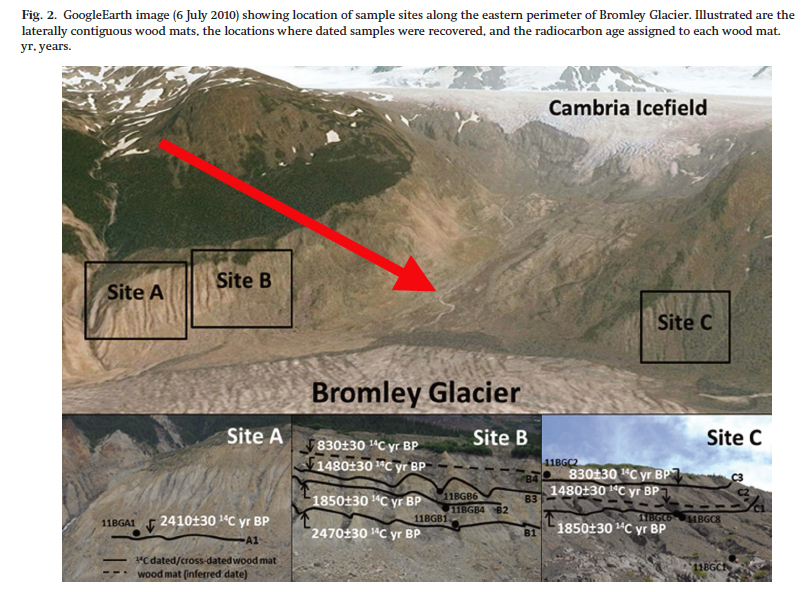
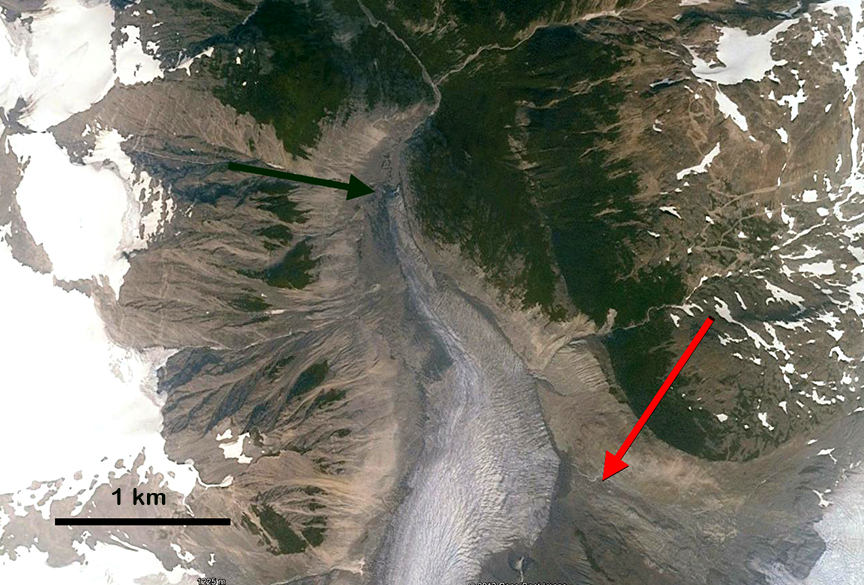
Figure 2 from Hoffman and Smith (2013) of red arrow tributary that was connected to Bromley Glacier in 1986, this is a 2011 image.
Google Earth image 2010
Nass Peak Glacier Retreat, Coast Mountains, British Columbia
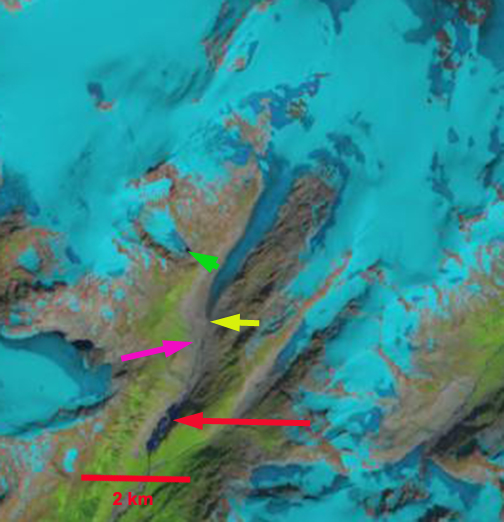
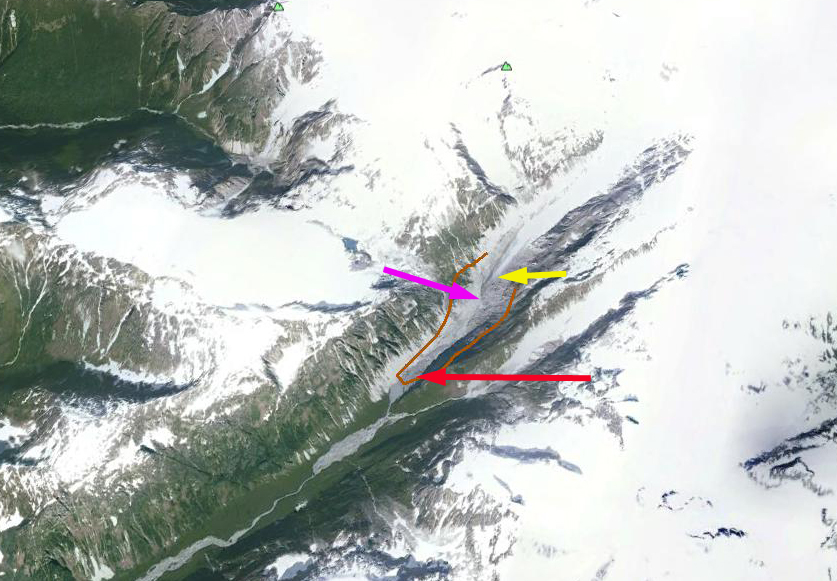
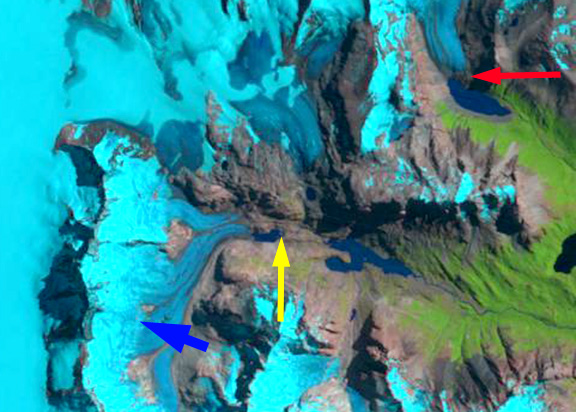
“Nass Peak” Glacier is a 5 km long unnamed valley glacier that feeds Coast Mountain Creek and then Nass River. The closest community is Kitsault, BC on the north side of the small icefield from which the glacier originates.  Here we examine changes in the is glacier in Landsat imagery from 1986 to 2013. In 1986 the glacier terminated at the red arrow, this is also approximately the mapped terminus position. The terminus is near the nose of a long ridge at 650 m in 1986. By 1997 the glacier had retreated 800 m to a location adjacent to the southern outlet stream from another glacier in a side valley. By 2010 the glacier has retreated behond the northern outlet stream of the side glacier, pink arrow and almost too the yellow arrow. In 2013 the glacier has retreated just beyond the yellow arrow a distance of 2000 meters since 1986 and is at an elevation of 850 m. For a glacier that was 7.5 km long and is now 5.5 km long that is a 27% loss of length in 27 years. The green arrow point to the separation between a side glacier and the Nass Peak Glacier, this expanded 250 m both from retreat of the side glacier and the lateral thinning at this elevation of Nass Peak Glacier. The last image is a 2009 Google Earth Image indicating the mapped terminus outline to the 2009 terminus.
The Nass Peak Glacier retreat is larger as a percentage of the glacier, but similar in distance than the nearby Porcupine Glacier, BC, Bromley Glacier, BC, Jacobsen Glacier, BC, Chickamin Glacier, AK and Patterson Glacier, AK. Nass Peak Glacier also has lacked a proglacial lake which typically enhances retreat via calving, making the retreat quite significant in terms of surface mass balance loss.

1986 Landsat Image
1997 Landsat Image

2010 Landsat Image
2013 Landsat Image
2009 Google Earth Image
Rink Gletscher, Retreat NW Greenland
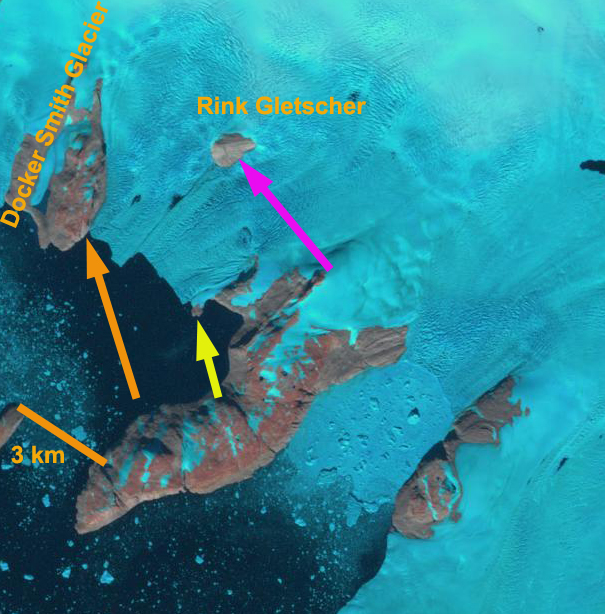
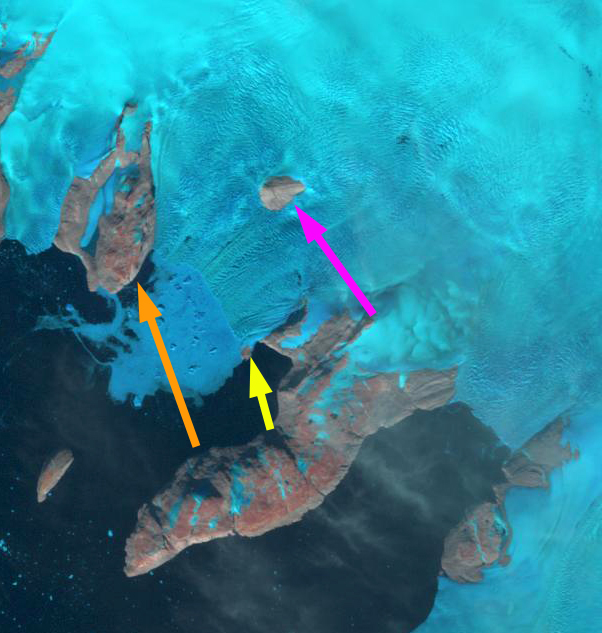
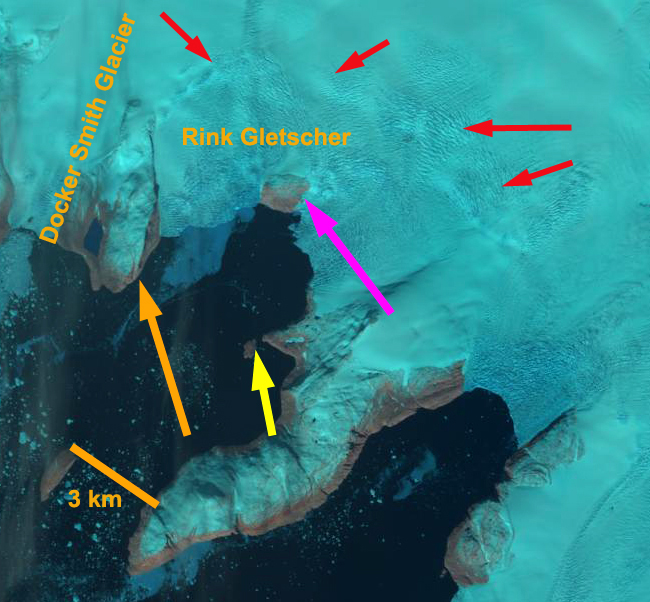
Rink Gletscher is just east of Docker Smith Glacier in Melville Bay Northwest Greenland. It should not be confused with the large and more famous Rinks Isbrae 5 degrees latitude south. This is a minor outlet glacier with a 4 km wide calving front.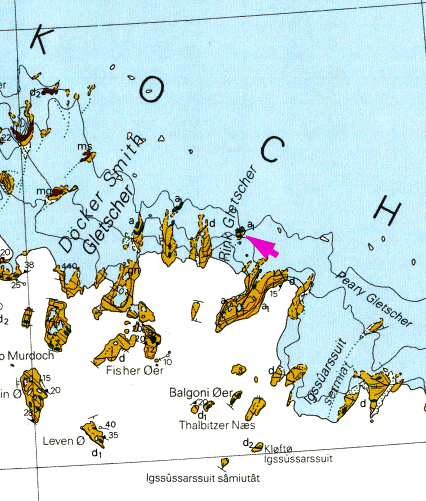
GEUS Map
McFadden et al (2011) noted that several larger neighboring glaciers in Northwest Greenland Sverdrups, Steenstrup, Upernavik, and Umiamako underwent signficant retreat, acceleration and thinning between 2002 and 2007. Steenstrup was the focus of a recent post where retreat of up to 5 kilometers since 1999 had led to new island formation. Howat and Eddy (2011) observed that 98% of glaciers in northwest Greenland retreated from 2000-2010 with a mean rate of 127 m per year. Van As (2011) has noted that net annual ablation after 2000 has been consistently higher in the region. Enderlin and Howat (2013) note that basal melting is 0.3-0.5 m day in this region, much higher than surface ablation. Here we again utilize the exceptional Landsat record of the changing earth surface with imagery from 1999, 2001. 2012 and 2013. In 1999 the glacier extends to the orange arrow on the west margin and a small peninsula, yellow arrow, on the east margin. A nunatak is located 3.5 to 4 km behind the calving front, pink arrow. By 2001 retreat of the western margin is evident, but only minor retreat in the east. By 2012 the glacier has retreated back to the nunatak with the greatest retreat in the center of the glacier and less at both margins. By 2013 it is evident that the island by the yellow arrow, has been freed from the ice sheet. The center of the glacier has retreated 3.5 to 4 km to the nunatak, pink arrow. Retreat is 3 km along the eastern margin and approximately 1.8 km on the western margin. A series of red arrows indicates a point where the surface slope of the glacier increases, resulting in greater crevassing. This reflects a bedrock step in elevation as well. The recent retreat has largely been via calving. This retreat can rapidly continue back to the red arrows, at that point water depths will be greatly reduced as will calving. The retreat here is coincident with the pattern of retreat and new island generation seen at Kong Oscar Glacier, Alison Glacier and Upernavik Glacier.
1999 Landsat Image
2001 Landsat Image

2012 Landsat image
2013 Landsat image
Steenstrup Glacier Retreat, New Island Generation NW Greenland
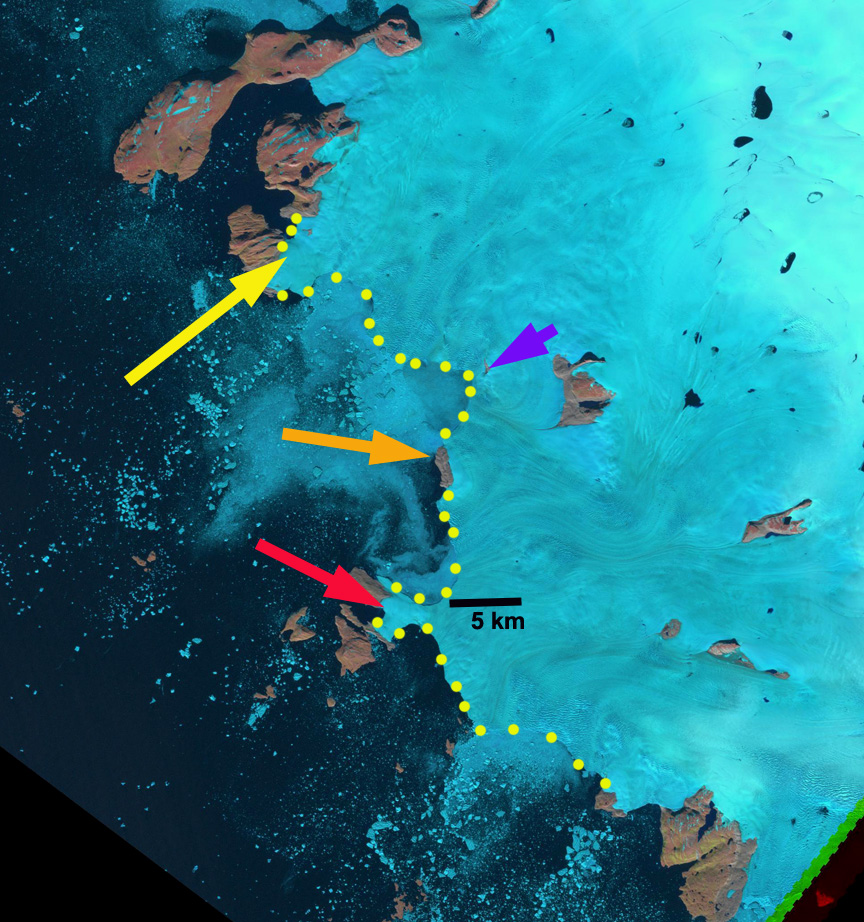
Steenstrup Glacier is located at 75.2 N in Northwest Greeland. The glacier terminates on a series of headlands and islands, the glacier immediatley to the south is Kjer Glacier. The boundary between Steenstrup Gletscher and Kjer Glacier is Red Head, Steenstrup Glacier’s northern margin is at Cape Seddon. Here we examine changes in the terminus position of Steenstrup and Kjer Glacier from 1999 to 2013. The retreat of the glacier during this interval has led to generation of new islands. Steenstrup Glacier has retreated 10 km over the past 60 years (Van As, 2010). Kjer Glacier was noted as relatively stable until loss of connection with Red Head Peninsula in 2005 (Van As, 2010).

Image from Van As (2010).
McFadden et al (2011) noted several glaciers in Northwest Greenland Sverdrups, Steenstrup (75°16’15.37”N), Upernavik, and Umiamako that had similar thinning patterns. Each experienced rapid thinning of up to ~100 m a-1 since 2000. They further noted that thinning was not synchronous with Steenstrup and Sverdrups thinning fast from 2002 to 2005, Upernavik from 2005 to 2006, and Umiamako from 2007 to 2008. This is not exactly synchronous, but occurring within a few years is essentially synchronous in terms of glacier dynamics. Each glacier also had a coincident speed-up with a 20% acceleration for Steenstrup Glacier (McFadden et al, 2011). This is a familiar pattern with thinning there is less friction at the calving front from the fjord walls and the fjord base, leading to greater flow. The enhanced flow leads to retreat and further thinning, resulting in the thinning and the acceleration spreading inland. The initial thinning comes from a combination of basal and surface melt.
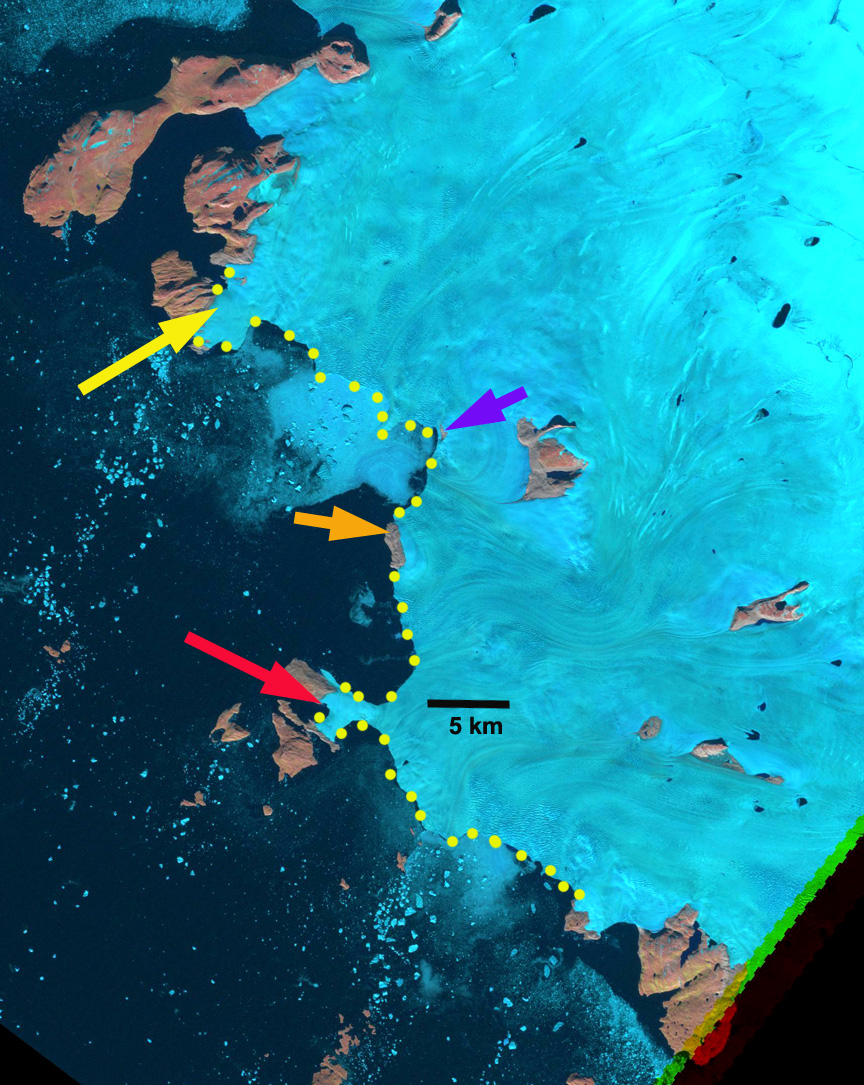
Here we examine Landsat images from 1999, 2001 and 2013 to identify changes. The red arrow indicates Red Head, which the glacier still reaches in 1999, though the connection is less than 2 km wide. The purple arrow indicates a small nunatak where the Automatic Weather Station utilized by Van As (2010) is located. The nunatak is 1.5 km from the ice edge in 1999. The orange arrow is an island at the ice front, South of the island the ice front is even with the island in 1999. The yellow arrow notes the connection of Steenstrup Glacier to Cape Seddon that is about 4 km wide. In 2001 there is little change in the ice front except at the purple arrow, where retreat has almost brought the nunatak to the terminus. By 2013 the connection to Red Head has been lost, it is now an island, this occurred as noted by Van As (2010) in 2005. Retreat from Red Head is 6 km. There is a substantial embayment south of the island at the orange arrow, indicating 4 km of retreat. North of this island that will soon lose it connection to the ice sheet, the embayment has expanded as well. At the purple arrow the ice front has reached the former nunatak now becoming an island. At the yellow arrow the loss in ice area at Cape Sneddon is greater than at Red head, though a connection may still exist, it is too narrow to measure. The last image below is a 2012 Google Earth image indicating the narrow connection to Cape Sneddon at that time and the strange relict crevasse pattern. It is clear that the end of Cape Sneddon will be in island next summer if not already, the MODIS imagery is not clear enough to distinguish this. The connection to the island at the south end of Kjer Glacier, last yellow dot near bottom has become much narrower since 1999 and will follow the route of Red Head and Cape Sneddon. The retreat here is coincident with the thinning and acceleration and follows the pattern of retreat and new island generation seen at Kong Oscar Glacier, Alison Glacier and Upernavik Glacier.
1999 Landsat Image
2001 Landsat image
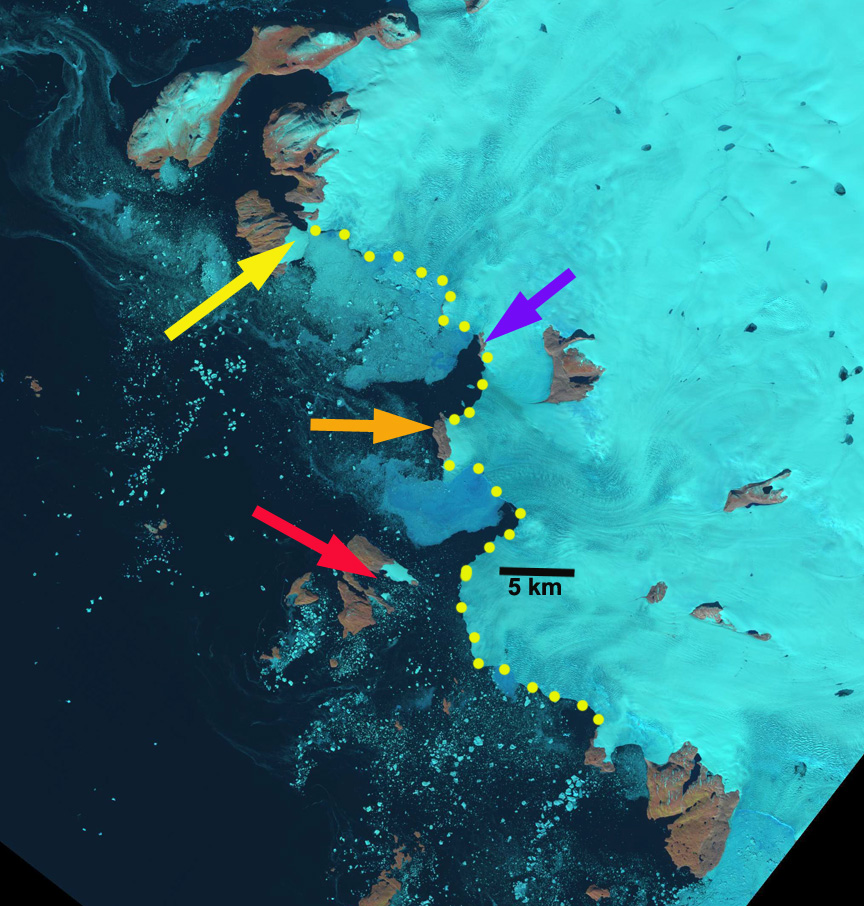
2013 Landsat image

Google Earth 2012 image Cape Sneddon.
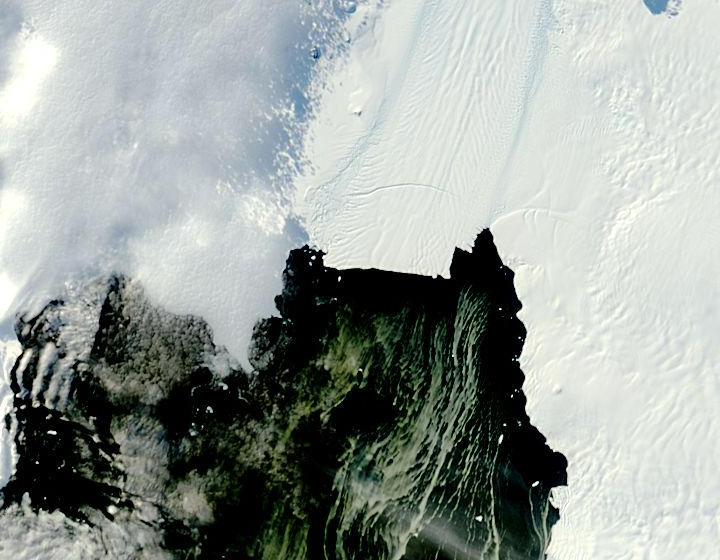
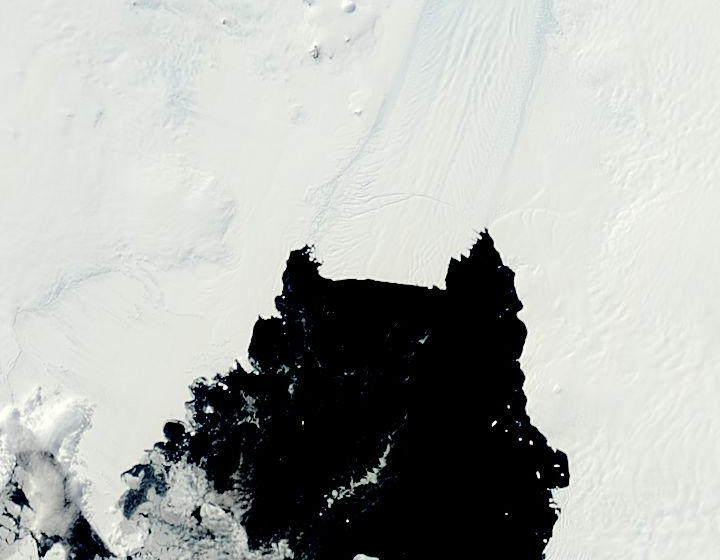
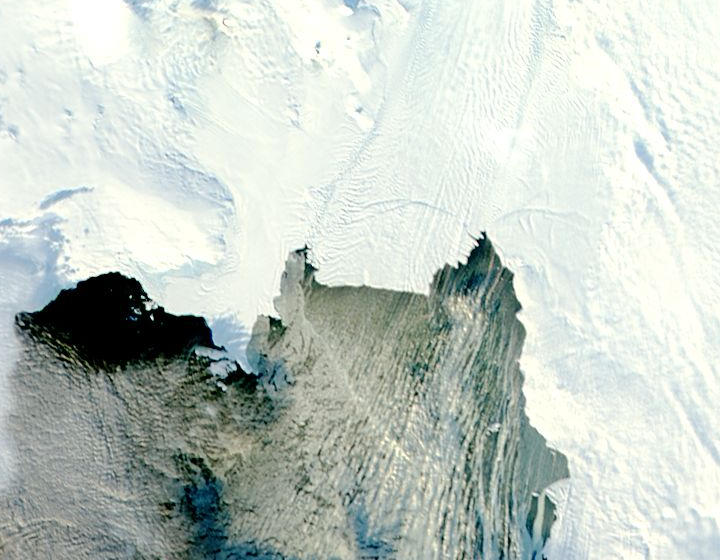
Pine Island Glacier 2013 Iceberg Rift update
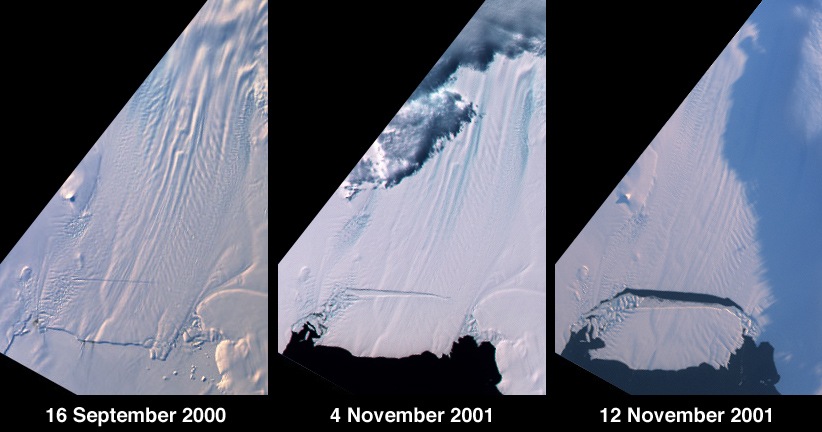
Operation Icebridge kept an eye this past fall on the extensive rift transecting the PIG that will lead to calving of a large iceberg in the near future. This rift was identified by NASA’s Operation Icebridge in 2011. This rift expanded laterally through 2012 and in width in early 2013, but had not shown open water in the daily MODIS imagery until 11/11/2013. The iceberg had not detached fully from the glacier until now. The iceberg being calved is approximately 780 square kilometers in size. With the Antarctic Operation Ice Bridge just beginning a new campaign great imagery will soon come via Pine Island Glacier I am sure.
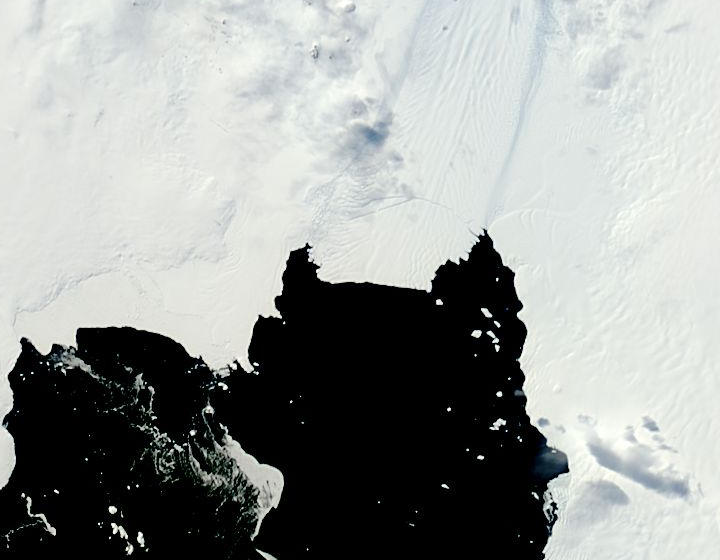
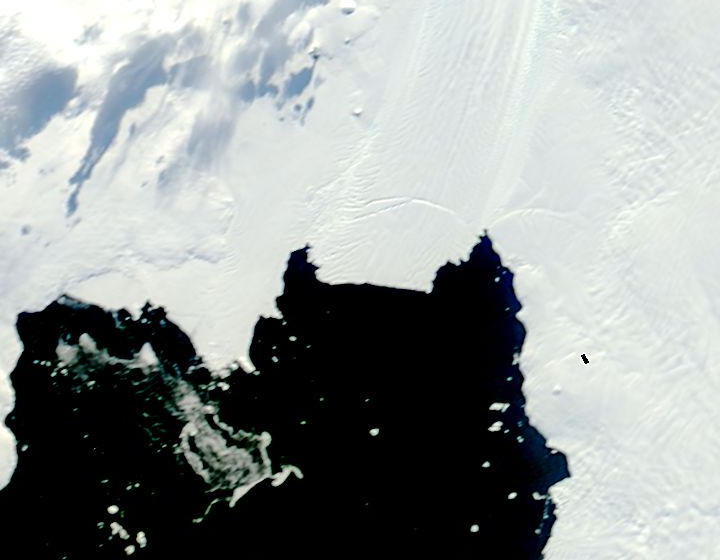
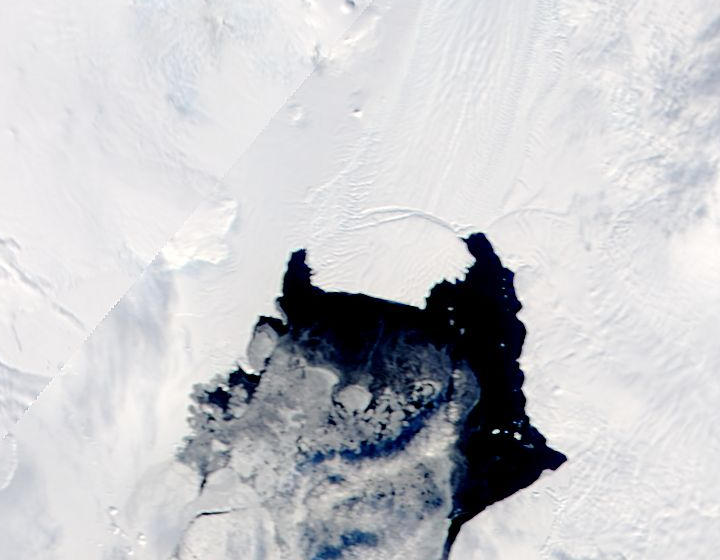
Below is the image from Nov. 11 & 16 2013 annotated followed by a sequence of MODIS images of the rift in 2012 and 2013 from the MODIS Rapid Ice Sheet Change Repository for Antarctica updated daily.

Nov. 11, 2013 MODIS
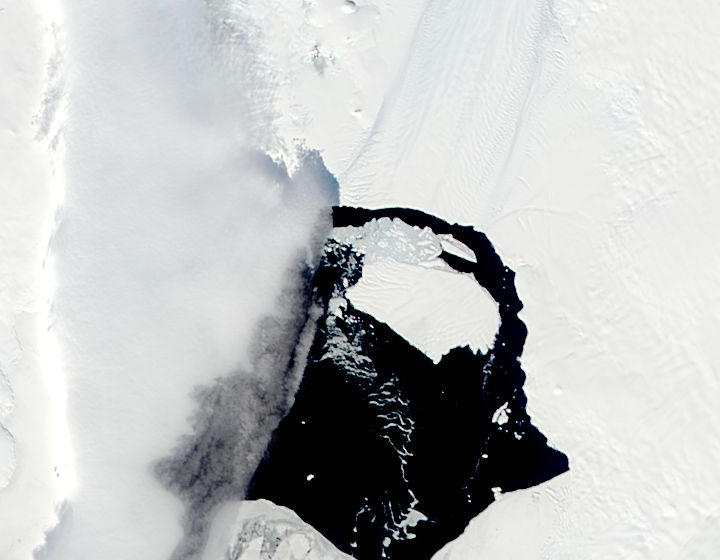
Nov. 16 2013 MODIS
Feb. 4, 2012 MODIS
March 9, 2012 MODIS
Nov. 19 2012 MODIS

Dec. 25 2012 MODIS
Feb. 2 2013 MODIS
Feb. 9, 2013 MODIS

Feb 18, 2013 MODIS
April 3, 2013 MODIS

Oct. 23, 2013 MODIS
Nov. 5, 2013 MODIS
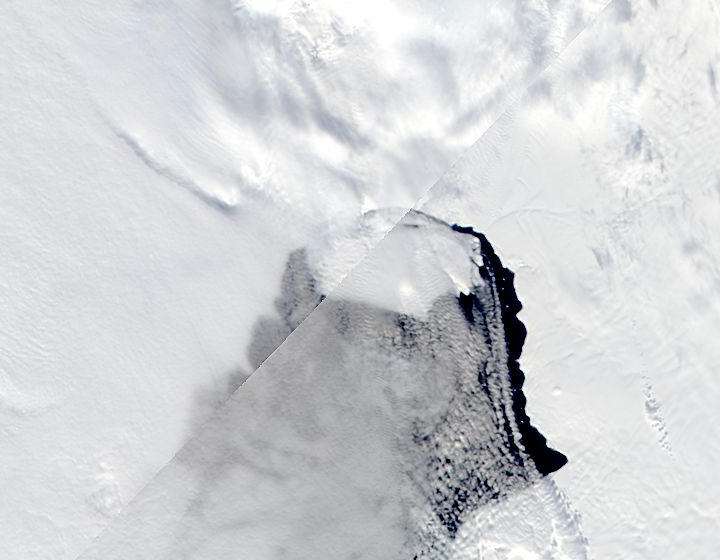
Nov. 11, 2013 MODIS
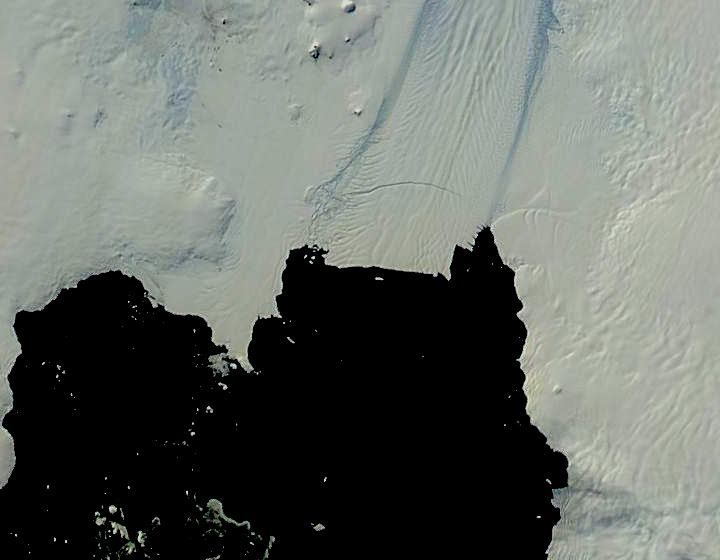
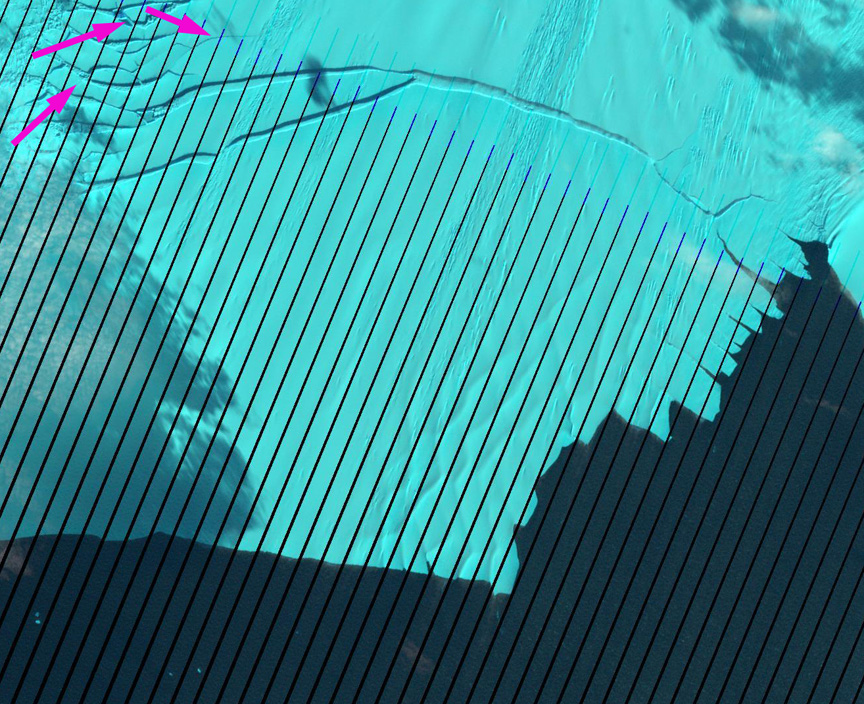 Landsat Image from March 2013, indicating the rift, before separation including additional rifts forming on east margin.
This iceberg can be compared to the development of an iceberg in 2001 (NASA 2001).
On December 17, 2012 researchers with the PIG project announced that they had successfully drilled through the remote Pine Island Glacier ice shelf.
The successful drilling will help to reach the project’s ultimate objective: to study the physical processes that are causing a rapid melting of the 60-kilometer-long (37 miles) ice shelf that extends into Pine Island Bay. One cause is suspected to be the circulation of relatively warmer ocean waters under the floating ice shelf that are undercutting the shelf (NSF, 2012). The logistics of this operation is captured in fascinating detail by the PIG Ocearnography Program. Meanwhile the Glaciology Program under Bob Bindshacler of NASA will be sizing up the glacier. PIG has thinned and accelerated since 1984, the most notable cause is melting of the base of ice sheet by warm water that was directly measured using and autosub (Jenkins et al, 2011). This research led to observations of channelized melt beneath the glacier (Stanton et al 2013).
Greater Azau Glacier, Mount Elbrus, Russia
Greater Azau Glacier is on the south slopes of Mount Elbrus, Caucasus Mountains of Russia. The glacier is just west of the ski complex at Prielbrusye, that has lifts from Azau at 2300 m to Krugozor at 3000 m and Mir at 3500 m. This glacier like others on Mount Elbrus and in the Caucasus Mountains is retreating. Russian Academy of Sciences remapping of the glaciers on the mountain indicate a 15% loss in area from 1911 to 1957 and 7% loss from 1957-2000. 
2013 Landsat of Mount Elbrus and its glaciers.

2009 Google Earth image of Azau Glacier.
In 1998 the glacier descended to an elevation of 2650 m ending at the yellow arrow. The pink arrow indicates a knob adjacent to the 2013 terminus. The red arrows indicate the length of the connection of the slope glacier to the west of the main valley tongue of the Azau Glacier, it is 1 km. The orange arrows indicates a thin connection between two segments of the upper glacier on the western slopes above Azau Glacier. IN 2001 the terminus has retreated a short distance from 1998. By 2013 the terminus has retreated 450 m to just beneath the knob at the pink arrow, 30 m per year. The terminus is now at 2850 meters. The glacier on the western slopes has separated at the orange arrow and the connection at the red arrows has been reduced to 200 meters from 1000 meters in 1998. A close up view of the terminus in 2009 indicates that it is still just downvalley of the prominent knob. Only the lower 300 m of the glacier is uncrevassed, above this point active crevassing is widespread. The Krugozor Ski Station is also noted. This glacier is retreating faster now than during the 1957-2000 period like the Irik Glacier to the east on Mount Elbrus. This likewise is the pattern of retreat observed elsewhere in the Caucasus at Gora Bashkara,Kirtisho Glacier and Lednik Karaugom Glacier. The glacier still has an extensive accumulation zone.
1998 Landsat image
2001 Landsat Image

2013 Landsat Image

2009 Google Earth Image
Gora Bashkara Region Glacier Retreat, Western Caucasus, Russia and Georgia
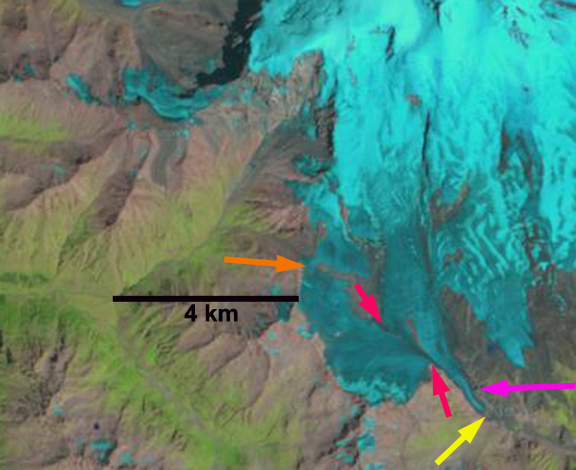
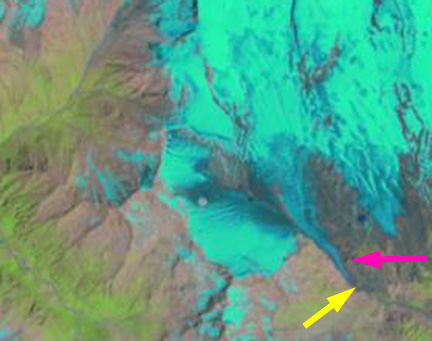
In the vicinity of Bashkara Glacier in the Western Caucasus we examine using Landsat imagery the response of several glacier over the 1998 to 2013 period. This region has been experiencing widespread significant retreat (Shahgedanova et al 2009), with average retreat of 8 m per year due in large part to increased summer temperatures. This region has been an area of increased proglacial lake formation as well Stokes et al (2007). Petrakov et al (2011) examined changes in the lakes at the margin of Bashkara Glacier. They examined three lakes near the margin of the glacier and identified large expansion of two of them due to glacier retreat. They found the terminus reach to be stagnant and thinned 13 meters from 1999 to 2007. Lake Lapa has expanded eastward 250 m since 1999 due to terminus retreat Petrakov et al (2011). 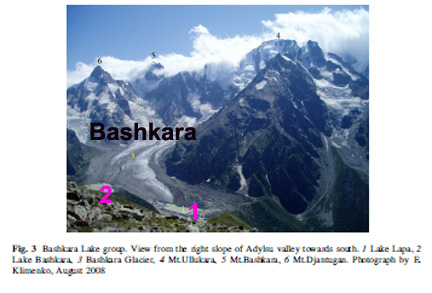
Image from Petrakov et al (2011). Lake Lapo=1 and Lake Bashkara=2.
In 1998 only Bashkara Lake is substantial in sie, yellow arrow. Two valleys to the west an unnamed glacier ends at the red arrow after taking a sharp right turn. At the pink arrow an unnamed mountain glacier descends from the upper basin at m to the lower valley where it terminates. In 2001 little has changed at the three locations. By 2013 Lake Lapo the western most lake at the yellow arrow has expanded as the glacier has retreated that Petrakov et al (2011) noted. The unnamed glacier at the red arrow has retreated 500 m and now barely rounds the turn to the west. At the pink arrow the glacier now no longer descends from the upper basin to the lower valley. The terminus region in the valley bottom has melted away, a retreat of 400-500 m. The retreat of these glacier follows that of other glacier in the region Great Azau Glacier, Kirtisho Glacier and Lednik Karaugom Glacier. 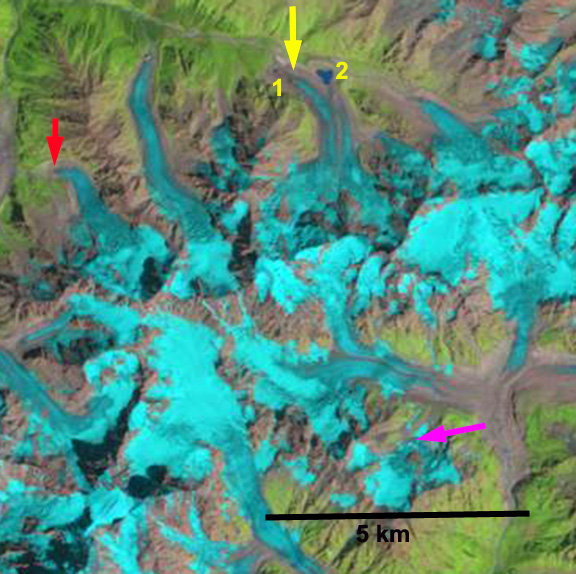
1998 Landsat image
2001 Landsat image
2013 Landsat image
Marconi Glacier Retreat, Patagonia, Argentina
Marconi Glacier, Argentina is one of the more common routes onto the Southern Patagonia Ice Cap (SPI) via Marconi Pass. The glacier is not fed by the ice cap itself, unlike the Glaciar Chico just to the north. The glacier drains into Electrico Lake and Rio Electrico. The good news is despite the name Rio Electrico will not be developed, since it is in Parque Nacional Los Glaciares, Argentina.  Here we examine changes in the glacier observed in Landsat imagery from 1986 to 2012. In 1986 the glacier ends in the valley bottom, without a proglacial lake km from Electrico Lake, yellow arrow. Two neighboring glaciers one ending in a lake, red arrow and one on the valley wall pink arrow are noted. By 2002 Marconi Glacier has retreated 450-500 m exposing a new lake that it terminates in. The snowline blue arrows is at 1100 m. The glacier on the valley wall has retreated leading to a new lake forming, pink arrow. By 2011 Marconi Glacier’s retreat is 800 m since 1986 and it is still ending in the new expanding proglacial lake. The snowline is again close to 1100 m, though this is not the end of the summer. The glacier terminating at the red arrow has now retreated from the lake it ended in. In 2012 Marconi Glacier appears to be close to exiting from the proglacial lake. There is an excellent image of the terminus of the glacier in 2012 from useless conquests, a blog I find useful, that indicates the tenuous connection to the lake. Overall retreat from 1986 to 2012 is 800-850 m.
The pattern of retreat is consistent between these glaciers and the region as noted by Davies and Glasser (2012), who note a 0.15-0.20% area loss per year for the Marconi Glacier and its neighbors that are not part of the main SPI. Davies and Glasser (2012) further note that overall annual rates of shrinkage were far faster from 2001-2011 than from 1870-1986 or 1986-2001. The Argentine Institute of Snow Research, Glaciology and Environmental Sciences has developed maps of the retreat of many of the glaciers from Little Ice Age moraines of SPI that are in Argentina. Each of these indicates a pattern of retreat like Marconi Glacier. Onelli Glacier and Seco Glaciers are other glaciers in the area that retreating.

1986 Landsat image

2002 Landsat image
2011 Landsat image

2012 Landsat image

2010 Google Earth image
Glaciar Chico Retreat, Patagonia, Chile
Glaciar Chico drains the east side of the Southern Patagonia Icecap (SPI). Rivera et al (2005) noted that Glaciar Chico had retreated significantly from 1945 to 1976, calving into Brazo Chico, but then retreated slower than most SPI glacier from 1975 to 2001, second image from Rivera et al (2005).

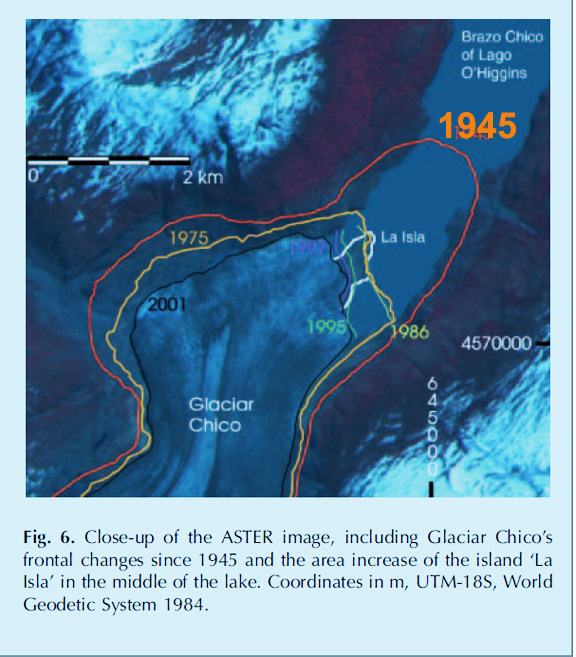
Davies and Glasser (2012). noted that Glaciar Chico’s thinning rates are comparable to other glaciers of the SPI, and the rate of area SPI now shrinking at 20.5 km2 per year. Here we examine Landsat imagery of the glacier from 1986, 1999, 2011 and 2013. In 1986 the glacier terminates near the northern end of a small island in Brazos(Lago) Chico, yellow arrow. A portion of the terminus extends due north to Glacier O’Higgins forming two proglacial lakes, red arrow. The red dot and pink dot indicate the 2013 terminus positions. By 1999 the island is half exposed, a retreat of 600 m. By 2011 the glacier has exposed nearly the full island a retreat of 900 m. The northern margin at the red arrow has also retreated 300 m and the proglacial lakes have now drained. By 2013 at the beginning of the melt season, Glaciar Chico has retreated from the island, and is ending in the lake, though the lake is not likely very deep. The glacier has retreated 1100-1200 meters from its 1986 position. The northern margin has retreated 400-500 meters from its 1986 position. This indicates widespread thinning has continued as Rivera et al (2005) and Davies and Glasser (2012) have indicated would be the case. At the orange arrow 5 km above the terminus the glacier width has decreased by 15-20% from 1986-2013, indicating a continued reduction of flow of ice into the terminus region. The closeup of the terminus from Google Earth indicates a glacier with active crevassing and flow into the terminus region, suggesting that rapid retreat will not ensue. The retreat of this glacier is typical of the other Patagonian glaciers as Davies and Glasser (2012) have so well documented. Examples of the retreat include Onelli Glacier, Jorge Montt Glacier, and Glaciar Steffen
1986 Landsat image

1999 Landsat image

2011 Landsat image

2013 Landsat image
Google Earth terminus closeup
Chocolate Glacier Retreat, Glacier Peak, Washington
From 1994-1997 we ran a four year project to survey the terminus response of all the glaciers on Glacier Peak, Washington to climate change. This was a century after a climb in the region by C.E. Rusk. Chocolate Glacier is the largest of the east side valley glaciers. The average retreat of Glacier Peak glaciers from the LIA to the 1958 positions was 1640 m. Richard Hubley noted that North Cascade glaciers began to advance in the early 1950s, after 30 years of rapid retreat. The advance was in response to a sharp rise in winter precipitation and a decline in summer temperature beginning in 1944 (Hubley, 1956; Pelto and Hedlund, 2001). All ten glaciers on Glacier Peak advanced. Advances of Glacier Peak glaciers ranged from 15 to 480 m and culminated in 1978 (Pelto and Hedlund, 2001). All Glacier Peak glaciers that advanced during the 1950-1979 period emplaced identifiable maximum advance terminal moraines, that were fresh and easy to recognize in the 1990’s. By 1984, all the Glacier Peak glaciers were again retreating, the North Cascade Glacier Climate Project has monitored this retreat since 1984.
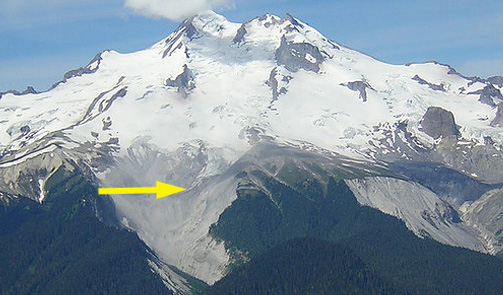
2005 Glacier Peak east side

Cliff Hedlund beneath Vista Glacier during 1994 expedition.
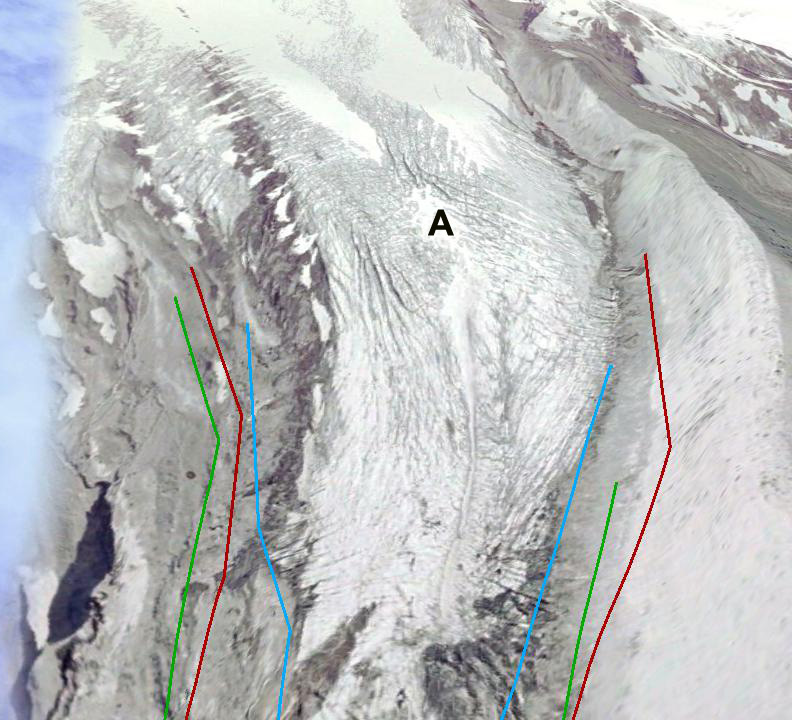
Beginning at 3050 m Chocolate Glacier descends to 1800 m today. When Rusk (1924) first saw this glacier he noted that it presented a dramatic sediment covered front. Immediately above the terminus it was heavily crevassed and quite active, indicating a slow retreat. This glacier which he named Cool Glacier had retreated little from the alpine meadows fringing the south side of the glacier. The terminus had already retreated 400 m up the narrow valley by 1906 from its LIA. A retreat of 1380 m occurred between 1906 and 1946. The retreat was noted to be particularly rapid during the 1920-1940 period by Austin Post. Glacier advance had begun by 1950. An advance from 1946-1955 of more than 200 m occurred (Hubley, 1956). The advance continued up until 1975 totaling 450 m. This was the largest advance of the Glacier Peak glaciers, probably due to the nature of the steep, narrow valley down which the glacier flows from 1960 m to the terminus. The glacier was approximately at this maximum position when mapped in 1984. In the next sequence of images the red line is the mapped 1984 terminus, green is 1998 and blue is 2009. During our visit in 1994 the glacier had retreated 210 m from the moraine it had generated. By 1998 the glacier had retreated 275 m, and was at the based of a steeper slope. By 2009 the glacier had retreated 500 m since 1984, ending at 1925 m, this is still the lowest of the east side glaciers. 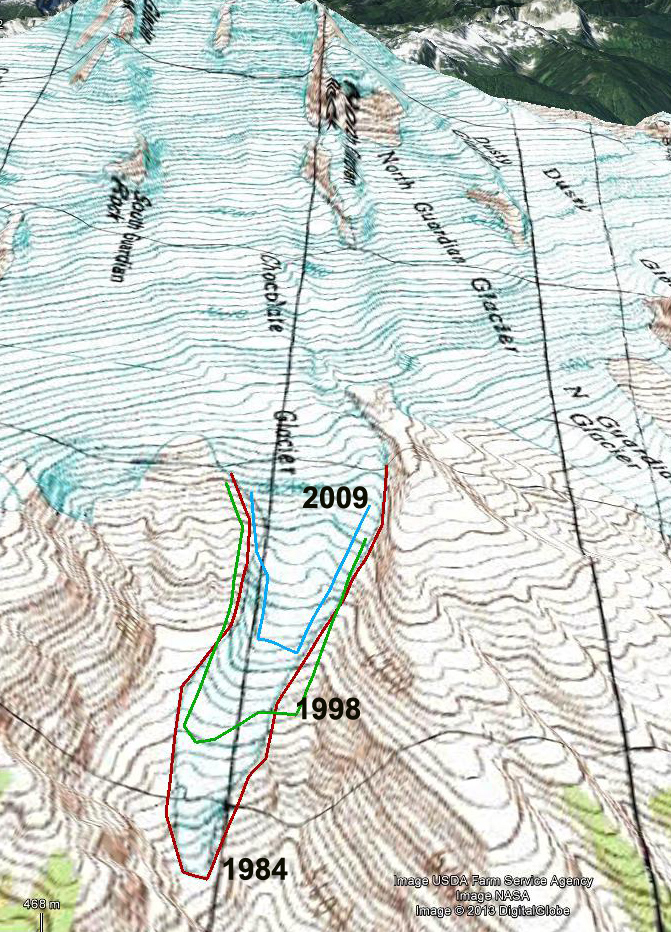
1984 map view
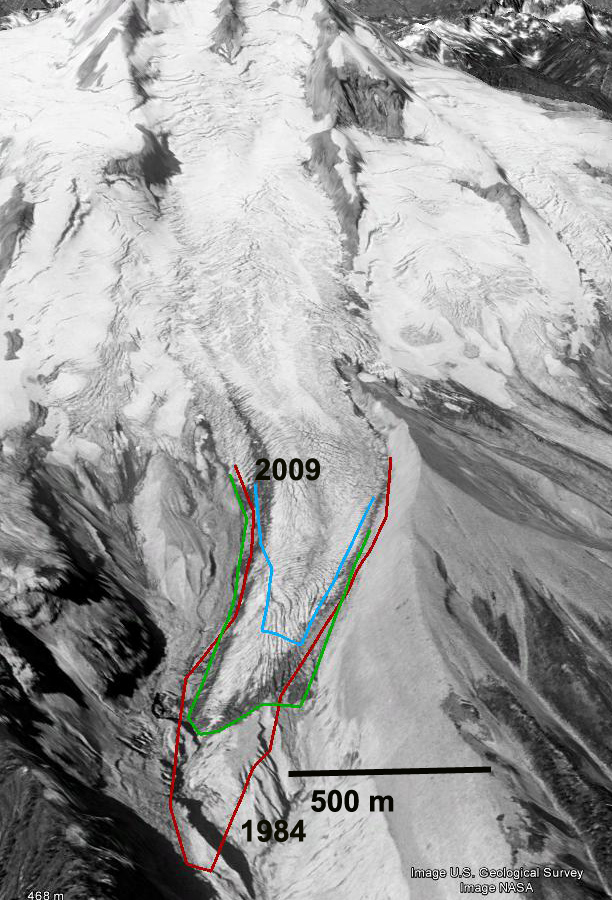
1998 Google earth view

2009 Google Earth
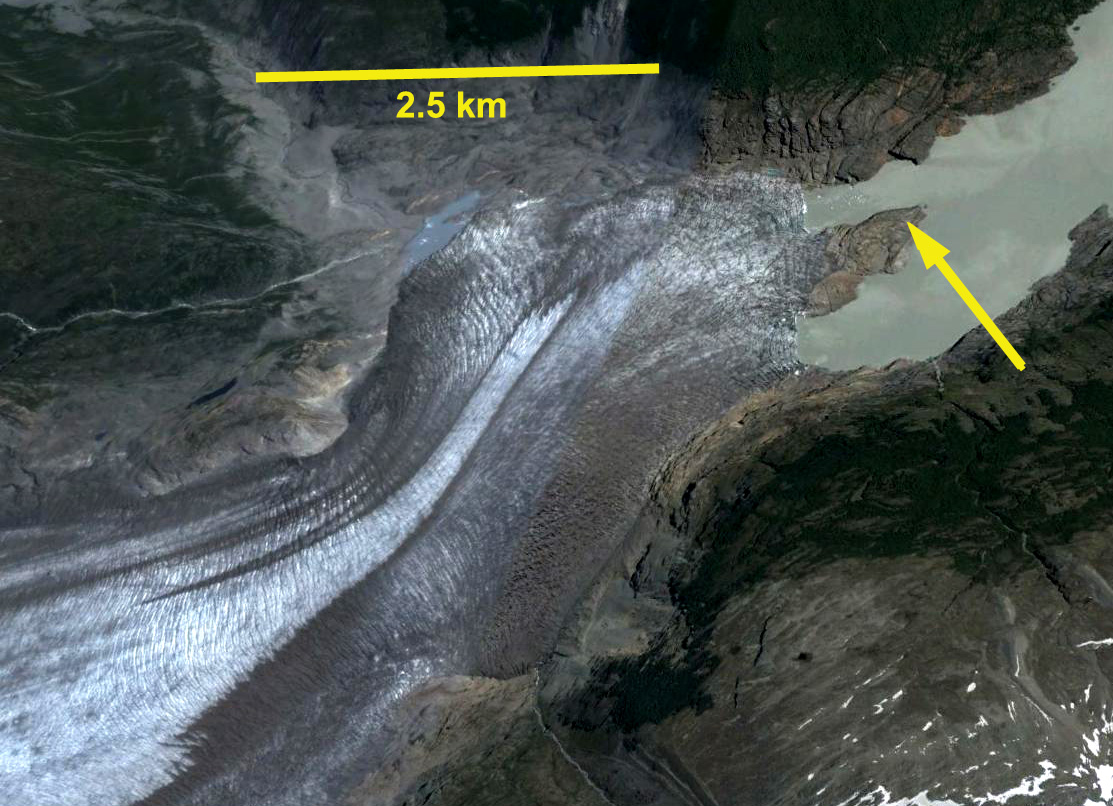
Chocolate Glacier remains crevassed and active, but the degree of crevassing has decline from 1998 to 2009 as evidenced by this closeup of the 2000-2200 m region. It is hard to get a good view of this glacier from up close the best vantage is from across the Suiattle River valley, as seen below. 
1998 Google Earth view
2009 Google earth view

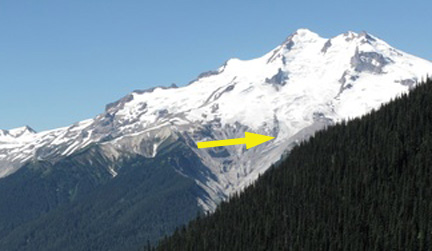
2006 Glacier Peak from the east
2007 Glacier Peak from the east
Yanashallasa Glacier Retreat, Peru
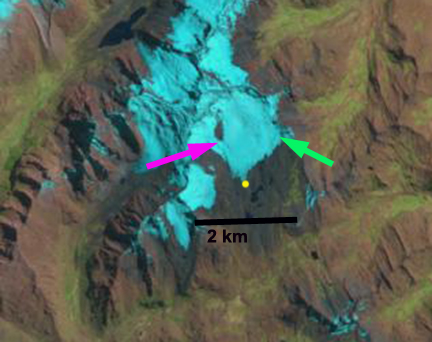
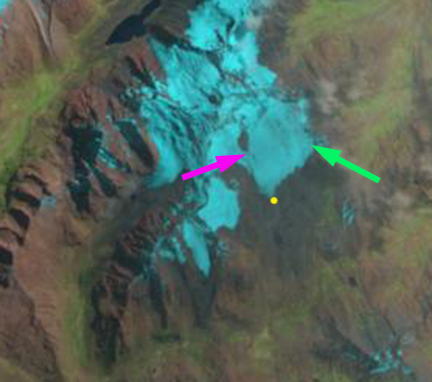
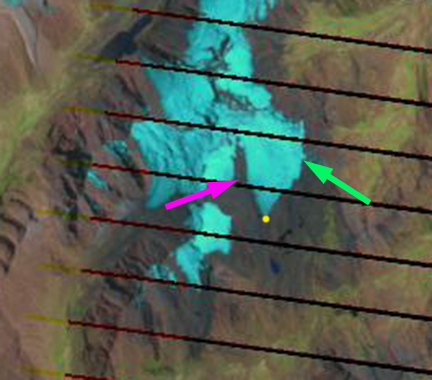
Yanashallasa Glacier is near the southern end of the Cordillera Blanca in Peru. The glacier feeds the Rio Santa river, which provides irrigation for substantial agricultural acreage. Marks and Seltzer (2003) identify that at least 30% of the runoff comes from glaciers, rising considerably during the dry season. The glacier retreat in the region with a 22% area loss from 1970-2003 (Racoviteanu et al , 2008), will lead to continued decline in glacier runoff. Here we examine satellite imagery from 1992-2013 of changes in the Yanashallasa Glacier. 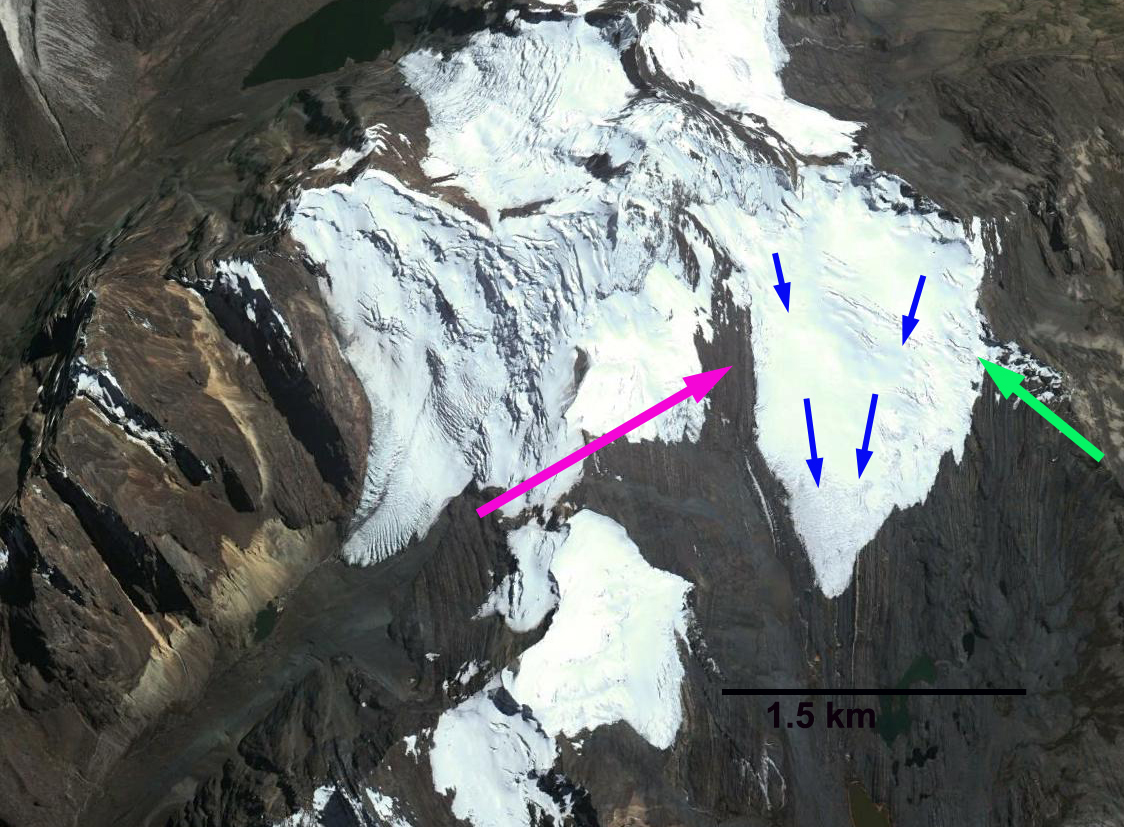 In each image the yellow dot marks the terminus, the pink arrow the same location on the west side of the glacier and the green arrow the same location on the east side of the glacier. In 1992 the terminus almost reaches a small lake beyond the glacier margin. The west margin indicates a wide connection of the glacier to slopes on the west side of the glacier. In 1999 and 2000 the glacier has retreated 150-200 m, the glacier still has a connection on the west side of the glacier. In the east side the glacier extends to the ridge east of the glacier even at the terminus. By 2013 the glacier has become disconnected from the slopes to the west of the glacier, pink arrow, the separation is a key sign of glaciers in disequilibrium. On the east side of the glacier the glacier has retreated from the east ridge at the terminus, green arrow. The losses in area along the lateral margins exceeds the retreat of the main margin, yellow dot. The main terminus retreated 250 m from 1992 to 2013. The impact of these glacier changes was assessed by USAID (2011). Other glaciers in the region are retreating in a losing mass Shallop Glacier Gurgiser et al (2013) and retreating: Quebrada Carhuascancha Glacier, Corihuasi Glacier and Chuecon Glacier in Cordillera Centrale adn Artesonraju Glacier similar fashion
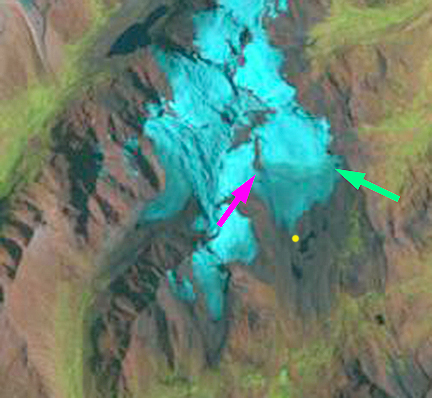
1992 Landsat imagery
1999 Landsat imargery
2000 Landsat imagery
2013 Landsat imagery

2013 Landsat imagery
