Desolation Valley, Alaska, Conversion from Glacier to Lake


desolation-compare

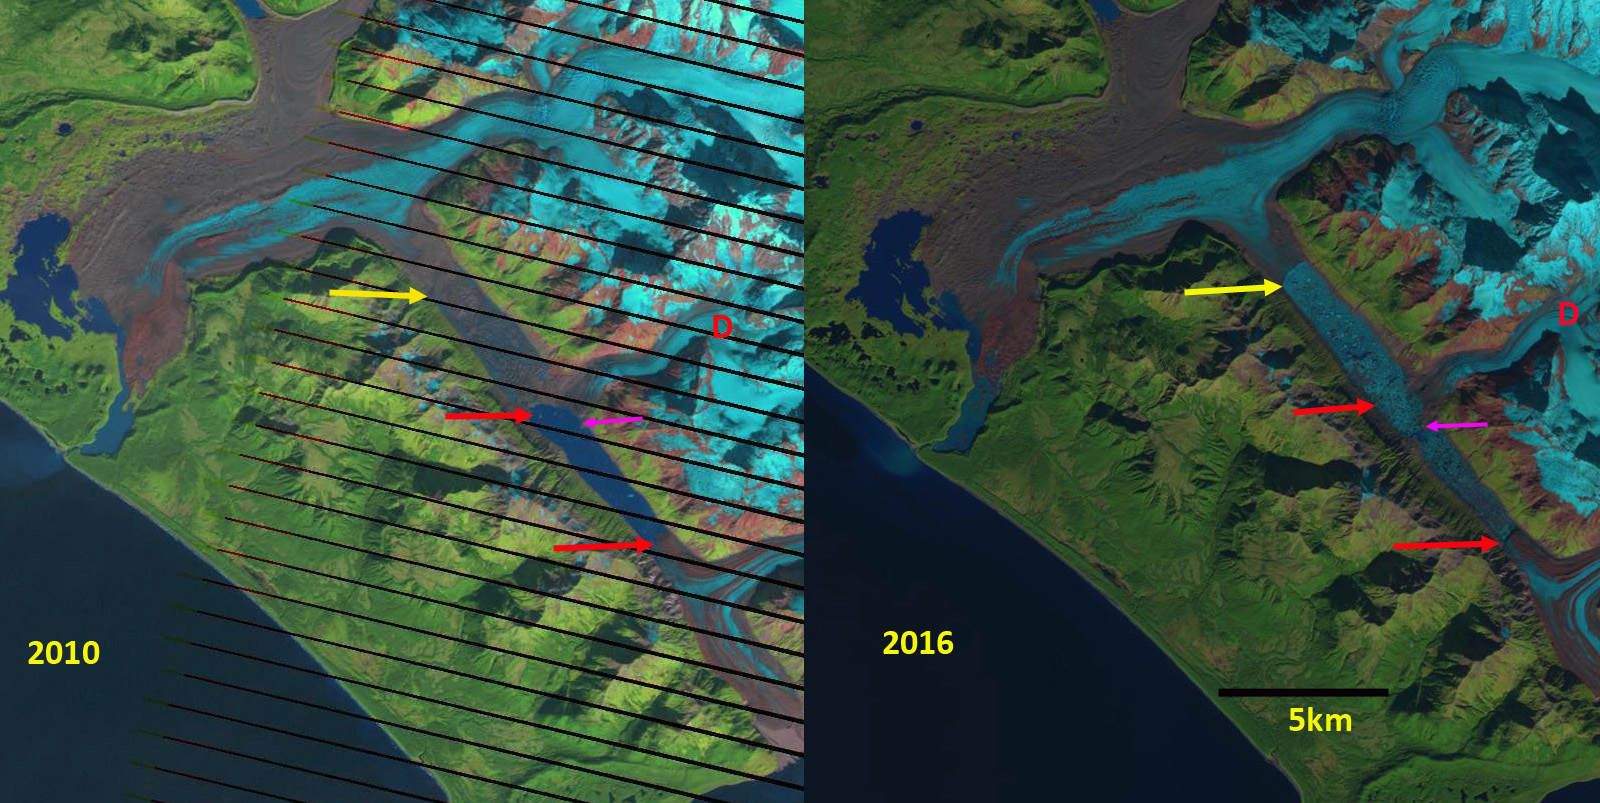
Retreat of Desolation-Fairweather Glacier from 2010-2016 in Landsat images.  The red arrow indicates 2010 terminus positions, yellow arrow the 2016 terminus. Pink arrow a delta exposed by lake level lowering. D=Desolation Glacier.

Desolation Glacier flows west from the Fairweather Range into Desolation Valley where in 1986 it joined with the Fairweather Glacier flowing from the north and the Lituya Glacier flowing from the south to fill the valley with glacier ice.  This is no longer the case, the valley once known for its long relatively flat area of largely debris covered ice, is mostly a lake now.  The valley has developed along the Fairweather Fault. Molnia (2007) noted that the tidewater termini of Lituya Glacier advanced ∼ 1 km since 1920 and continued to advance up to 2000 as it built an outwash plain reducing calving. Larsen et al (2015) noted thinning rates of 3 m per year for the Desolation Valley from Desolation Glacier north to Fairweather Glacier in the last decade (1994-2013).  Alifu et al (2016) identified that Desolation Glacier and Fairweather Glacier have lost 2.6% and 2.2% of their glacier area, respectively from 2000-2012. Only minor surface area changes were seen in Lituya Glacier during this period. They also noted that the mean snow line altitude of Fairweather, Lituya and Desolation increased by 120–290 m. Since 2012 extensive ice loss of the Desolation-Fairweather complex has occurred.  This is similar to the large rise in the transient snowline/equilibrium line noted by Pelto et al (2013) on nearby Brady Glacier.

In 1986 The Desolation Valley was filled with glacier ice from Fairweather Glacier to Liutya Bay.  By 2010 the southern half of the valley from Lituya Glacier to the outlet of Desolation Glacier into the valley had opened up and the terminus of Desolation Glacier and Lituya Glacier were at the red arrows, this represented a 5.3 km section of glacier lost. In 2013 the northern half of the valley filled by the Desloation-Fairweather Glacier was breaking up but still ice filled.  The Google Earth image from 2014 illustrates how broken up.  By 2016 the collapse was total and the new terminus is at the yellow arrow a 5.5 km retreat since 2010, this is a loss of 6.5 square kilometers of ice. The lake level also dropped which led to exposure of a lacustrine delta that had been submerged in 2013 and 2014, pink arrow. The lake has expanded in area, but lost in mean depth.  Will this continue to be a lake with continued retreat or become a braided river valley as the Fairweather Glacier continues to thin and retreat?  Desolation Glacier is no longer calving and its retreat rate should slow.  The terminus of the Fairweather Glacier should continue to retreat via calving in a fashion similar to glaciers around the world terminating in extensive lakes. Just to the north the North Fork Grand Plateau Glacier also experienced a large recent retreat with Landsat imagery in 2013 and 2014 indicating extensive calving from 2013 to 2015 and a retreat of 3.0 km, 1.5 km/year.  Fingers Glacier  is another nearby glacier that also is experiencing widespread retreat.  More images of the region are in a field blog on the region.

desolatiion-1986-2013

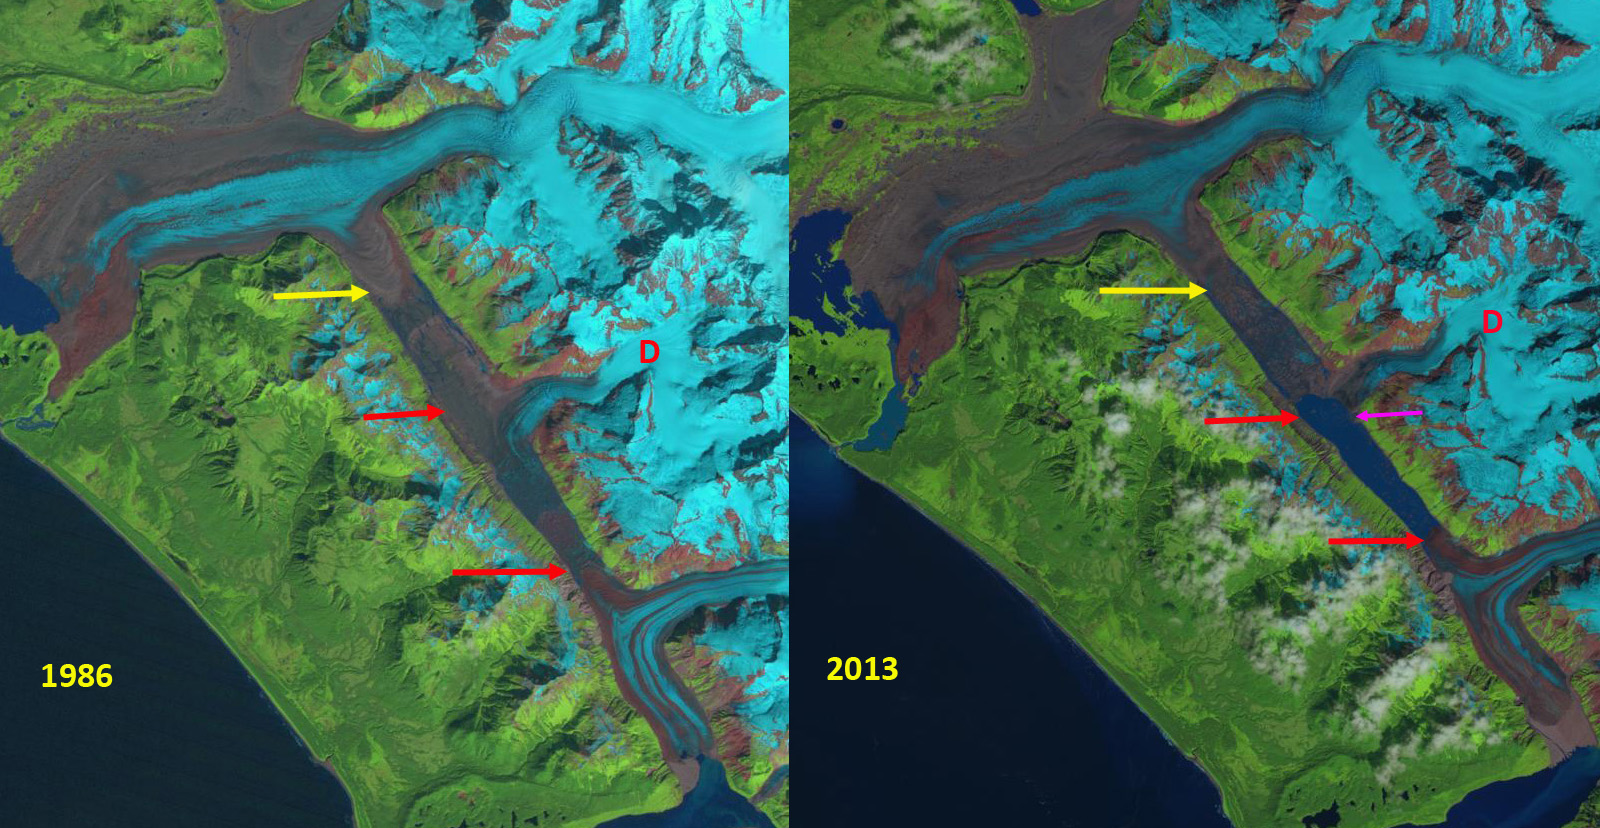
Retreat of Desolation-Fairweather Glacier from 1986 and 2013 in Landsat images.  The red arrow indicates 2010 terminus positions, yellow arrow the 2016 terminus. Pink arrow a delta exposed by lake level lowering. D=Desolation Glacier.

desolation-breakup

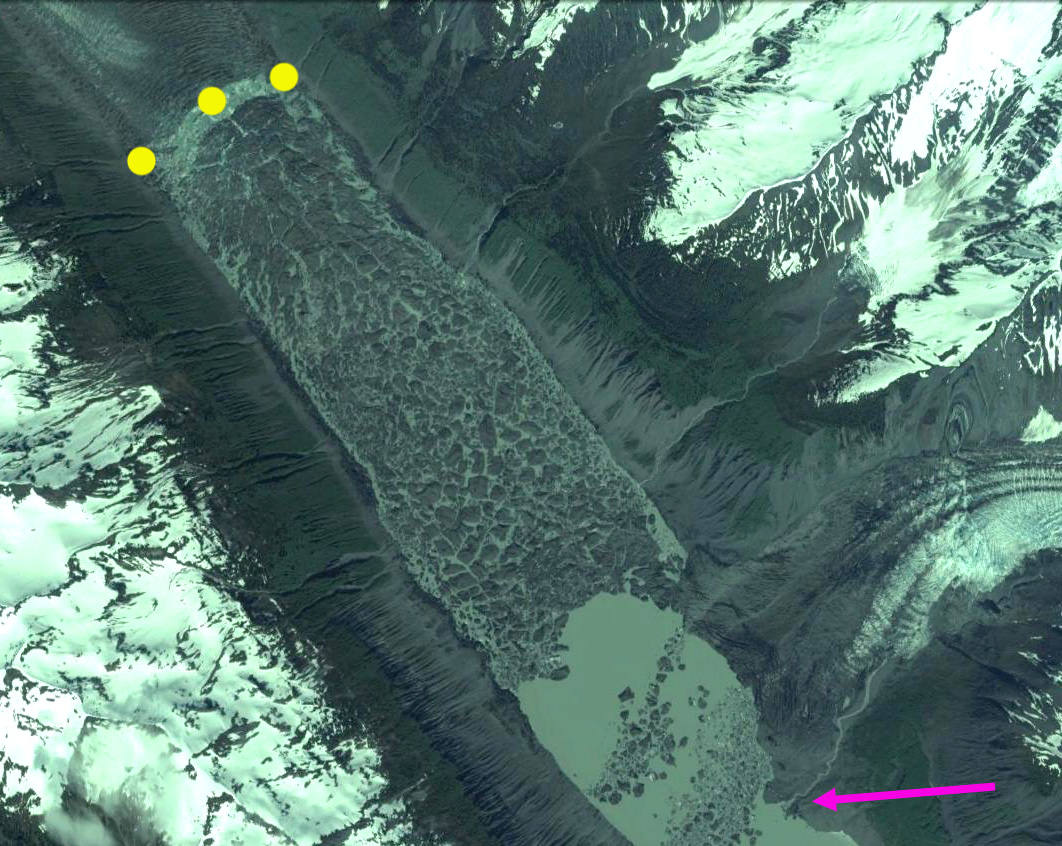
Google Earth image from 2014 of the disintegrating debris covered glacier.


Fingers Glacier, Alaska loses a finger to melting

finger compare
Landsat comparison of terminus area of Fingers Glacier 1986 and 2015

Fingers Glacier flows from the southern end of the Fairweather Range to the coastal plain, where is expands into a segmented piedmont lobe. The southernmost finger is heavily debris covered. In the Mount Fairweather B-4 quadrangle USGS map based on 1951 aerial photographs the glacier has four prominent fingers each eroding its own basin.  Here we examine Landsat imagery to illustrate the changes in this glacier from 1951 to 2015.  From 1950-1980  glacier’s just to the north In Lituya Bay were advancing. The La Perouse Glacier its immediate neighbor to the north was stable. Palma Glacier directly to the southeast has retreated throughout the 1950-2015 period.  Larsen et al (2015) identify that from 1994-2013 this region of Alaska is a significant source of glacier volume loss and hence contributor to sea level rise.  The loss of 75 gigatons per year from glaciers in southern Alaska was determined in this study to be largely from surface melt not from calving losses.  The mass balance of both Taku and Lemon Creek Glacier of the Juneau Icefield have had a notable decline in mean mass balance from 1986-2015 versus the 1951-28985 period (Pelto et al, 2013).  The nearby Brady Glacier also experience a higher snowline (Pelto et al, 2013b) which led to volume losses quantified by Larsen et al (2015).
fingers map

USGS map based on 1951 images

By 1986 the glacier still had four fingers with retreat from the 1951 position yellow arrow to the 1986 position red arrows.  Retreat was 900 m for the first finger, 400 m for the second finger, 300 meters for the third and 400 meters for the fourth southernmost finger.   A new lake had developed at the second finger, well lake expansion occurred at the first and third finger.  By 1999 a lake is beginning to form at the fourth finger.  In 2015 the first finger has retreated 600 meters in 30 years.  The second finger has disappeared after a 700 m retreat from 1986-2015..  The third finger has lost half of its length to the expanding lake, a retreat of 600 m in 30 years.  The fourth finger which is the most debris covered, leading to slower thinning, has retreated 600 meters since 1986, with a lake at the terminus that is continuing to expand.

fingers 1986

1986 Landsat Image

fingers 1999

1999 Landsat Image

fingers 2015

2015 Landsat Image
fingers glacier

Google Earth Image indicating flowlines.

Spotted Glacier Retreat, Katmai Region, Alaska

Spotted Glacier flows north from Mount Douglas and terminates in a developing proglacial lake. In the USGS map from 1951 the lake is not evident. Giffen et al (2008) noted that the glacier retreated ~1200 m from 1951-1986, a rate of 33 m/year.
spotted glacier map
Here we examine 1985 to 2013 Landsat imagery to identify the terminus change of this glacier since 1985. In each image the red arrow indicates the 2013 east side of the terminus, the pink arrow a rock knob adjacent to the 1985 terminus, and the yellow arrow a peninsula that should become an island as the further retreat occurs. In 1985 there is no evidence of the peninsula, the lake is relatively round, and has a north-south length of 1250 m. By 2000 the glacier has retreated sufficiently to expose the peninsula at the yellow arrow. The lake is now 1450 m from north to south. Neither of the images indicates many icebergs suggesting this is currently not a main mechanism of ice loss. By 2013 the peninsula is 450 m long, the north-south length of the lake is 1700 m. The retreat of 450 m in the 28 year period is nearly 30 m/year, a similar rate to the 1951-2000 period. The 2012 Google Earth image indicates a few small icebergs in the lake, again suggesting that despite some calving this is not a main glacier volume loss. The glacier front remains active and crevassed, suggesting that retreat will remain slower than for nearby Fourpeaked, Excelsior or Bear Glacier.
spotted glacier 1985
1985 Landsat image

spotted glacier 2000
2000 Landsat image

spotted glacier 2013
2013 Landsat image

spotted glacier ge 2012
2012 Google Earth image

Fourpeaked Glacier Retreat, Katmai area, Alaska

Fourpeaked Glacier drains east from the volcano of the same name in the Katmai region of southern Alaksa. The Park Service in a report (Giffen et al 2008) noted that the glacier retreated 3.4 km across a broad proglacial lake that the glacier terminates in from 1951-2986, a rate of 95 m/year. From 1986-2000 they noted a retreat of 163 m, or 13 m/year. In a more recent report with the Park Service Arendt and Larsen (2012) provide a map of the change in glacier extent from 1956-2009, Figure 4, but note the poor data overall on historic changes of Fourpeaked. Here we utilize Landsat imagery to examine retreat from 1981 to July 2014.
fourpeaked ge
Google Earth image
A Landsat 2 image from 1981 with relatively low resolution indicates much of the proglacial lake still occupied by ice, but much of this is floating icebergs detached from glacier, which is hard to distinguish in this image. In each image the red arrow is the 1985 terminus and the yellow arrow is 2013-2014 terminus. In 1985 the terminus is at the red arrow, with considerable floating ice still evident that is not part of the glacier. The snowline, purple dots, is at 750-800 m though this is not near the end of the summer. By 2000 the floating ice is gone, and the terminus has retreated into a narrower inlet. The snowline is at 850 m. By 2013 the glacier has receded further up this inlet and the width of the lower glacier is less. This is a July image and the snowline is still relatively low. In the July 2014 image the snowline is quite high at 700 m, given that this is mid-summer. It is not apparent in the Landsat image, but the large local forest fires in the spring could reduce albedo and enhance melt this summer. The terminus has retreated 1.9 km from 1986 to 2014 a rate of 68 m/year. The retreat from 1981-2000 was fed by calving in a broad proglacial lake. From 2000-2014 the retreat has continued despite the narrowing of the calving front. That the glacier has narrowed even more and thinned in the lower reach is indicative of a retreat that will continue. This glacier is behaving like other Katmai area glaciers, Giffen et al (2008) noted that 19 of 20 are retreating. The glacier retreat has led to formation and expansion of a large lake much like other glaciers in the region; Bear Glacier, Excelsior Glacier and Pedersen Glacier. The last image is an animated gif created by Espen Olsen illustrating the change in the glacier. Katmai 1981
1981 Landsat image

katmai 1985
1985 Landsat image

katmai 2000
2000 Landsat image

katmai 2013
2013 Landsat image

katmai 2014
2014 Landsat image

mauri
Espen Olsen animated gif of Landsat images