Yakutat Glacier Terminus Collapse, 10 km retreat 1987-2016

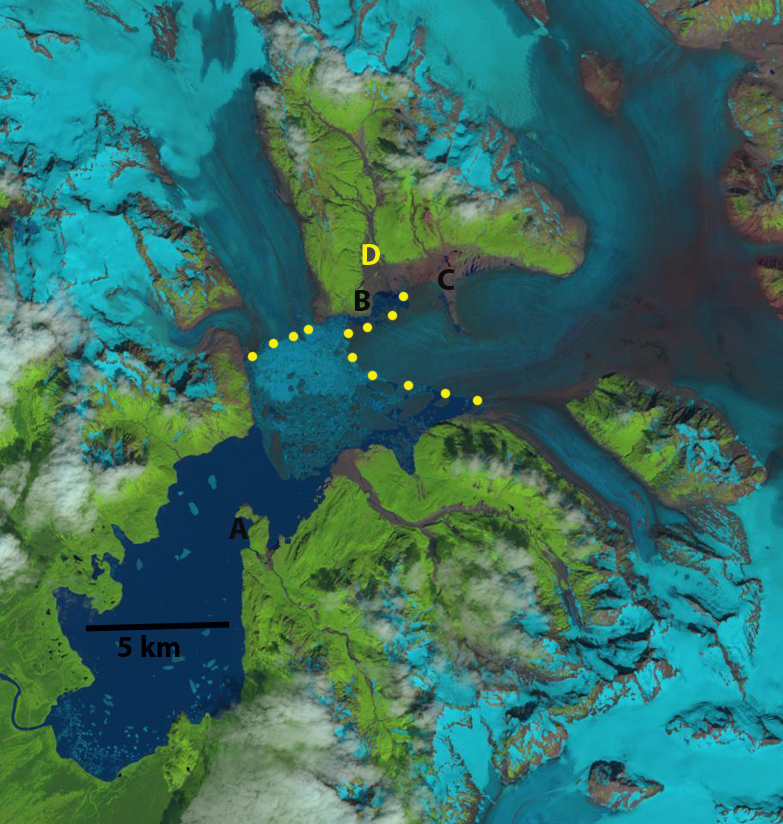
Landsat images from 1987 and 2016 with terminus indicated by yellow dots. Point A indicates the 1987 terminus location and Point E the 2016 terminus location. 

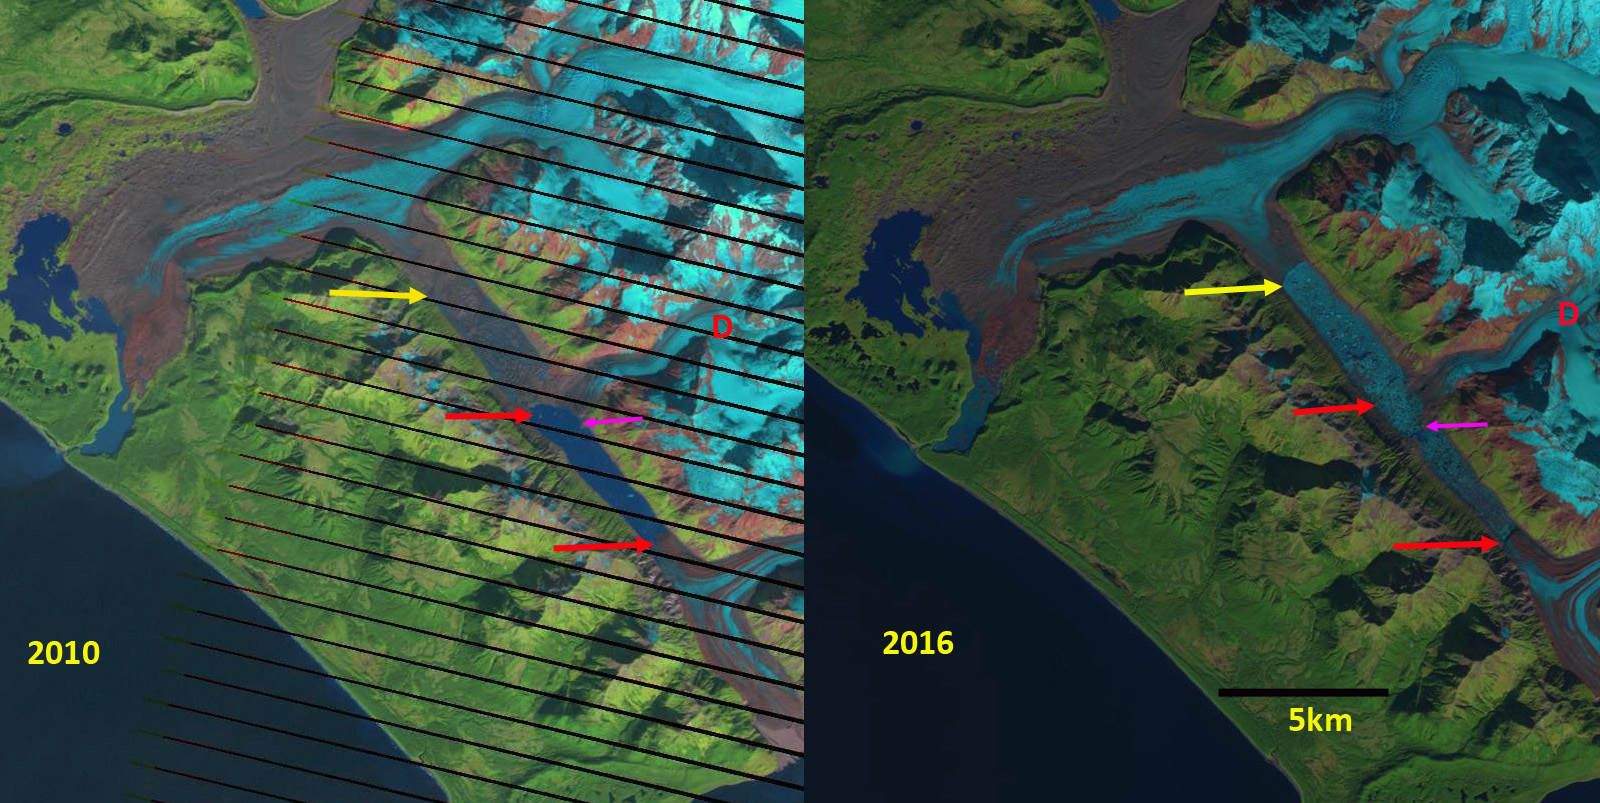
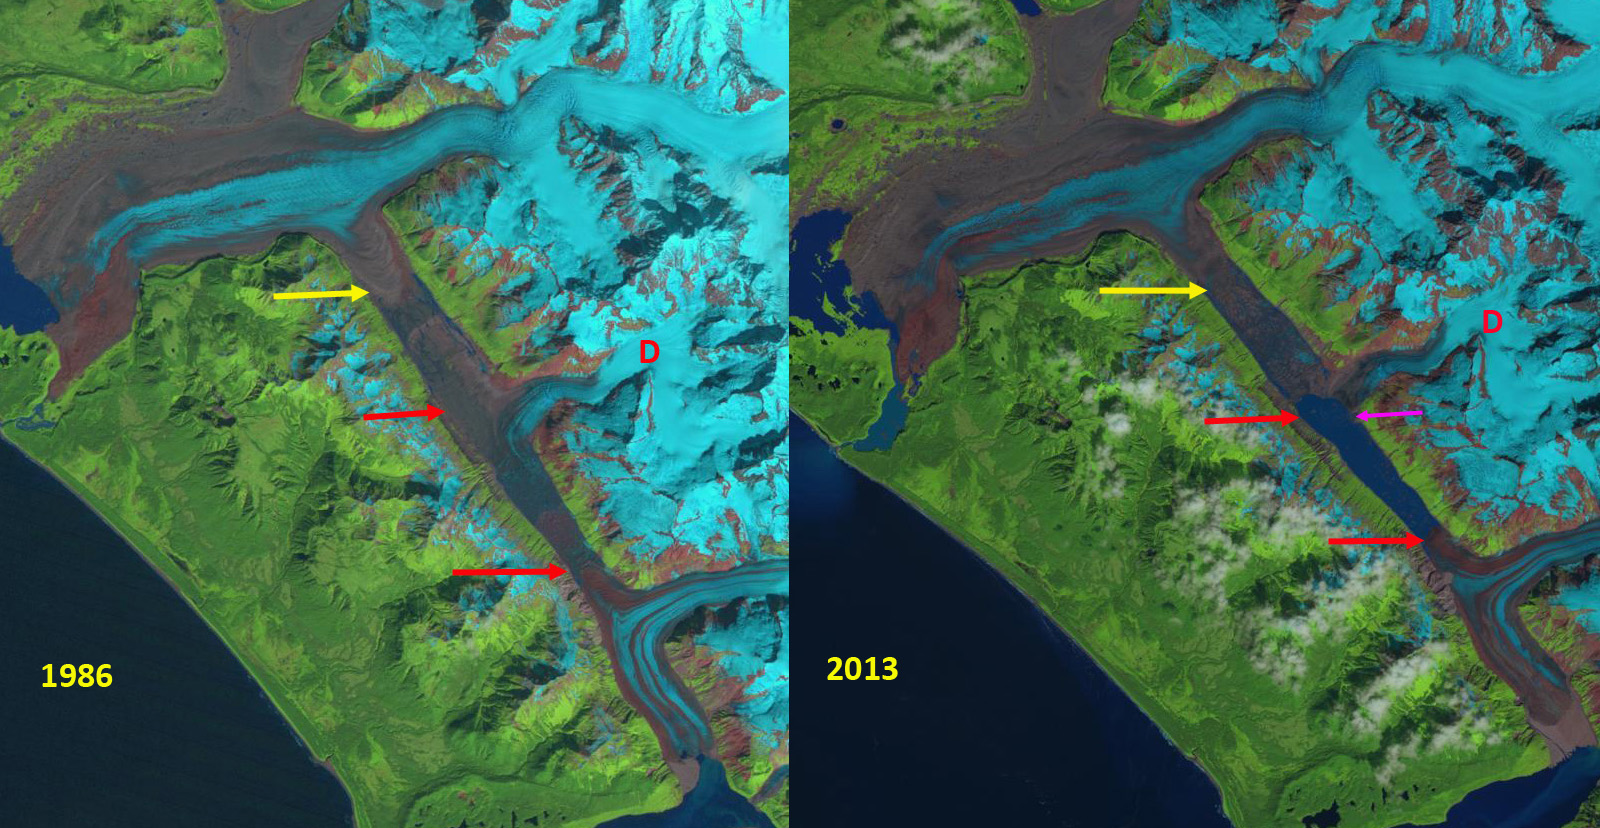
The Yakutat Glacier during the 1894-1895 Alaskan Boundary Survey ended near a terminal moraine on a flat coastal outwash plain. By 1906 the glacier had retreated from the moraine and a new lake was forming. Harlequin Lake. Surveys of the terminus of the glacier indicated a retreat of 1 kilometer in that decade. From 1906-1948 the glacier retreated an additional 5 km. From 1948-1958 the glacier retreated 3.6 km. The retreat is evident in comparing the Yakutat B-3 quadrangle, from 1958 photography, and Landsat imagery from 1987, 2010, 2013 and 2016. Points A-E are the same in each image and the yellow dots are the terminus. In 1987 the terminus was just retreating from a peninsula marked A, the valley at D was filled with ice, there was no break in the surface at C and B was well inland of the terminus. By 2010 the glacier had retreated from A, the valley at D was deglaciated, a small strip of bedrock-sediment was exposed at C from what had been beneath the glacier, and B was still well inland of the terminus. By 2013 the northern arm of the glacier had retreated 6.4 km from the peninsula at A toward the peninsula at B. The central arm of the glacier toward C had retreated 7.5 km and the retreat on the southern edge of the glacier was 6.5 km. The glacier had retreated on average more than 6.6 km in 27 years, a rate of 240 m/year.  From 2013 to 2016 the glacier had retreated from Point B to Point C on the northern side and to Point E on the southern side this is a distance of 10.2 km in thirty years 340 m/year. 

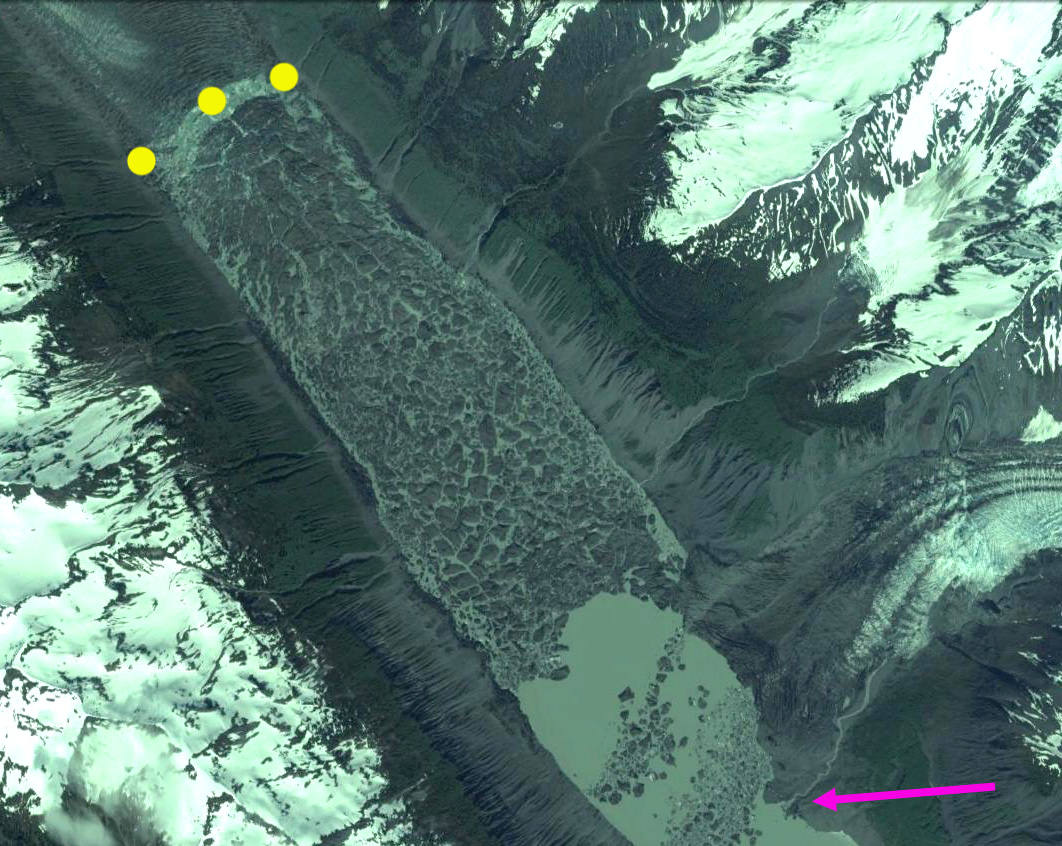
Recently the glacier has been the focus of a study by the University of Alaska, Faribanks they have set up a time lapse camera to record frontal changes. The goal is to understand the controls on calving into Harlequin Lake of this glacier. More amazing than the retreat has been the observed thinning of the glacier. The glacier has thinned by more 200 m on average according to the preliminary thickness change maps from the UAF project (Truessel et al 2013) and updated by Truessel et al (2015). The Yakutat Glacier does not have a high accumulation zone and the recent increase in the snowline elevation and thinning of the glacier have led to a substantial shrinking of the accumulation zone and thinning of the glacier in the accumulation (Truessel et al 2013). This glacier does not have a persistent significant accumulation zone and cannot survive (Pelto, 2010), Truessel et al (2015). modelling suggests the glacier will disappear between 2070 and 2110 depending on the warming scenario.  For a calving glacier to be in equilibrium it needs to have at least 60 % of its area snowcovered at the end of the summer. The glacier is in the midst of a large ongoing retreat. The retreat rate and calving mechanism is similar to that of Grand Plateau Glacier, Bear Lake Glacier and Gilkey Glacier. However, unlike these Yakutat Glacier lacks an accumulation zone, a better analog is East Novatak Glacier, which also has a lower elevation accumulation zone.


Yakutat terminus map


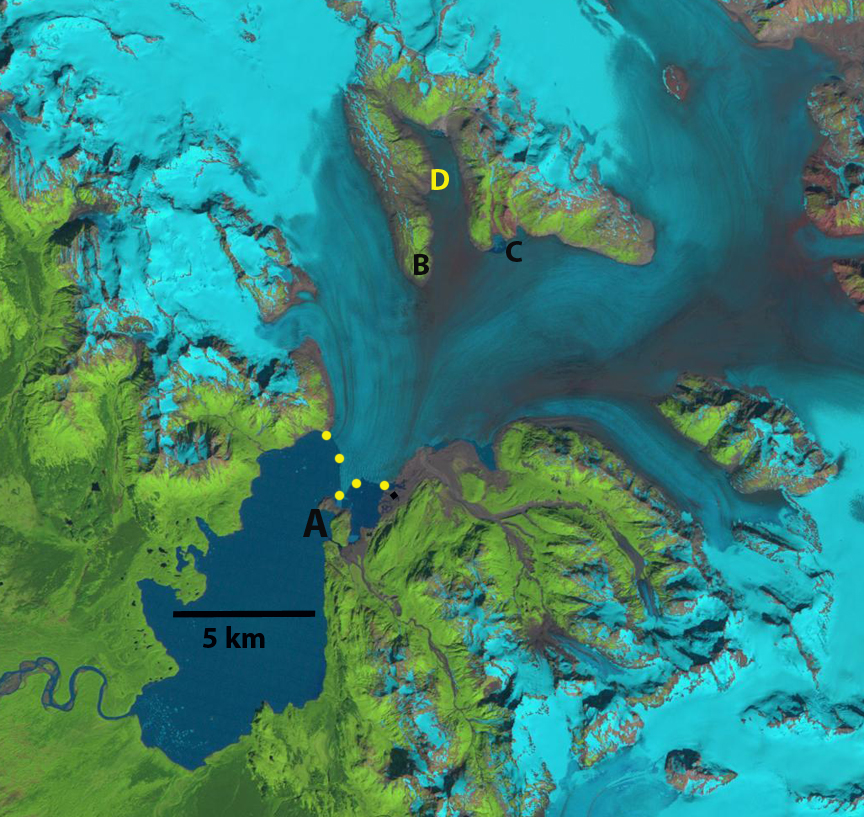
2010 Landsat image with terminus indicated by yellow dots.


2013 Landsat image with terminus indicated by yellow dots.


Desolation Valley, Alaska, Conversion from Glacier to Lake


desolation-compare

Retreat of Desolation-Fairweather Glacier from 2010-2016 in Landsat images.  The red arrow indicates 2010 terminus positions, yellow arrow the 2016 terminus. Pink arrow a delta exposed by lake level lowering. D=Desolation Glacier.

Desolation Glacier flows west from the Fairweather Range into Desolation Valley where in 1986 it joined with the Fairweather Glacier flowing from the north and the Lituya Glacier flowing from the south to fill the valley with glacier ice.  This is no longer the case, the valley once known for its long relatively flat area of largely debris covered ice, is mostly a lake now.  The valley has developed along the Fairweather Fault. Molnia (2007) noted that the tidewater termini of Lituya Glacier advanced ∼ 1 km since 1920 and continued to advance up to 2000 as it built an outwash plain reducing calving. Larsen et al (2015) noted thinning rates of 3 m per year for the Desolation Valley from Desolation Glacier north to Fairweather Glacier in the last decade (1994-2013).  Alifu et al (2016) identified that Desolation Glacier and Fairweather Glacier have lost 2.6% and 2.2% of their glacier area, respectively from 2000-2012. Only minor surface area changes were seen in Lituya Glacier during this period. They also noted that the mean snow line altitude of Fairweather, Lituya and Desolation increased by 120–290 m. Since 2012 extensive ice loss of the Desolation-Fairweather complex has occurred.  This is similar to the large rise in the transient snowline/equilibrium line noted by Pelto et al (2013) on nearby Brady Glacier.

In 1986 The Desolation Valley was filled with glacier ice from Fairweather Glacier to Liutya Bay.  By 2010 the southern half of the valley from Lituya Glacier to the outlet of Desolation Glacier into the valley had opened up and the terminus of Desolation Glacier and Lituya Glacier were at the red arrows, this represented a 5.3 km section of glacier lost. In 2013 the northern half of the valley filled by the Desloation-Fairweather Glacier was breaking up but still ice filled.  The Google Earth image from 2014 illustrates how broken up.  By 2016 the collapse was total and the new terminus is at the yellow arrow a 5.5 km retreat since 2010, this is a loss of 6.5 square kilometers of ice. The lake level also dropped which led to exposure of a lacustrine delta that had been submerged in 2013 and 2014, pink arrow. The lake has expanded in area, but lost in mean depth.  Will this continue to be a lake with continued retreat or become a braided river valley as the Fairweather Glacier continues to thin and retreat?  Desolation Glacier is no longer calving and its retreat rate should slow.  The terminus of the Fairweather Glacier should continue to retreat via calving in a fashion similar to glaciers around the world terminating in extensive lakes. Just to the north the North Fork Grand Plateau Glacier also experienced a large recent retreat with Landsat imagery in 2013 and 2014 indicating extensive calving from 2013 to 2015 and a retreat of 3.0 km, 1.5 km/year.  Fingers Glacier  is another nearby glacier that also is experiencing widespread retreat.  More images of the region are in a field blog on the region.

desolatiion-1986-2013

Retreat of Desolation-Fairweather Glacier from 1986 and 2013 in Landsat images.  The red arrow indicates 2010 terminus positions, yellow arrow the 2016 terminus. Pink arrow a delta exposed by lake level lowering. D=Desolation Glacier.

desolation-breakup

Google Earth image from 2014 of the disintegrating debris covered glacier.