Scott Glacier, Alberta Retreat 1987-2019

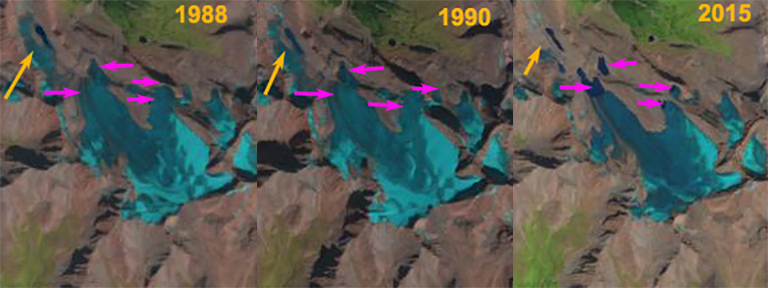
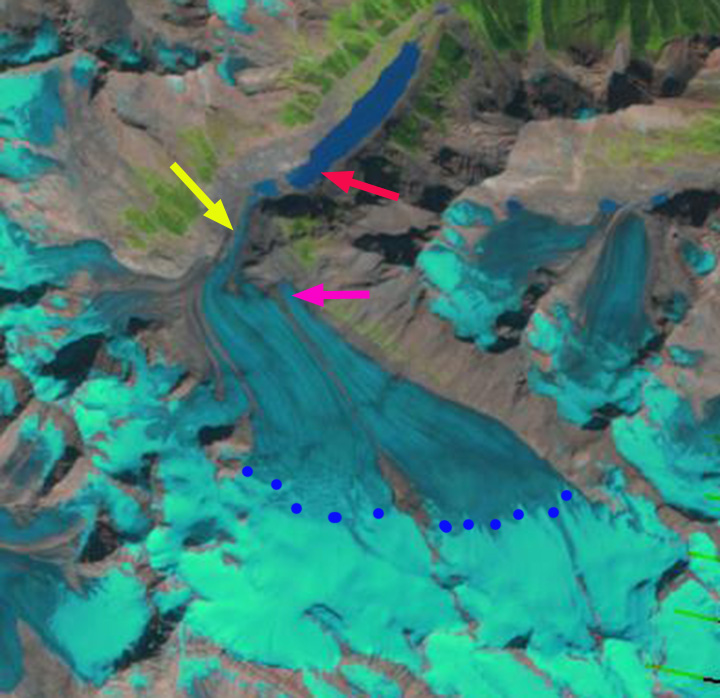
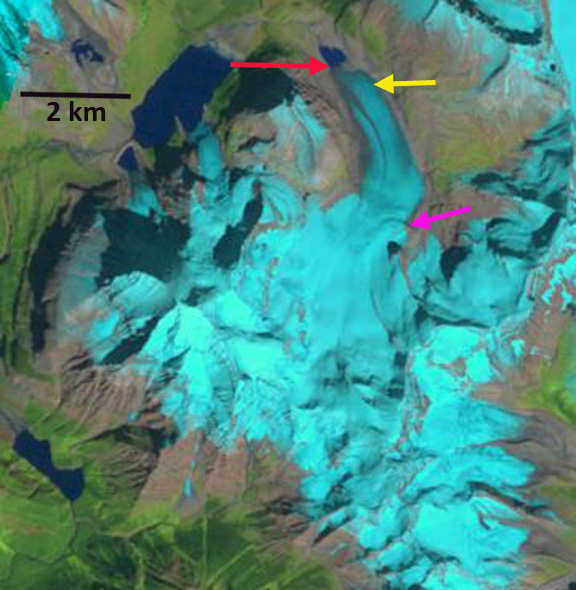
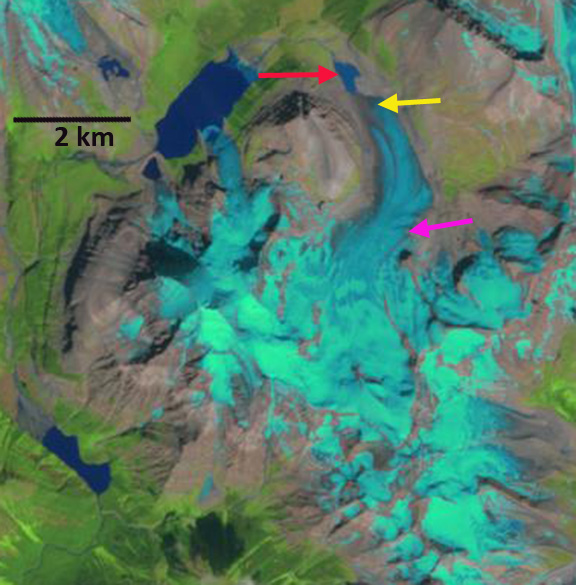
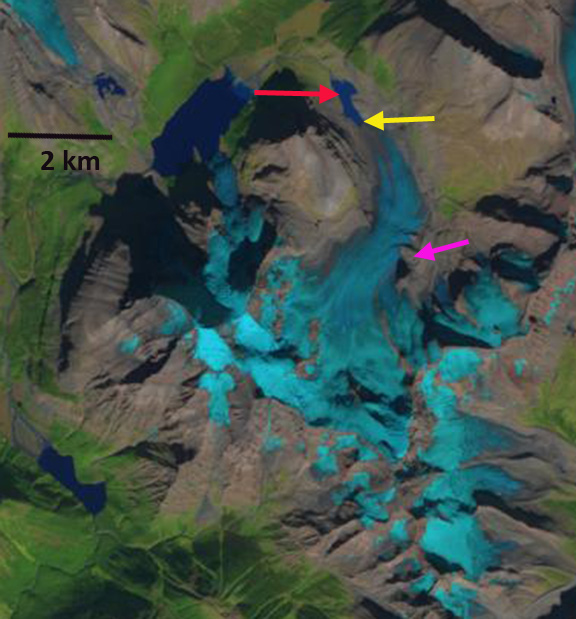
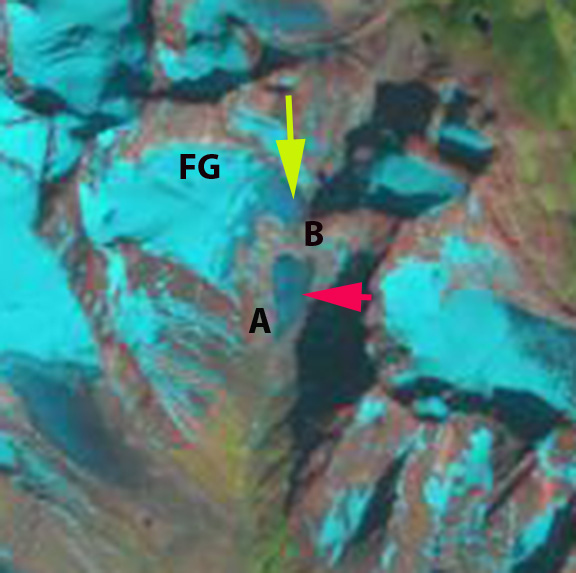
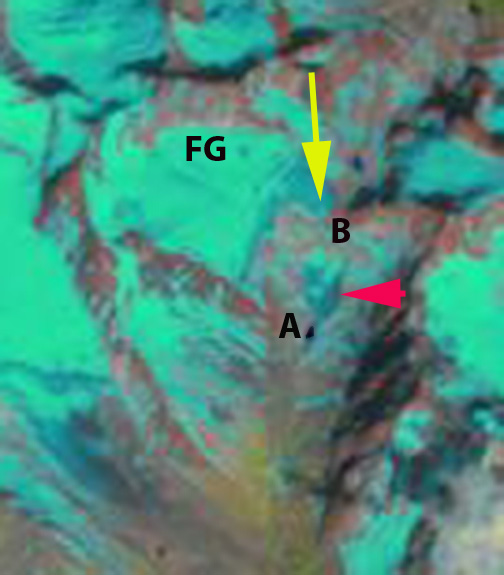
Scott Glacier, Alberta in 1987 and 2019 Landsat images. Yellow arrow indicates the 2019 terminus location and Point A and B are areas of bedrock expansion amidst the glacier.

Scott Glacier is the largest outlet glacier of the Hooker Icefield the drains into the Whirpool River and then the Athabasca River.  The icefield straddles the BC/Alberta border. Jiskoot et al (2009) examined the behavior of the Clemenceau-Chaba Icefield, 25 km south finding that from the mid 1980’s to 2001 the Clemenceau Icefield glaciers lost 42 square kilometers, or 14% of their area. On Columbia Icefield 60 km to the southeast Tennant and Menounos (2013) found that from 1919-2009 glaciers had a mean retreat of 1150 m and mean thinning of 49 m for glaciers, with the fastest rate of loss from  2000-2009.

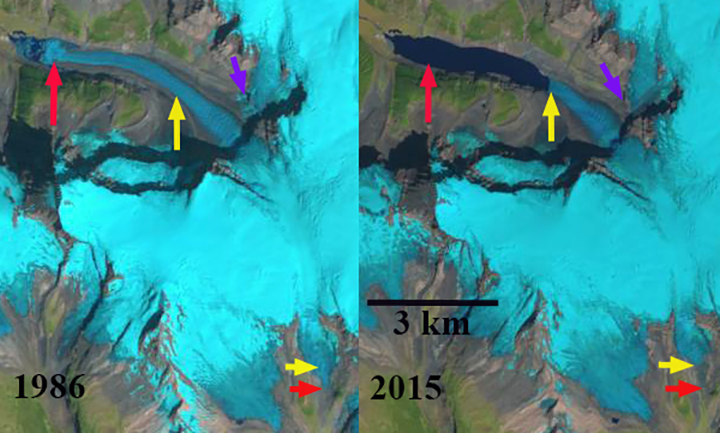
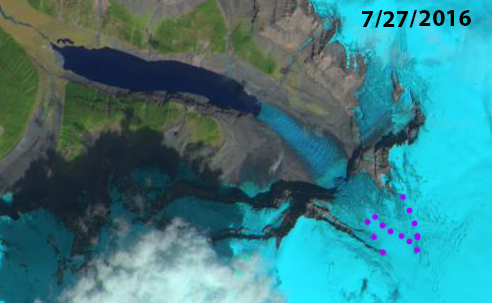
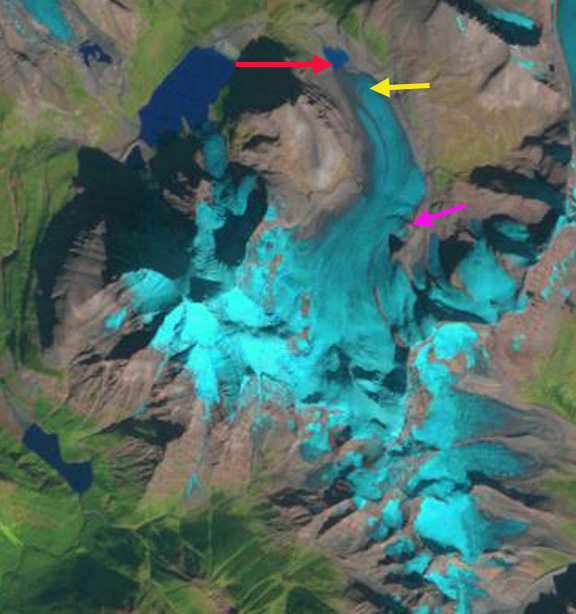
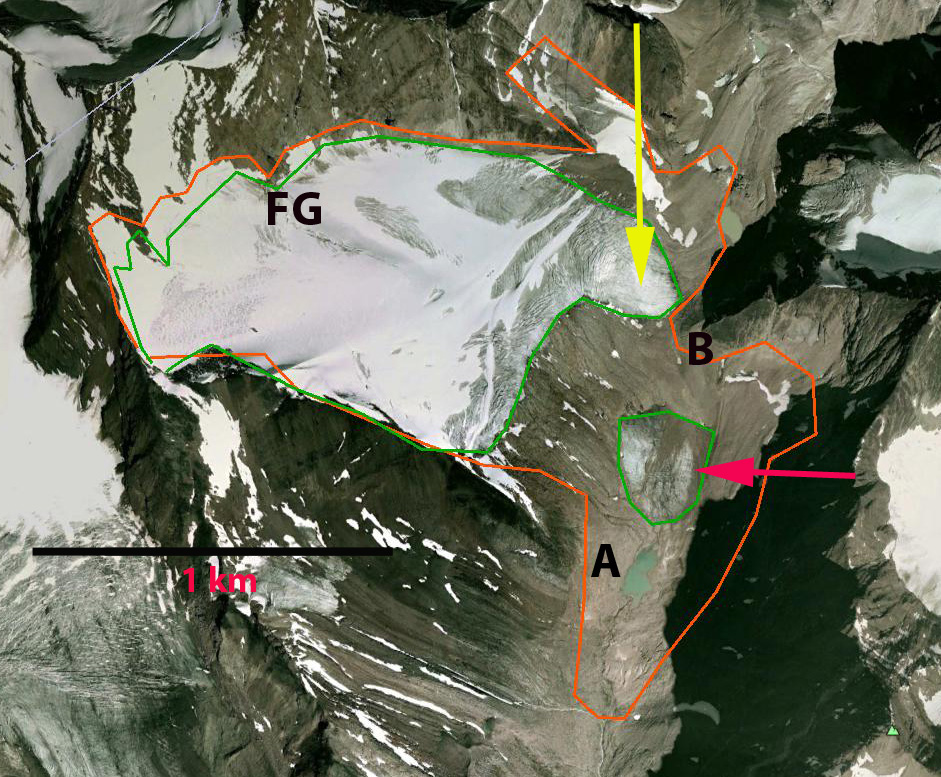
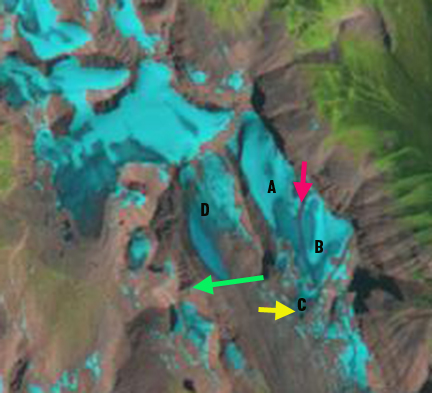
The Scott Glacier in 1987 had terminated at 1500 m, within 300 m of an alpine lake.  At Point A there is a convex aspect to the glacier as it passes over a subglacial knob.  The snowline is near this knob at 2200 m.  In 1998 there is limited retreat of the main terminus and Point A is still beneath the ice. The snowline is just above Point A at 2250 m. In 2014 the glacier has retreated to the base of a step at ~1800 m.  The snowline is well above Point A at 2450 m.  In 2019 the terminus has retreated 750 m since 1987.  Point A has emerged as a bedrock knob at the glacier surface.  At Point B a rock rib has widened since 1987 and extends further into the heart of the glacier. The snowline in 2019 is at 2400 m at the end of July.

Scott Glacier’s retreat is less extensive than other nearby glaciers such as Chaba Glacier ,  Cummins Glacier and  Columbia Glacier.

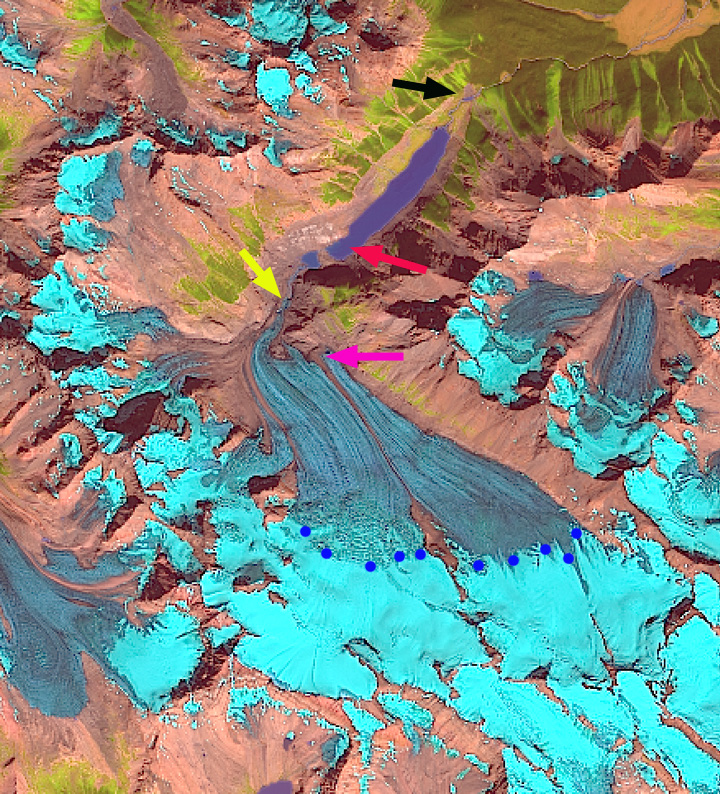
Scott Glacier, Alberta in 1998 and 2014 Landsat images. Yellow arrow indicates the 2019 terminus location and Point A and B are areas of bedrock expansion amidst the glacier.

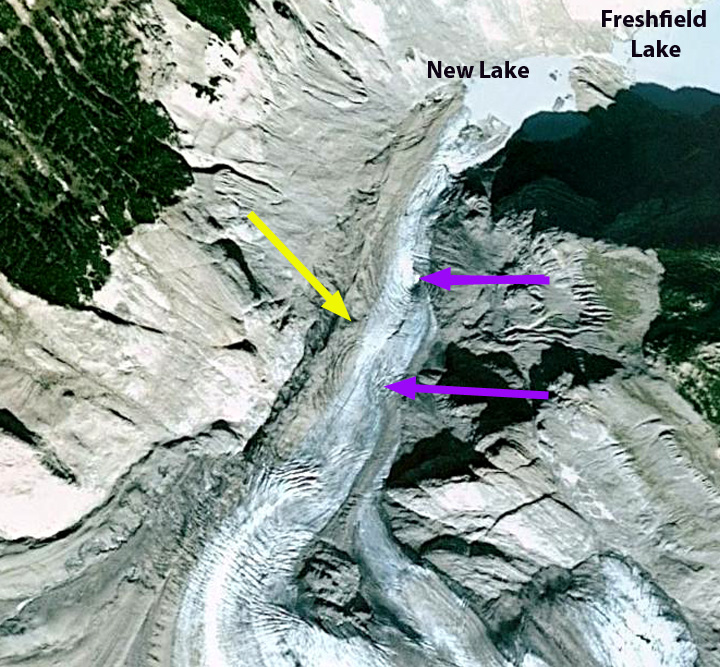
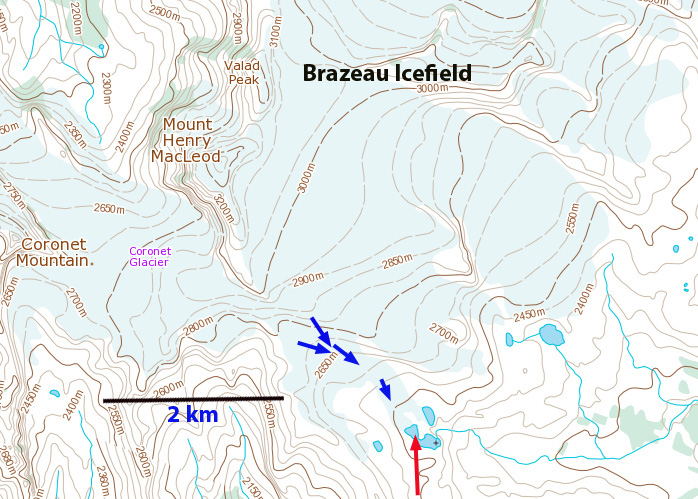
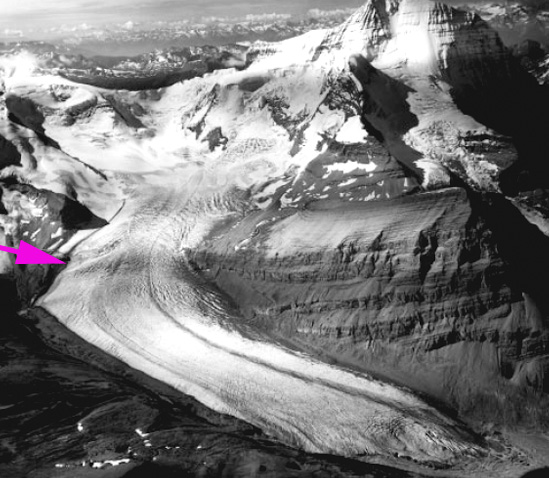
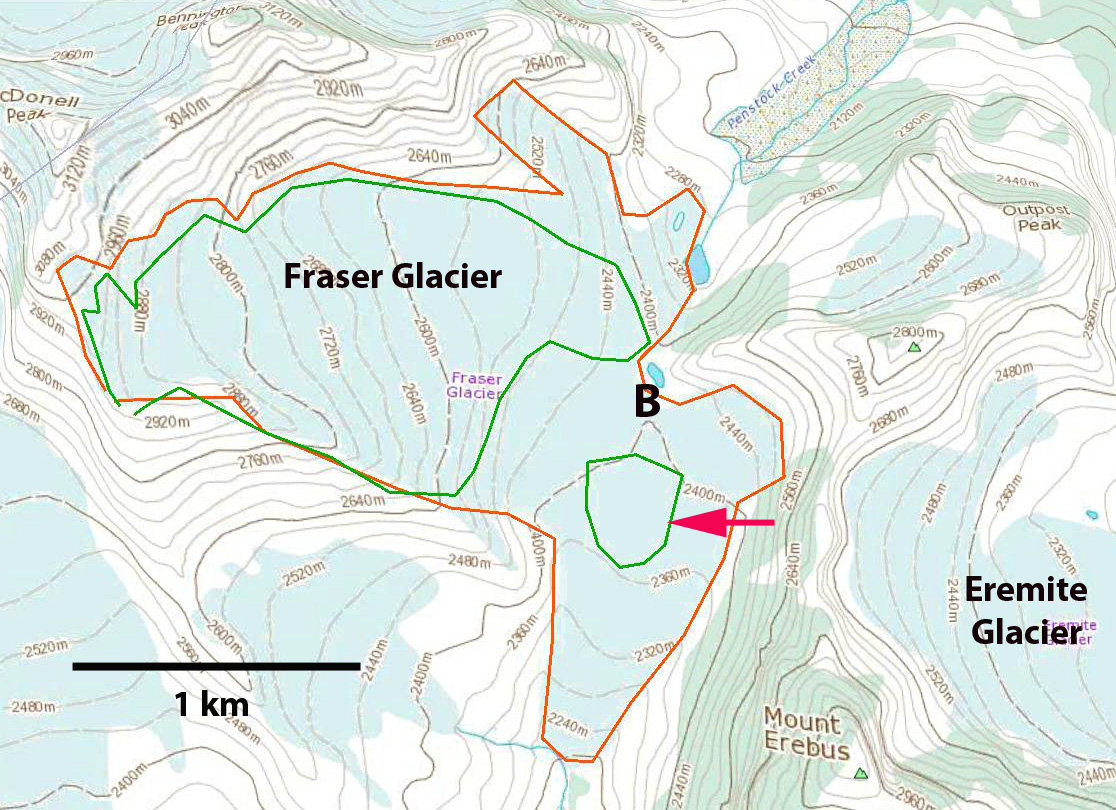
Scott Glacier map indicating the glacier margins in the 1990’s.


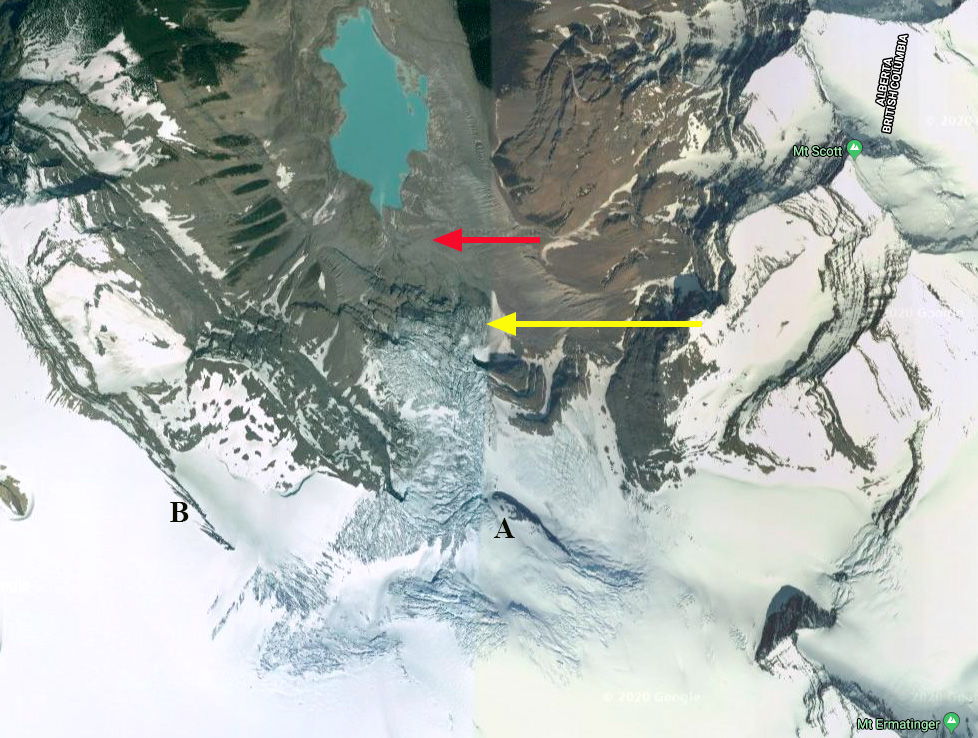
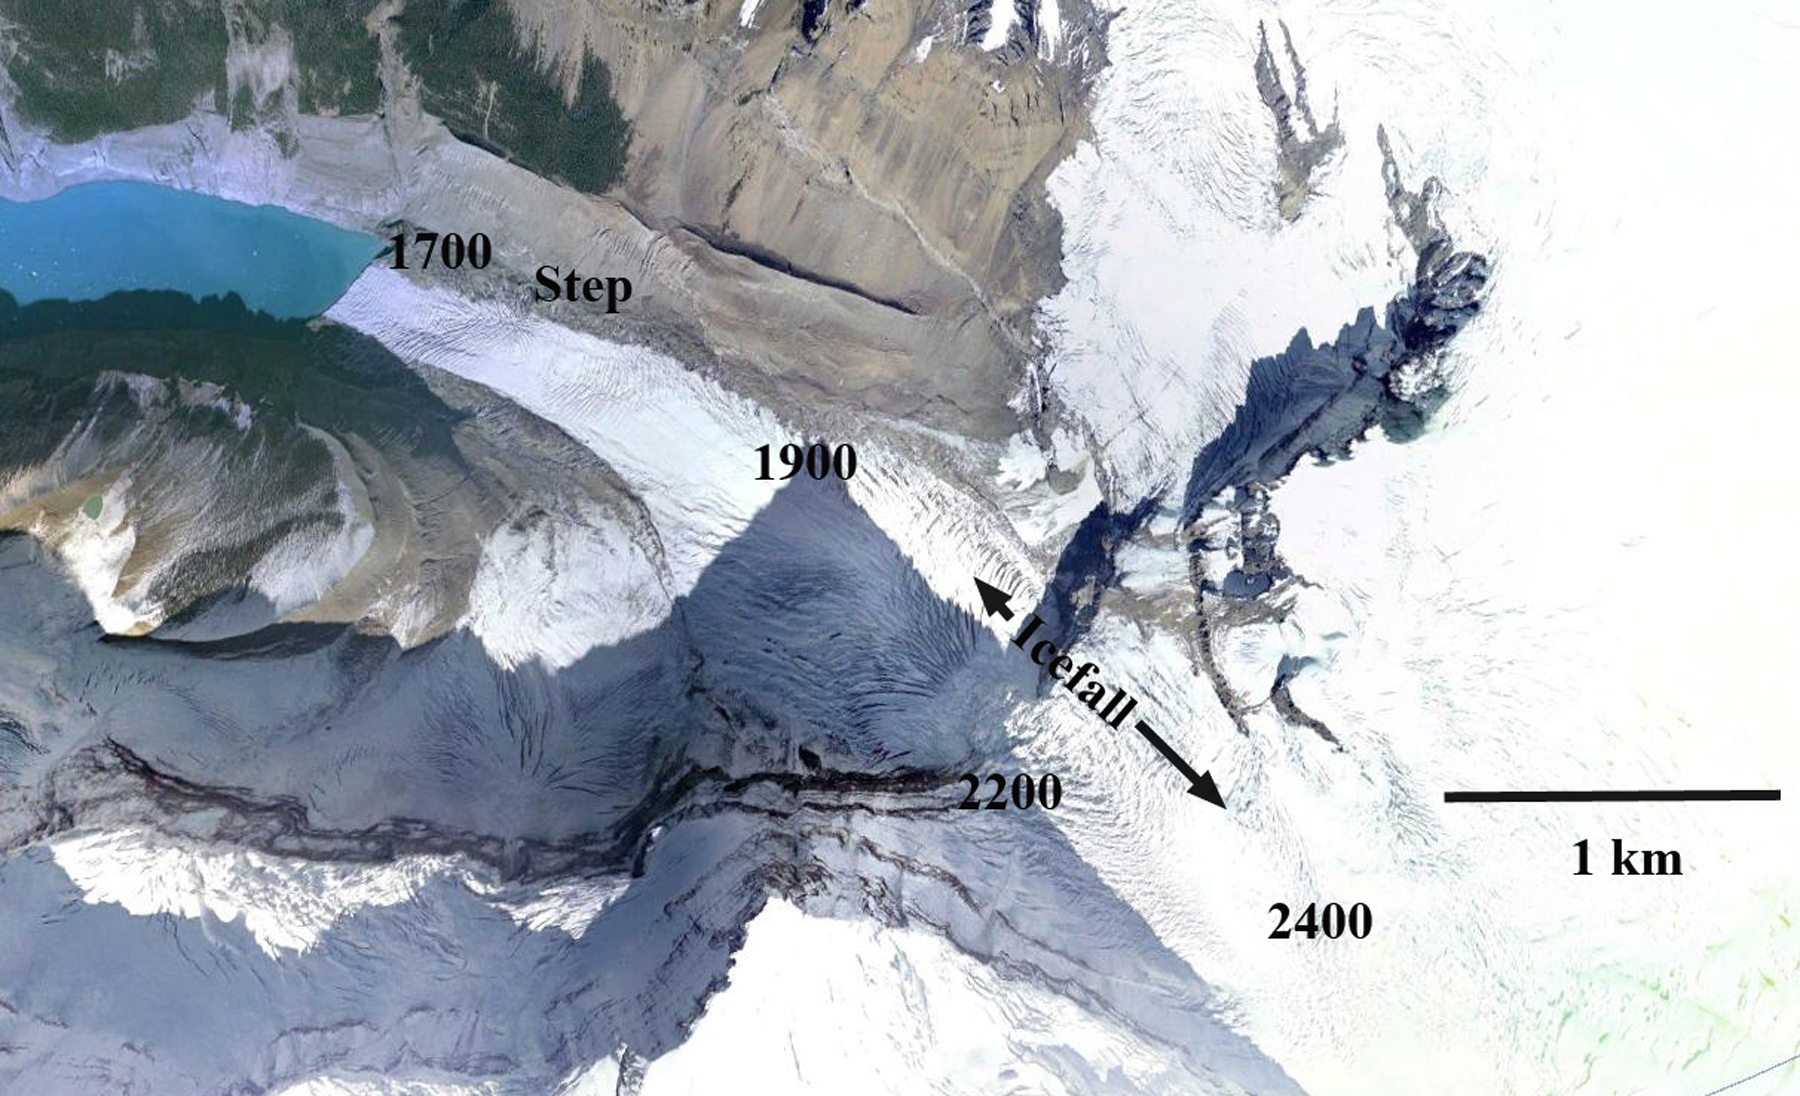
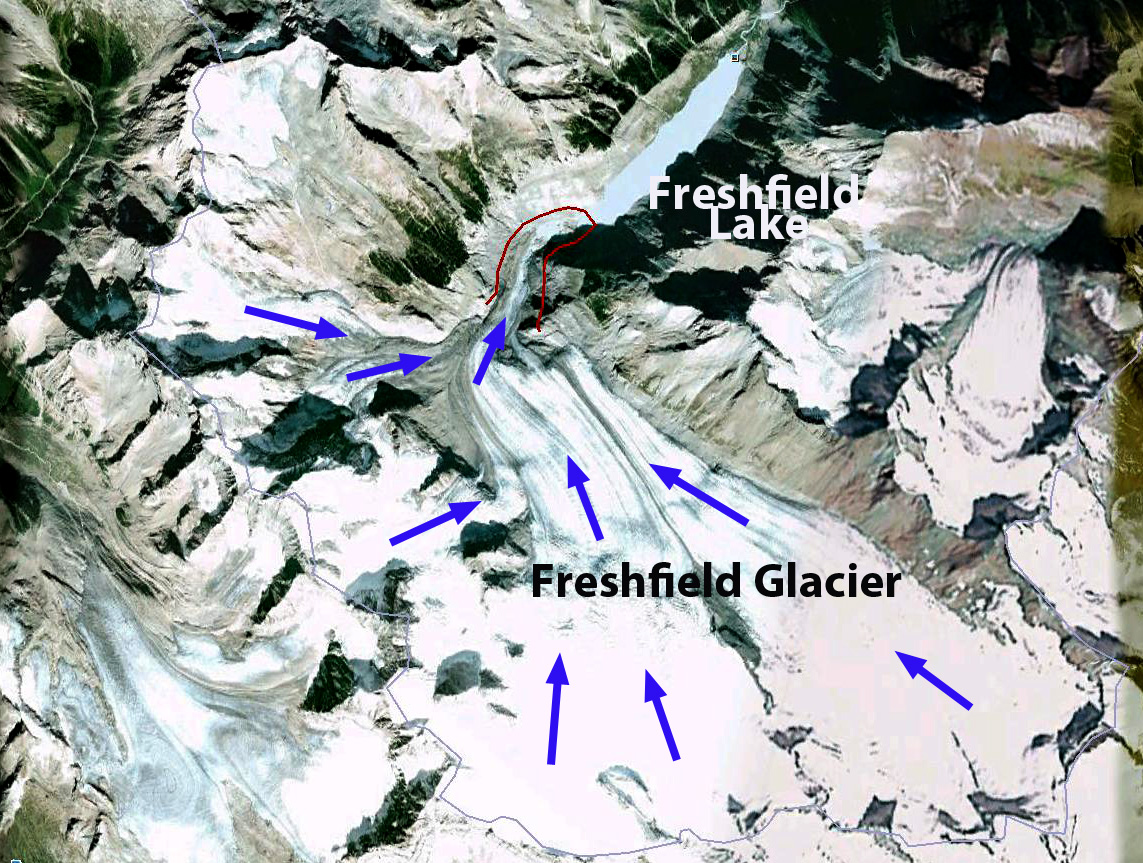
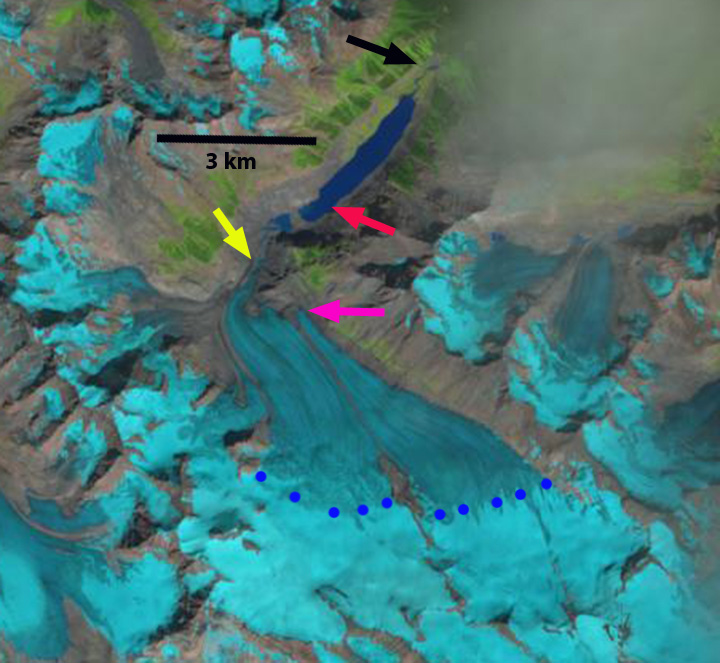
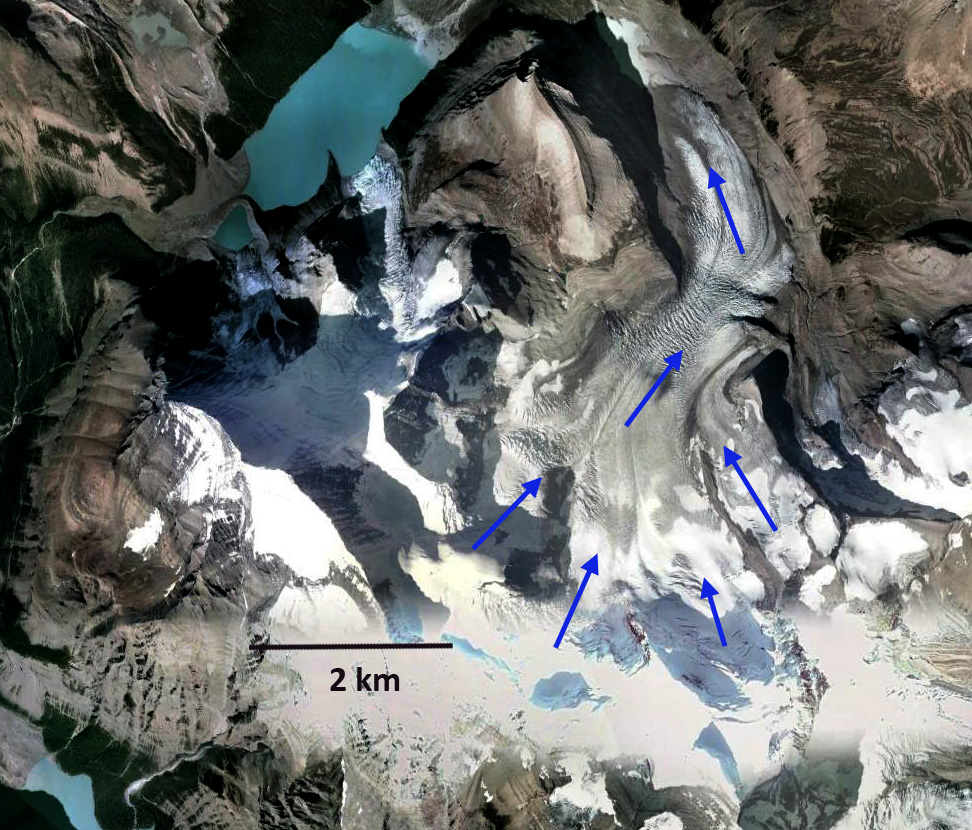
Scott Glacier Digital Globe image indicating 1987 terminus location (red arrow) and 2019 terminus location yellow arrow. Point A is where bedrock is emerging and Point B is where the bedrock ridge is extending across glacier. Both Point A and B indicate bedrock steps that the glacier steepens as it flows over. The glacier remains crevassed to the front indicating no stagnant zone.


Bonnet Glacier, Alberta Retreat & New Lake Formation

Bonnet Glacier, Alberta compared in Landsat images from 1987 and 2016. The red arrows mark the 1987 terminus, yellow arrows are the 2016 terminus location and the orange arrow notes a separate glacier that has disappeared.

Bonnet Glacier is at the headwaters of Douglas Creek that feeds into the Red Deer River.  The glacier drains north from Bonnet Peak in the Sawback Range 30 km east of the crest of the Rocky Mountains and 40 km north of Banff.   Here we examine changes in this glacier from 1987 to 2016, a period when retreat has led to the formation of new alpine lakes. An inventory of glaciers in the Canadian Rockies indicate area loss of 15% from 1985 to 2005 (Bolch et al, 2010), with Alberta glaciers losing area at a higher rate.  Tennant et al (2012) noted that from 1919-2006 the glaciers in the central and southern Canadian Rocky Mountains lost 40% of their area.  Of the 523 glaciers they observed 17 disappeared and 124 separated. The more famous Columbia Icefield, 125km northwest, has lost 23 % of its area from 1919-2009 with ice loss at a minimum during the 1970′s (Tennant and Menounos, 2013)

In 1987 the glacier had two primary termini, red arrows with no evident proglacial lakes at either terminus, red arrows.  In 1987 the glacier spilled over a bedrock bench shortly above the terminus in both cases onto a lower bench   The glacier has 25% retained snowpack.  The orange  arrow indicates a small avalanche fed glacier on the east side of the ridge extending north from the glacier. In 1988 the lack of proglacial lakes is noted at the pink arrows.  The retained snowpack is again 25% of the glacier area, well short of the 50-60% needed for a glacier to be in equilibrium. In 1990 the snowcovered area is 30% there is a small lake developing at the northern most terminus. In 2015 four new alpine lakes have formed two are separated from the glacier due to retreat, with both active termini also terminating in lakes. The retained snowpack covers 10% of the glacier in 2015. In 2016 snowcover is retained on 20% of the glacier. The glacier has lost 20% of its total area since 1987 with the main terminus retreating 900 m and the secondary terminus 425 m.   The 900 m retreat is ~20% of the total glacier length. The lack of retained snowcover even in these August Landsat images indicate a glacier that cannot survive current climate. The retreat is less impressive than on the larger Freshfield Glacier  and more in line with retreat and separation seen on Conway Glacier  and Fraser Glacier.

Bonnet Glacier, Alberta compared in Landsat images from 1988, 1990 and 2015. The pink arrows mark the locations where lakes developed after 1988 and the orange arrow notes a separate glacier that has disappeared.

Topographic map of the Bonnet Glacier region, Alberta.

Columbia Glacier, Alberta 3 km Retreat 1986-2015

Comparison of Columbia Glacier, which is the glacier flowing into the lake at top in 1986 and 2015 Landsat images. The red arrow is the 1986 terminus, yellow arrow the 2015 terminus position and purple arrow the tributary.

The Columbia Glacier drains the northwest side of Columbia Icefield into the Athabasca River in Alberta. The glacier in 1964 was 8.5 km long, by 1980 9.5 km long and in 2015 6.2 km long. The glacier drops rapidly from the plateau area over a major ice fall from 2400-1950 m.  The icefall leads to the creation of a series of ogives during the 1960-1990 period. Ogives are annual wave bulges that form at the base of an icefall due to differential seasonal flow velocity. Ommaney (2002) noted that the glacier advanced over one kilometer from 1966 to 1980 the glacier completely filled the large proglacial lake that now exists. By 1986 retreat had again opened the lake. Tennant and Menounos (2013) examined changes in the Columbia Icefield 1919-2009 and found a mean retreat of 1150 m and mean thinning of 49 m for glaciers of the icefield.  They noted that the fastest rate of loss on Columbia Icefield glaciers from 1919-2009 was during the 2000-2009 period.

In 1986 Landsat imagery the lake is 1000 m long. A 2004 Google Earth image indicates a step in elevation that is 500 m from the terminus.  Glacier elevation lags the basal elevation change; hence the end of the lake is between 500 and 1000 m from the 2004 terminus. By 2015 the lake is 4000 m long indicating a 3000 meter retreat from 1986-2015.  The rate of retreat has been less since 2004, 300 m, as the glacier approaches the upper limit of the lake basin.  When the glacier terminus retreats to this step, the lake will no longer enhance retreat via calving and retreat rates will diminish.  A further change is noted in the absence of ogives at the base of the icefall. As the icefall has narrowed and slowed the result has been a cessation of this process. The purple arrow indicates a tributary that joined the glacier below the icefall in 1986 that now has a separate terminus. The current terminus is still active with crevassing near the active front.  The snowline in both August 2015 and July 2016 is close to 2800 m.  A more detailed look at the 2016 mass balance conditions in the region just west of the glacier suggest Columbia Glacier had a more negative balance than in the Columbia River basin. With time left in the ablation season the snowline is at too high of an elevation to sustain strong flow through the icefall.  The retreat is more extensive than the more famous and oft visited glaciers draining east from the icefield Athabasca Glacier and Saskatchewan Glacier.

A 2004 image of the glacier indicating the ogive band, and step where the upper limit of the lake likely occurs. 

Sentinel image indicating the snowline at 2750-2800 m m on July 27, 2016. 

Rapid Retreat of Freshfield Glacier, Alberta 1964-2014

The Freshfield Glacier is a large glacier southeast of the Columbia Icefield in the Canadian Rockies where recent retreat  has exposed a new glacier lake.  Today the glacier is 9.8 km long beginning at 3070 meters and ending at 2000 m near the shore of the less than 5 year old lake. This glacier during the Little Ice Age stretched 14.3 km, one of the longest in the entire range extending beyond Freshfield Lake, which was a glacier filled basin. By 1964 the glacier had retreated 1900 meters exposing Freshfield Lake. From 1964-1986 the glacier retreated up this lake basin losing another 1200 meters of length. A comparison of a 1964 photograph from Austin Post and as close to the same view as I could get in Google Earth illustrates the 50 years of retreat. The red line halfway up the lake is the 1964 terminus and the red line at the edge of the lake the terminus location in the topographic map from the 1980’s.  Here we examine Landsat images from 1986 to 2014 to further illustrate the changes. Clarke et al (2015) published this week indicates that it is likely that 70% of glacier volume in western Canada will be lost by 2100. In their Figure 4, three of the four scenarios show Freshfield Glacier as surviving to 2100. The adjacent Conway Glacier is also retreating leading to new lake formation. freshfield total
Freshfield Glacier Google Earth view
 
1964 image of Freshfield Glacier from Austin Post
freshfield compare
Google Earth view of Freshfield Glacier, indicating 1964, 1986 and 2014 terminus positions.

In each image the red arrow indicates the 1986 terminus position, the yellow arrow the 2014 terminus, pink arrow terminus of the eastern portion of the glacier in 2014, and blue dots the snow line on the date of the images.  In 1986 the glacier still reaches the western end of Freshfield Lake, the snowline is at 2600 m and the eastern terminus reaches a bedrock step beyond the pink arrow.  By 1994 the glacier had retreated to the southwest shore of the now fully formed Freshfield Lake, the snowline was between 2600 and 2700 meters.  By 1998 has retreated several hundred meters from the shore of Freshfield Lake into a new basin terminating 600 m from the 1986 terminus location. The snowline is again near 2600 m.  The eastern terminus has retreated from the bedrock step.

By 2009 the terminus has retreated from the basin where it terminated in 1998 exposing a new lake that is 300 m long the terminus no longer reaches.  The lower 1000 meters of the glacier has a thin width suggesting the glacier terminus ice thickness is also thin.  A Google Earth image from 2005 indicates two  basins, circular depressions above the terminus that indicate the collapsing and stagnant nature of the lower portion of the glacier.  The narrowness of the terminus reach is also evident.   By 2013 the glacier has further retreated from the new lake and now ends near the base of the bedrock step.  The eastern terminus has retreated to the pink arrow.  The snowline in this Sept. 22, 2013 image is at 2700 m and is close to the end of the melt season position, the equilibrium line altitude. In 2014 the terminus has retreated 1700 m from the 1986 position and 2900 m from 1964.  This is a rate of approximately 60 m year over a span of  50 years. The glacier remains nearly 50% snowcovered both in 2013 and 2014, indicating a persistent and consistent accumulation zone. The glacier terminus is nearing a bedrock step, with active crevassing on this step. This suggests that the retreat rate should slow in the short term. This glacier remains large and is not in danger of disappearing with present climate. Its behavior mirrors that of the Apex Glacier and Columbia Glacier  but is less dramatic in terms of area loss than or the disappearing Helm Glacier. Glaciers in Alberta as a whole are losing a much greater percentage of their area than Freshfield Glacier as reported by Bolch et al (2010)freshfield glacier 1986
1986 Landsat image

freshfield glacier 1994
1994 Landsat image

freshfield glacier 1998
1998 Landsat image

freshfield glacier 2009
2009 Landsat image
freshfield ge terminus
2005 Google Earth image

Red Channel|Green Channel|Blue Channel
2013 Landsat image

freshfield glacier 2014
2014 Landsat image

Conway Glacier Separation and Retreat, Alberta

Conway Glacier drains east from the border with British Columbia into the Howse River. The Howse River joins the Saskatchewan River upstream of the Bighorn Hydropower project, which impounds Lake Abraham and produces 120 MW of power. The map of this area was updated based on 1990 images which indicate Conway Glacier is comprised of two lobes that join near the terminus.   An inventory of glaciers in the Canadian Rockies indicate area loss of 15% from 1985 to 2005 (Bolch et al, 2010).  The more famous Columbia Icefield, 50 km north, has lost 23 % of its area from 1919-2009 with ice loss at a minimum during the 1970′s (Tennant and Menounos, 2013)Here we examine Landsat imagery from 1986 to 2014 to see the impact of recent climate change.

conway glacier map

Map of Conway Glacier area from 1990 image.

In 1986 the two glaciers are still joined, with a surface lateral moraine at their junction, orange dots indicate this narrow surface rock band eroded from the ridge between the two lobes. The yellow arrow in each image indicates the 1986 terminus location of the northern lobe, the red arrow indicates a bedrock step near the southern lobe terminus, green arrow indicates an ice filled basin, and the purple arrow a small tributary joining the main glacier.  In 1986 the southern lobe extends 300 meters beyond the bedrock step.  By 1994 a small lake is developing at the basin indicated by the green arrow and the northern lobe is reduced in width.  Overall less than 40% of the glacier is snowcovered.  By 1998 the southern lobe has retreated to the bedrock step and the northern lobe has retreated from the end of the lateral moraine.  The glacier again is less than 40% snowcovered.  The 2013 image has better resolution thanks to the better Landsat 8 imagery, and has been sharpened using a higher resolution panchromatic image layer by Ben Pelto (Technique will be explained in a future post).  The glaciers are no longer joined.  The northern lobe has retreated 500-550 m since 1986 and a small lake has formed at the 1986 terminus location, another yellow arrow indicates 2013 terminus.  The northern lobe has retreated above the bedrock step, a total retreat of 500-600 m since 1986.  Two additional red arrows have been added to indicate 1986 and 2013 terminus location.  The small lake at the green arrow has expanded.  The tributary connection at the purple arrow is nearly severed.   Retained snowpack on the glacier is also limited in area with most of the glacier in 2013 being bare glacier ice. This indicates that snow was not retained in recent previous years either.  For a glacier to be in equilibrium it needs more than 50% of its area to be covered by snow at the end of the melt season, not  35% with a few weeks left in the melt season. as in 2013. This glaciers retreat and volume loss mirrors that of the region including Saskatchewan Glacier and Fraser Glacier.   Peyto Glacier is the nearest glacier, just 20 km southeast, with a long term mass balance record, which indicates a cumulative loss or over 28 m w.e or 30 m of glacier thickness.

conway glacier 1986a

1986 Landsat image

conway glacier 1994

1994 Landsat image

conway glacier 1998

1998 Landsat Image

Red Channel|Green Channel|Blue Channel 2013 Landsat image-Pan sharpened by Ben Pelto (Univ. Northern British Columbia)

Southwest Brazeau Icefield Retreat, Alberta

The Brazeau Icefield straddles high peaks southeast of Jasper, Alberta.  The northern outlet glaciers drain into Maligne Lake and the southern outlet glaciers drain in to Brazeau Lake and the Brazeau River.  The Brazeau River flows into Brazeau Reservoir a 355 MW hydropower facility, before joining the Saskatchewan River. An inventory of glaciers in the Canadian Rockies indicate area loss of 15% from 1985 to 2005 (Bolch et al, 2010).  The more famous Columbia Icefield to the west has lost 23 % of its area from 1919-2009 with ice loss at a minimum during the 1970’s (Tennant and Menounos, 2013). Here we examine an unnamed outlet glacier at the southwest corner of the Brazeau Icefield from 1995 to 2014 using Landsat imagery.

brazeau Icefield map

In 1995 the glacier terminated at the red arrow and was 1900 m long, orange dots mark the upper boundary.  The glacier had limited retained snowpack in 1995.  The poor clarity is do to forest fire smoke in the region.  In 1998 the proglacial lake where the glacier terminates is much clearer, snowpack is again limited, but more extensive than in 1995.  In 2002 retreat is evident as the lake is expanding as the glacier retreats.  The glacier still ends in the lake and still has limited snowcover.  In 2013 the glacier has retreated completely from the lake and snowcover is again limited.  The lack of snowcover is persistent in the satellite images which are typically not from the end of the melt season, hence even more snowcover will be lost.  Lack of a significant persistent snowcover area indicates a glacier that will not survive (Pelto, 2010). In 2014 the area experienced considerable forest fires, which leads to poor image clarity.  The glacier terminus is now significantly separated from the lake and terminates at the yellow arrow.  The distance from the yellow to the red arrow represents a 350-400 m retreat in 20 years.  The glacier has lost 20% of its length in this period.  This retreat is similar to that of Fraser Glacier and more significant given the small size of the glacier than for Saskcatchewan Glacier

brazeau icefield 1995

1995 Landsat image

brazeau icefield 1998

1998 Landsat image

brazeau sw 2002

2002 Landsat image

braeau sw 2013

2013 Landsat image

brazeau sw 2014

2014 Landsat image

Robson Glacier Retreat, Alberta

Robson Glacier is the largest glacier on the highest mountain in the Canadian Rockies. The glacier begins at 3200 m and drains northeast from the summit ending in a proglacial lake at 1720 m. The glaciers upper west side has heavy avalanche accumulation from Mount Robson’s upper slopes, note the 1964 photograph from the legendary USGS glacier guru Austin Post. The history of this glacier has been examined using tree rings and lichenometry. Heusser (1954) observed that the glacier reached its Little Ice Age Maximum arond 1780 and had retreated at a rate of 2 m/year from then until 1908 and at a rate of 16 m/year from 1908-1953. The terminus history up to 2006 is summarized in a map from Roger Wheate (UNBC)and Laura Thomson that indicates, a minor retreat of 300 m from 1850 to 1922, a rapid retreat from 1922-1950 of 1200 m, a readvance from 150 to the 1980’s of 300 m and a resumed retreat of 500 m from the 1980s to 2005. Here we examine satellite imagery from 1987-2014 to see more recent changes.
Robson map
Robson map from Wheate (2012)
robson 1964
Austin Post 1964 Photograph

In each image the red arrow indicates the 1987 terminus position, the yellow arrow the 2013 terminus position and the pink arrow a bedrock step on the east margin of the glacier. In 1987 the proglacial lake at the terminus is 350 m long. The bedrock step on the eastern margin is largely buried under the glacier and the snowline is at 2300 m though the melt season still has six weeks to go. In 1989 the terminus is not quite as wide and the snowline is at 2500 m. By 2002 the glacier has retreated 400 m with the proglacial lake having expanded into a new narrower section. The bedrock bench is more prominent adjacent to the glacier and now extends as a bare rock further into the main glacier. The snowline is at 2400 m. By 2006 the glacier has retreated an additional 100 m and the snowline is at 2500 m. There are two apparent bedrock ribs the upglacier one extends 300 m toward the glacier center from the east margin and the lower rib 150 m. This represents most of the flow from the eastern tributary of the glacier that extends only to 2800 m and has less avalanche contribution. By 2013 the glacier has retreated 700 m since 1987, a rate of 30 m/year. This is a more rapid rate than the retreat observed from 1908-1953.The snowline is just above 2500 m. In 2014 the terminus position is a bit obscured in this September image, the bedrock rib is more prominent than in 2006 and the snowline is again above 2500 m, with three weeks left in the melt season.

It is apparent that a zone of persistent and consistent accumulation remains above 2600 m on Robson Glacier, and that it can survive current climate change. The recent trends of a snowline above 2500 m indicates that retreat will continue in the near future in response to current climate. Both 2013 and 2014 have been warm summers leading to above average melt conditions that should lead to rapid thinning of the lower terminus tongue and rapid retreat in the next several years. Hopefully another satellite image will be obtained to indicate the end of season snowline (ELA). The retreat of the is glacier parallels that of Coleman Glacier just east of Mount Robson, Freshfield Glacier and Columbia Glacier.
robson 1987
1987 Landsat image

robson 1989
1989 Landsat image

robson 2002
2002 Landsat image

robson ge 2006
2006 Google earth image

robson 2013
2013 Landsat image

robson 2014
2014 Landsat image

Robson Glacier Retreat, British Columbia

Robson Glacier is the largest glacier on the highest mountain in the Canadian Rockies. The glacier begins at 3200 m and drains northeast from the summit ending in a proglacial lake at 1720 m. The glaciers upper west side has heavy avalanche accumulation from Mount Robson’s upper slopes, note the 1964 photograph from the legendary USGS glacier guru Austin Post. The history of this glacier has been examined using tree rings and lichenometry. Heusser (1954) observed that the glacier reached its Little Ice Age Maximum arond 1780 and had retreated at a rate of 2 m/year from then until 1908 and at a rate of 16 m/year from 1908-1953. The terminus history up to 2006 is summarized in a map from Roger Wheate (UNBC) and Laura Thomson that indicates, a minor retreat of 300 m from 1850 to 1922, a rapid retreat from 1922-1950 of 1200 m, a readvance from 150 to the 1980’s of 300 m and a resumed retreat of 500 m from the 1980s to 2005. Here we examine satellite imagery from 1987-2014 to see more recent changes.
Robson map
Robson map from Wheate (2012)
robson 1964
Austin Post 1964 Photograph

In each image the red arrow indicates the 1987 terminus position, the yellow arrow the 2013 terminus position and the pink arrow a bedrock step on the east margin of the glacier. In 1987 the proglacial lake at the terminus is 350 m long. The bedrock step on the eastern margin is largely buried under the glacier and the snowline is at 2300 m though the melt season still has six weeks to go. In 1989 the terminus is not quite as wide and the snowline is at 2500 m. By 2002 the glacier has retreated 400 m with the proglacial lake having expanded into a new narrower section. The bedrock bench is more prominent adjacent to the glacier and now extends as a bare rock further into the main glacier. The snowline is at 2400 m. By 2006 the glacier has retreated an additional 100 m and the snowline is at 2500 m. There are two apparent bedrock ribs the upglacier one extends 300 m toward the glacier center from the east margin and the lower rib 150 m. This represents most of the flow from the eastern tributary of the glacier that extends only to 2800 m and has less avalanche contribution. By 2013 the glacier has retreated 700 m since 1987, a rate of 30 m/year. This is a more rapid rate than the retreat observed from 1908-1953.The snowline is just above 2500 m. In 2014 the terminus position is a bit obscured in this September image, the bedrock rib is more prominent than in 2006 and the snowline is again above 2500 m, with three weeks left in the melt season.

It is apparent that a zone of persistent and consistent accumulation remains above 2600 m on Robson Glacier, and that it can survive current climate change. The recent trends of a snowline above 2500 m indicates that retreat will continue in the near future in response to current climate. Both 2013 and 2014 have been warm summers leading to above average melt conditions that should lead to rapid thinning of the lower terminus tongue and rapid retreat in the next several years. Hopefully another satellite image will be obtained to indicate the end of season snowline (ELA). The retreat of the is glacier parallels that of Coleman Glacier just east of Mount Robson, Freshfield Glacier and Columbia Glacier.
robson 1987
1987 Landsat image

robson 1989
1989 Landsat image

robson 2002
2002 Landsat image

robson ge 2006
2006 Google earth image

robson 2013
2013 Landsat image

robson 2014
2014 Landsat image

Fraser Glacier, Separation and Retreat Alberta

Fraser Glacier, Alberta on the southern flank of Bennington Peak in Jasper National Park drains into the Athabasca River not the Fraser River. The glacier was reported in the USGS satellite image atlas as having a length of 3.5 km in the 1970’s. In Canadian Topographic maps the glacier extends for over 3.0 km from 2900 m to 2200 m. Today the glacier is barely half that length. The glacier first separated and then the lower section has now melted away. Here we use Google Earth and Landsat imagery from 1996 to 2014 to identify the changes. Bolch et al (2010) noted that from 1985-200 Alberta Glaciers lost 25% of their area. Tennant et al (2012) noted that from 1919-2006 the glaciers in the central and southern Canadian Rocky Mountains lost 40% of their area. Of the 523 glaciers they observed 17 disappeared and 124 separated, Fraser Glacier falls into the latter category.
In each image Point A indicates the same location which after 2000 a small lake develops, Point B, is the location where the glacier separated into two parts. The red arrow indicates the lower section and the yellow arrow the position of the upper terminus in 2014. In the map the orange outline is the glacier boundary on the map, while the green line is the 2005 boundary.
fraser glacier map

By 1999 the glacier has separated into two parts, but no lake exists yet at Point A. By 2002 a small lake is developing at Point A and the separation between the upper and lower glacier has increased. By 2005, a Google Earth image indicates the diminishing lower section of the glacier is 300 m long and less than 200 m wide, separated from the upper glacier by 250 m. By 2013 the lower glacier is no longer evident, there could be a small remnant of debris covered ice, but it is essentially gone. The glacier now is just 1.6 km long having lost half its length from the mapped glacier and more than half since the satellite image analysis of the 1980’s. The upper margins of the glacier have changed little and some snowpack has been retained. This suggests that now with the entire glacier in the upper basin above 2400 m, the retreat should slow down,and that the glacier can survive current climate (Pelto, 2010). The retreat of this glacier is similar to Apex Glacier, Petain Glacier, Coleman Glacier and Mangin Glacier. The retreat fits the pattern noted by Tennant et al (2012), further Jiskoot et al (2009) noted that the glaciers of the nearby Chaba-Clemenceau Icefield are experiencing faster retreat rates in recent years. All of this loss in glacier area of course means less glacier runoff, since the area lost is greater than the increased melt rate from the remaining glacier area in Alberta. fraser glacier 2005
2005 Google Earth image

fraser 1996
1996 Landsat image

fraser 2002
2002 Landsat image

fraser 2013
2013 Landsat image

fraser 2014
2014 Landsat image

Mangin Glacier Retreat and Separation, Alberta

Mangin Glacier and its unnamed neighbor flow down the north slope of Mount Joffre, Alberta and drain into Kananaskis Lake. The glacier like the vast majority in Alberta has been losing area and volume during its retreat. Bolch et al (2010) noted that the glaciers in western Canada had on average lost 11% of their area from 1985 to 2005, 16% on the east slope of the continental divide in the Rocky Mountains of Alberta. A comparison of Landsat imagery from 1994 and 2013, Google Earth imagery from 2005 and the Canadian Topographic map published in 1994, based on early 1990’s aerial photographs. In the map Mangin Glacier was a single ice body that extended for 3.2 km ending in a small lake at 2575 m, sections A-C were all joined, green line is glacier boundary for the map and brown line the 2005 glacier margin. By 1994 section C, yellow arrow, has only a tenuous connection and is clearly going to separate from parts A and B. Further a ridge between A and B is beginning to develop, red arrow. By 2005 in the Google Earth image sections A and B are nearly separated by the expanding ridge and C is fully separated from A and B. By 2013 A and B are fully separated, this image is from mid-August with a month of melting to go. The light blue is snowcover and the darker blue is bare glacier ice. In another month the amount of snowcover will be very small. For example earlier this month on Sholes Glacier in the North Cascades we observed rapid expansion of the blue ice zone from 12, 500 square meters on Aug. 3 to 35,000 square meters on Aug. 9. The retreat of the unnamed glacier labeled D is apparent in the comparison of the 1994 and 2013 images, note the green arrow. This retreat is 300-400 m, with much of the retreat coming after 2005. Mangin Glacier’s retreat from the map based on early 1990’s imagery is 500 m, combined with retreat of the top of the glacier 20% of the glacier length has been lost in the last 20 years. Mangin Glacier has been retreating even on its upper margin, this is indicative of a glacier without a consistent accumulation zone, and a glacier that will not survive(Pelto, 2010). Just southeast is Petain Glacier also retreating. As the glaciers retreat their meltwater that is primarily yielded in late summer when other sources are at a minimum will decline. It is anticipated that during this century glacier contributions to streamflow in Alberta will decline from 1.1 km3 a−1 in the early 2000s to 0.1 km3 a−1 by the end of this century Marshall et al (2011).mangin map

mangin early

mangin 2005 ge

mangin 2013

Coleman Glacier Retreat, Mount Robson, Alberta

Coleman Glacier flows north from the Reef icefield on the northeast flank of Mount Robson. This glacier is 6 km long and has a relatively low slope descending from 2500 m to a terminus just above 2100 meters. Coleman Glacier flows north from the British Columbia, in an inventory of western Canada glaciers Bolch et al (2010) found that from 1985-2005 Alberta glaciers lost 25% of their area and BC glaciers 11% of their area. Marshall et al (2011) examining the impact on streamflow of glacier volume loss, estimate an 80-90% volume loss for Alberta glaciers by 2100 with a commensurate decline in runoff. By the time a glacier has lost more than 20% of its area glacier runoff declines as the reduced area exposed for melting has a larger influence than the increased melt rate per unit area (Pelto, 2011). A comparison of Landsat images from 1991 (top image) and 2009 (middle Image) indicate a retreat of 250 m. Formation of a new lake at the terminus is evident at the burgundy arrow. The third image is from the Google Earth imagery of 2006, the purple line is the 1991 margin, the burgundy line the 2000 margin. The retreat from 1991-2006 is 250 m, with 50 m of further retreat by 2010. A more detailed look at the 2006 Google Earth Imagery illustrates a more detailed story. This glacier in 2006 has an accumulation zone that is too small to support the current glacier size, a glacier needs at least 60% of its area to be snowcovered at summers end, and only 30% is snowcovered. . This is simply not just a bad year either. The number of annual layers exposed at the surface is at least 50, such layers emerge at the surface below the snowline as a glacier thins below the snowline. The annual layers emerging at the surface are marked by dark horizons which indicate the former snow surface of a layer, which collects dust throughout the summer and is dirtier than the bulk of an annual layer. Above the snowline layers are progressively buried by more recent winter layers and below the snowline layers are exhumed as the layers above melt away (second image). The location and number of annual layers indicate that today the accumulation zone is typically fairly close to the 2006 snowline. . The terminus area and lower 1 kilometer of the Coleman Glacier is quite stagnant as indicated by the degree of incision of surface glacier streams, the lack of crevassing and the smooth nature of the debris cover on the western side of the glacier. This section of the glacier is melting away. Glacier streams in an active flowing glacier will exploit any current or fairly recent crevasse feature to drain toward the glacier bottom often through a moulin. The lack of such drainage indicates a lack of movement that generates crevassing. The bottom image is a closeup of the main supraglacial stream with the blue arrows identifying the channel. This glacier is further north than the Columbia Glacier or Apex Glacier but is following the same trend.

Freshfield Glacier Retreat New Lake Forms

The Freshfield Glacier in the Canadian Rockies retreat over the last five years has exposed a new glacier lake. . Today the glacier is 10.1 km long beginning at 3070 meters and ending at 1970 m near the shore of the less than 5 year old lake. This glacier during the Little Ice Age stretched 14.3 km, one of the longest in the entire range. By 1964 the glacier had retreated 1900 meters exposing Freshfield Lake. From 1964-1994 the glacier retreated up this lake basin losing another 1500 meters of length. A comparison of a 1964 photograph from Austin Post and as close to the same view as I could get in Google Earth illustrates the 45 years of retreat. The red line halfway up the lake is the 1964 terminus and the red line at the edge of the lake the terminus location in the topographic map. By the mid-1990’s the glacier no longer reached the shores of Freshfield Lake, as seen in the Canadian Topographic map, top image. In 2004 a satellite image (middle) indicates the glacier has retreated 400 meters from the lake but there is no sign of a second lake yet. In the current Google Earth Imagery a new lake has developed that is 370 meters across (bottom image), the new lake is marked N and Freshfield Lake (F). A 2012 Landsat image indicates that the glacier has retreated rapidly from the second lake, has continued and now terminates 1100 meters from the shore of Freshfield Lake. The glacier currently ends at 1970 m. Above the terminus there are two concentric depressions that typically indicate a depression beneath the glacier that would tend to at least seasonally fill with water. Such a depression cannot form except with a stagnating and rapidly retreating glacier tongue. This indicates that at least the next kilometer of the glacier will be lost quicly. In the terminus picture below the depressions are indicated by the letter B, and a nunatak poking out of the ice by the letter N. The map terminus is in red.. This glacier remains large and is not in danger of disappearing with present climate. Its behavior mirrors that of the Waputlik Icefield, but is less dramatic in terms of area loss than Warren Glacier or the disappearing Helm Glacier. Glaciers in Alberta as a whole are losing a much greater percentage of their area than Freshfield Glacier as reported by Bolch et al (2010)