

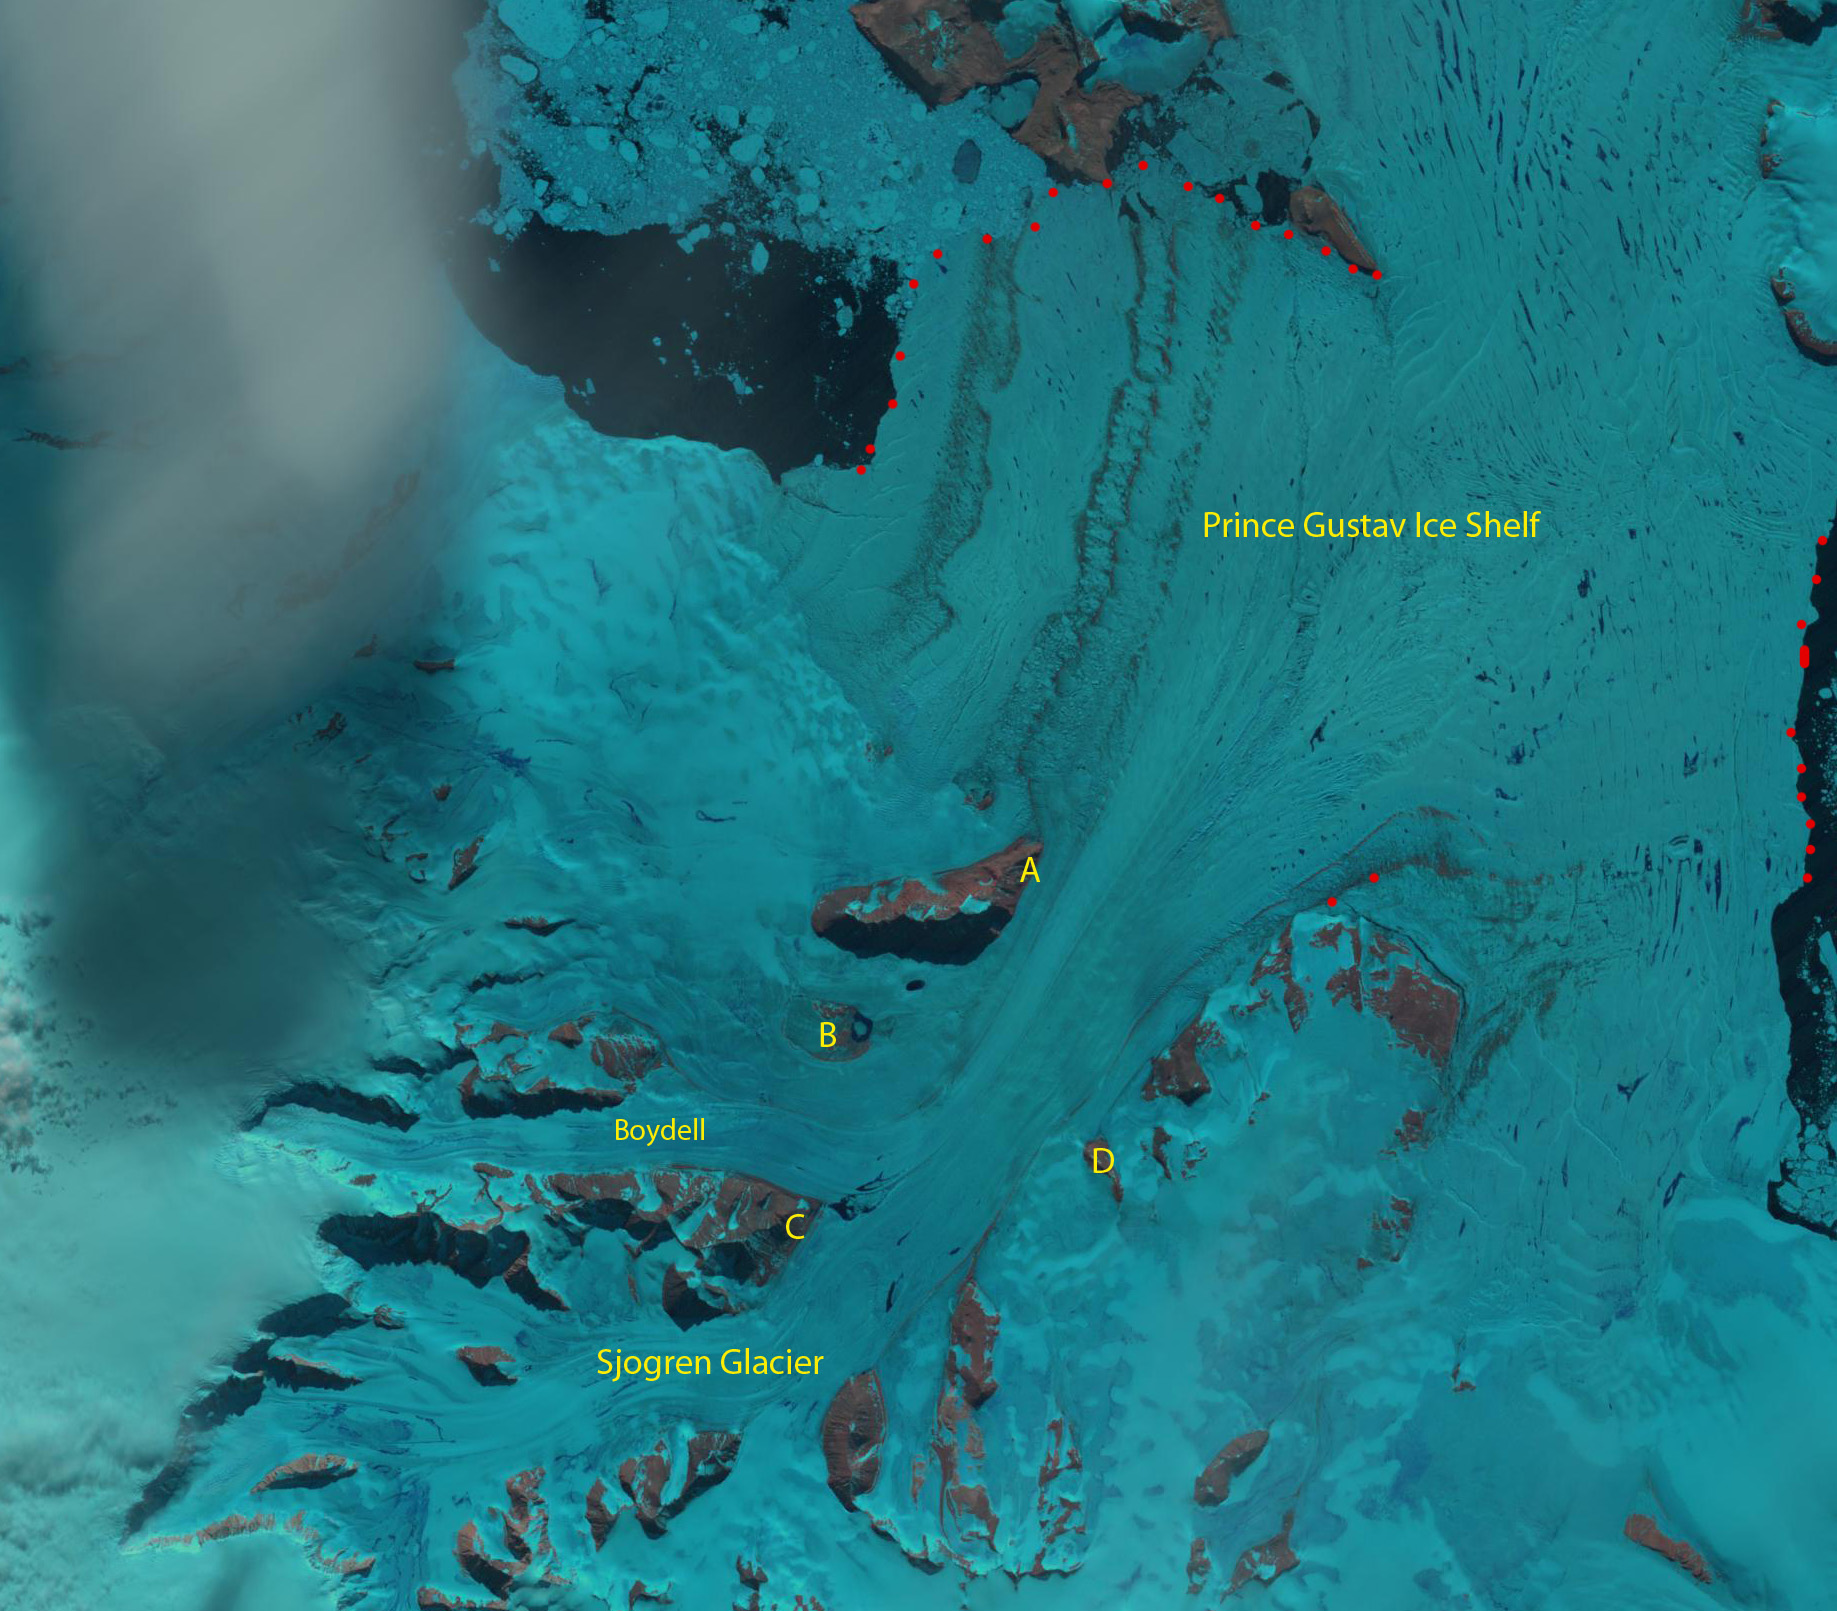
Sjögren Glacier comparison in Landsat images from 2001 and 2016, red dots indicate terminus position, Point A, B, C and D are in fixed locations.
Sjögren Glacier flows east from the northern Antarctic Peninsula and prior to the 1980’s was a principal feeder glacier to Prince Gustav Ice Shelf. This 1600 square kilometer ice shelf disintegrated in the mid-1990’s and was gone in 1995 (Cook and Vaughan, 2010). Scambos et al (2014) noted a widespread thinning and retreat of Northern Antarctic Peninsula Glaciers with the greatest changes where ice shelf collapse had occurred, Sjögren Glacier being one of the locations. Scambos et al (2004) first documented the acceleration of glaciers that fed an ice shelf after ice shelf loss in the Larsen B region. A new paper by Seehaus et al (2016) focuses on long term velocity change at Sjögren Glacier as it continues to retreat. This study illustrates the acceleration is long lived with a peak velocity of 2.8 m/day in 2007 declining to 1.4 m/day in 2014, compared to a 1996 velocity of 0.7 m/day, which was likely already higher than the velocity in years prior to ice shelf breakup. Here we examine Landsat images from 1990, 2001, 2005 and 2016 to illustrate changes in terminus position of Sjögren Glacier
In the 1990 Landsat image Sjögren Glacier feed directly into the Prince Gustav ice Shelf which then By 1993 Seehaus et al (2016) note that Sjögren Glacier had retreated to the mouth of Sjögren Inlet in 1993, this is marked Point A on Landsat Images. By 2001 the glacier had retreated to Point B, a distance of 7 km. Between 2001 and 2005 Sjögren Glacier retreat led to a separation from Boydell Glacier at Point C. In 2016 Sjögren Glacier had retreated 10-11 km from the 2001 location, and 4.5 km from Point C up the expanding fjord. The production of icebergs remains heavy and the inlet does not narrow for another 6 km from the front. Seehaus et al (2016) Figure 1 indicates that the area of high velocity over 1 m/day extends 1 km upglacier, with somewhat of a slowdown at 6 km behind the front. The high velocity and limited change in fjord width in the lower 6 km indicates there is not a new pinning point to slow retreat appreciably in this stretch. Figure 1 also illustrates the retreat from 1993-2014. The pattern of ice shelf loss and glacier retreat after loss has also played out at Jones Ice Shelf and Rohss Bay.
1990 Landsat Image of Sjogren Glacier and Prince Gustav Ice Shelf, terminus marked by red dots

2005 Landsat Image of Sjogren Glacier, terminus marked by red dots


