Columbia Glacier, Alberta 3 km Retreat 1986-2015

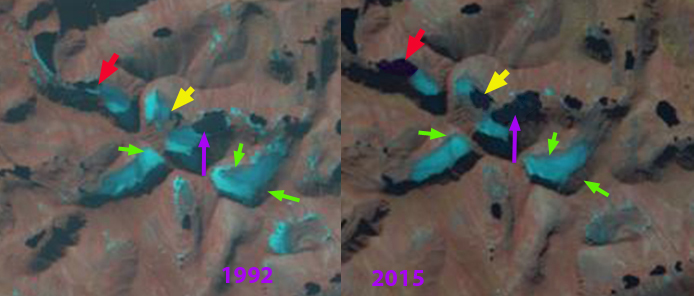
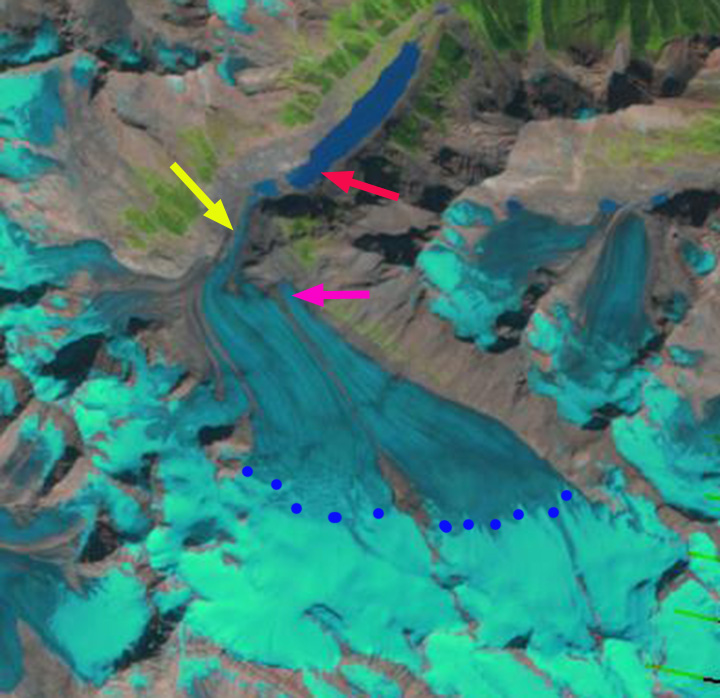
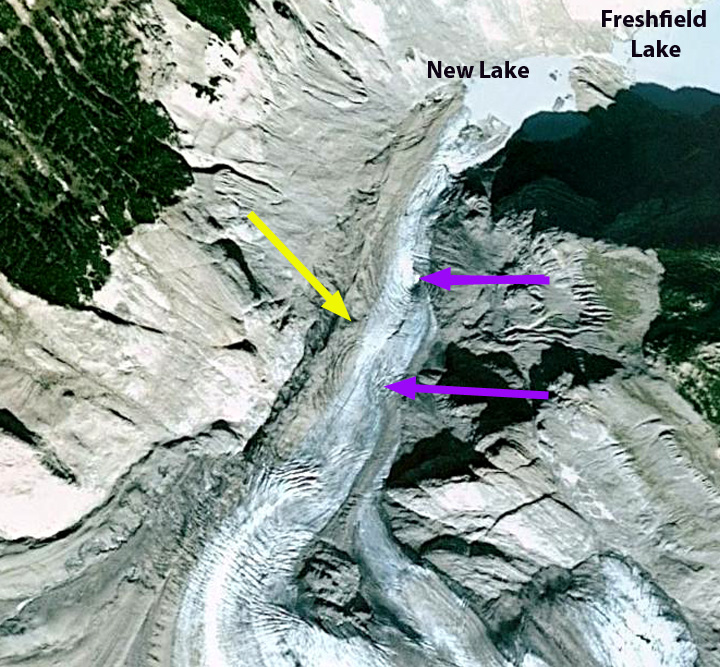
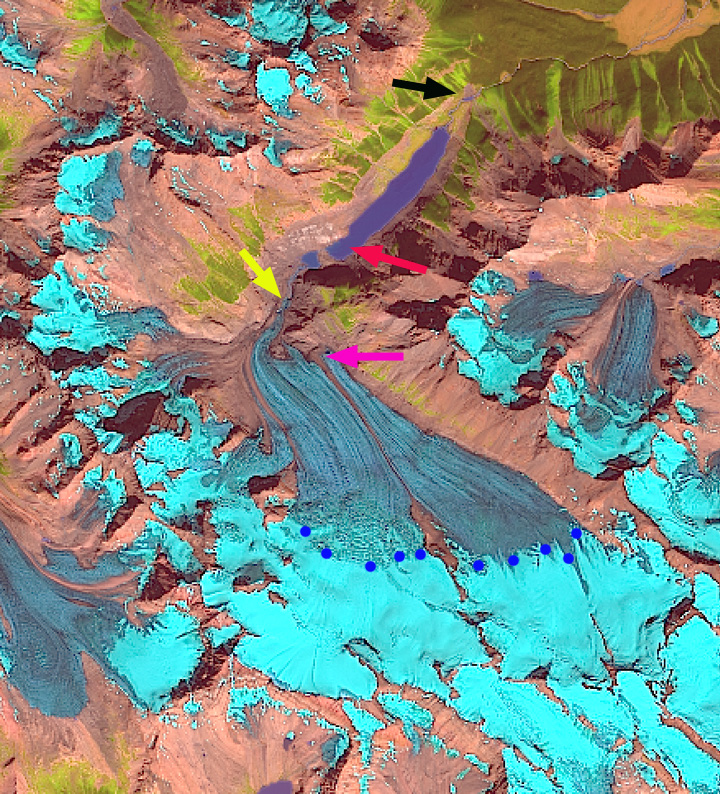
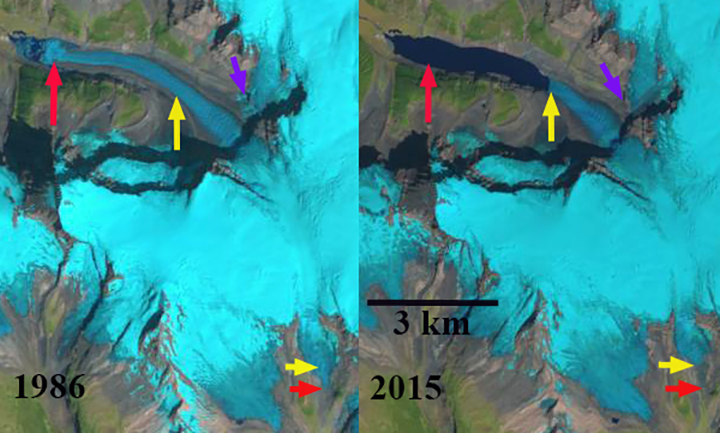
Comparison of Columbia Glacier, which is the glacier flowing into the lake at top in 1986 and 2015 Landsat images. The red arrow is the 1986 terminus, yellow arrow the 2015 terminus position and purple arrow the tributary.

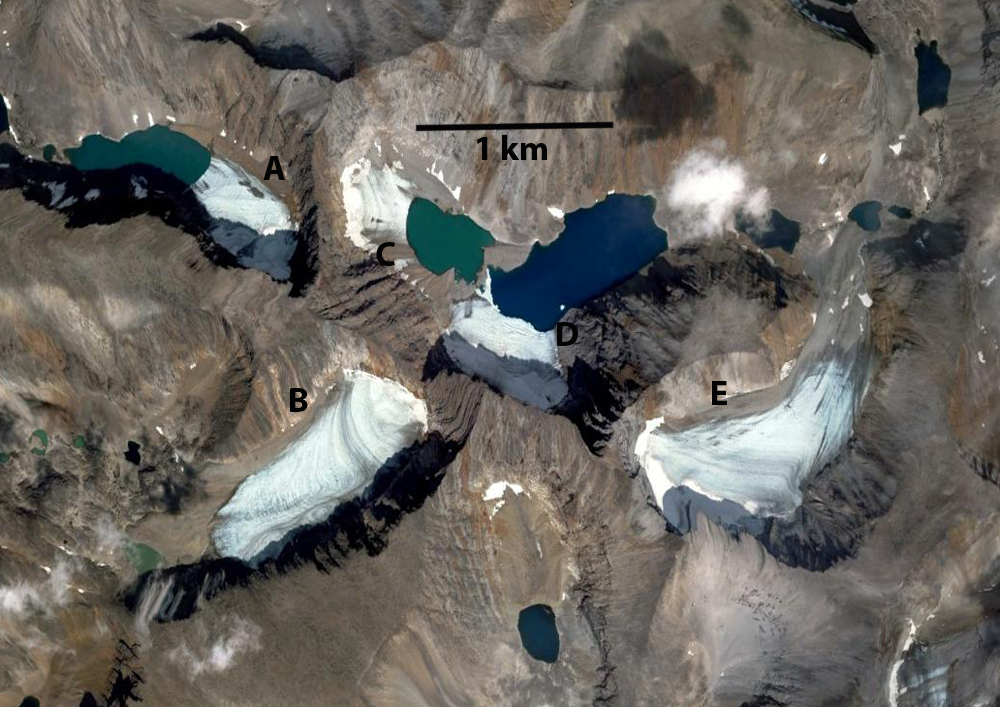
The Columbia Glacier drains the northwest side of Columbia Icefield into the Athabasca River in Alberta. The glacier in 1964 was 8.5 km long, by 1980 9.5 km long and in 2015 6.2 km long. The glacier drops rapidly from the plateau area over a major ice fall from 2400-1950 m.  The icefall leads to the creation of a series of ogives during the 1960-1990 period. Ogives are annual wave bulges that form at the base of an icefall due to differential seasonal flow velocity. Ommaney (2002) noted that the glacier advanced over one kilometer from 1966 to 1980 the glacier completely filled the large proglacial lake that now exists. By 1986 retreat had again opened the lake. Tennant and Menounos (2013) examined changes in the Columbia Icefield 1919-2009 and found a mean retreat of 1150 m and mean thinning of 49 m for glaciers of the icefield.  They noted that the fastest rate of loss on Columbia Icefield glaciers from 1919-2009 was during the 2000-2009 period.

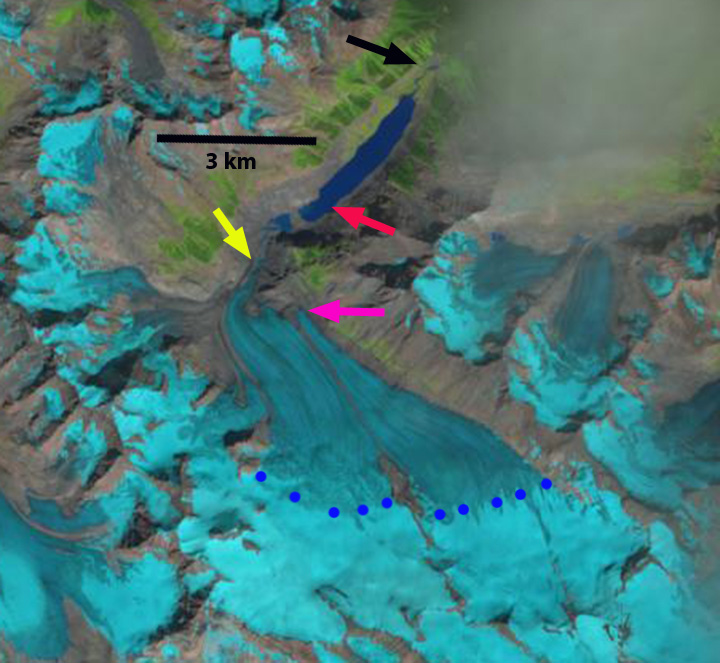
In 1986 Landsat imagery the lake is 1000 m long. A 2004 Google Earth image indicates a step in elevation that is 500 m from the terminus.  Glacier elevation lags the basal elevation change; hence the end of the lake is between 500 and 1000 m from the 2004 terminus. By 2015 the lake is 4000 m long indicating a 3000 meter retreat from 1986-2015.  The rate of retreat has been less since 2004, 300 m, as the glacier approaches the upper limit of the lake basin.  When the glacier terminus retreats to this step, the lake will no longer enhance retreat via calving and retreat rates will diminish.  A further change is noted in the absence of ogives at the base of the icefall. As the icefall has narrowed and slowed the result has been a cessation of this process. The purple arrow indicates a tributary that joined the glacier below the icefall in 1986 that now has a separate terminus. The current terminus is still active with crevassing near the active front.  The snowline in both August 2015 and July 2016 is close to 2800 m.  A more detailed look at the 2016 mass balance conditions in the region just west of the glacier suggest Columbia Glacier had a more negative balance than in the Columbia River basin. With time left in the ablation season the snowline is at too high of an elevation to sustain strong flow through the icefall.  The retreat is more extensive than the more famous and oft visited glaciers draining east from the icefield Athabasca Glacier and Saskatchewan Glacier.

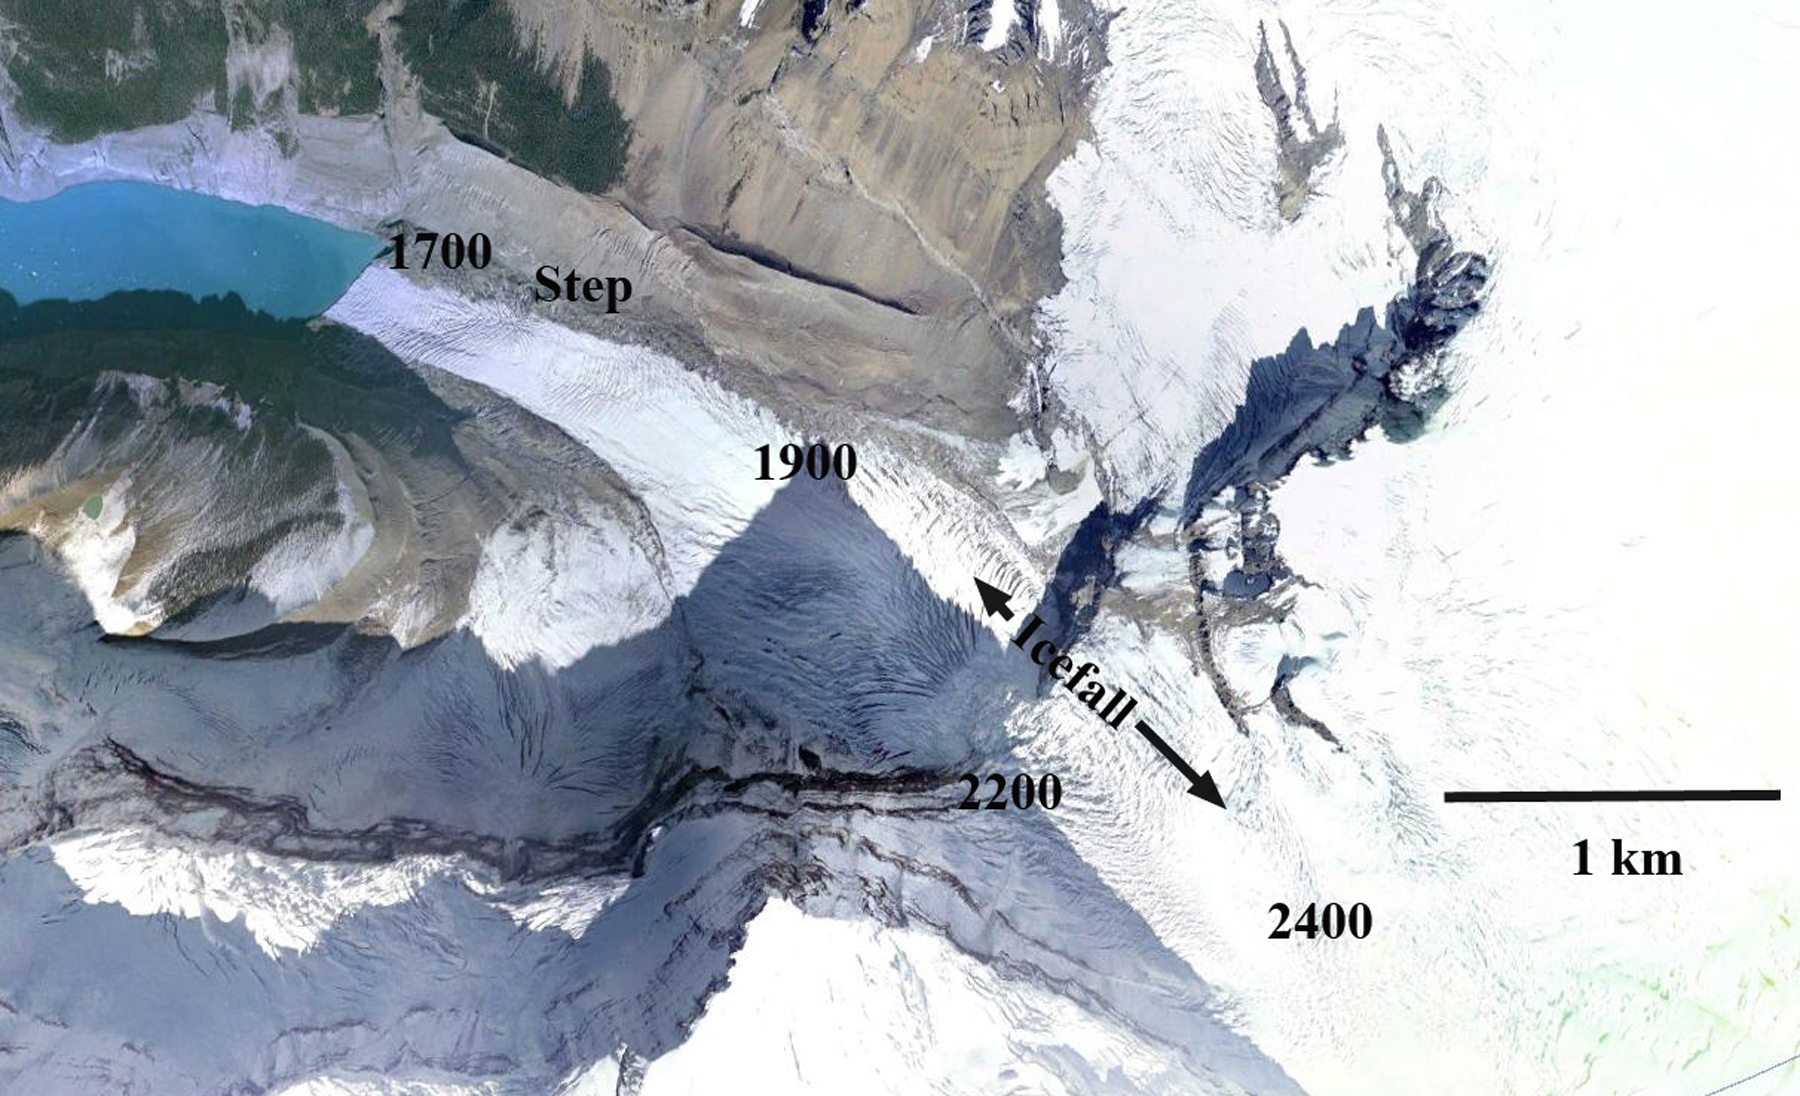
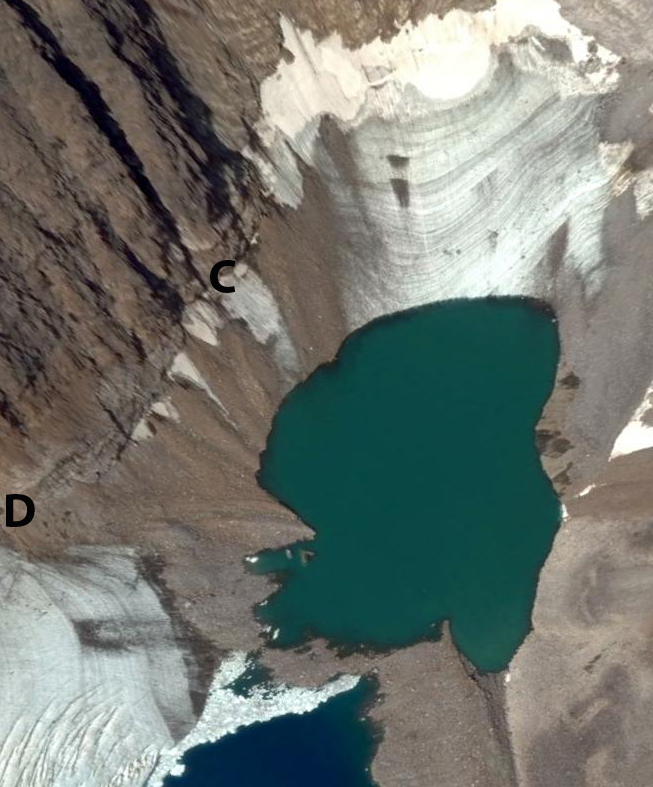
A 2004 image of the glacier indicating the ogive band, and step where the upper limit of the lake likely occurs. 

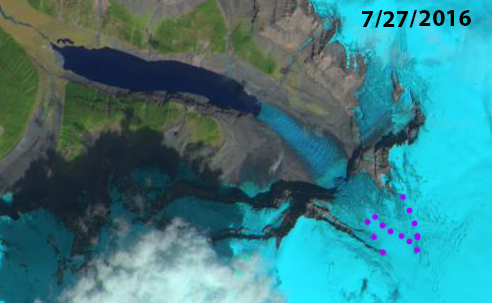
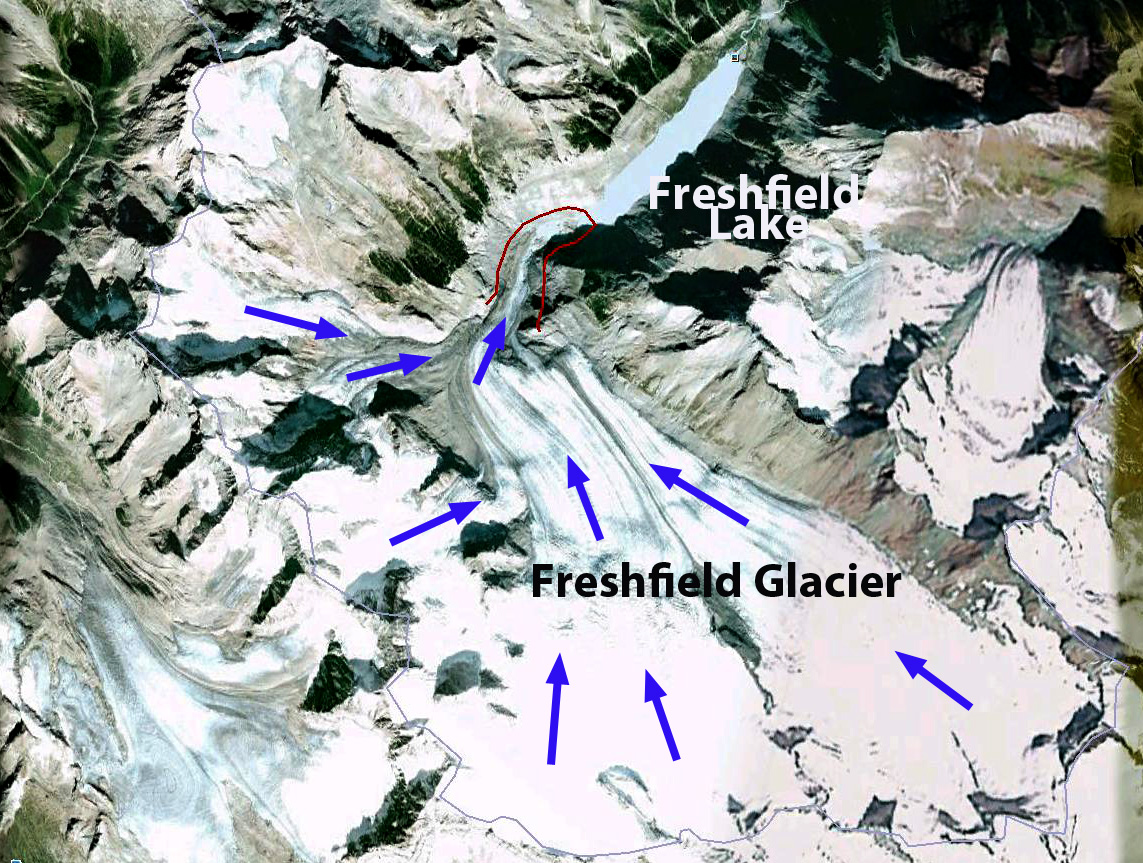
Sentinel image indicating the snowline at 2750-2800 m m on July 27, 2016. 

Mount Caubvick Glacier Retreat, Labrador

Mount Caubvick is in the Torngat Mountains of Labrador 35 km inland of the Atlantic Ocean and south of Nachvak Fjord. Way et al (2014) identified 105 active glaciers that had flow indicators in these mountains.  The mean elevation of these glaciers is quite low at 776 meters above sea level. The radiational shading and higher accumulation from protected cirque locations and proximity to the ocean are key to the low elevations. The elevation of the glaciers around Mount Caubvick is higher. Here we use Landsat images from 1992, 1997 and 2015 to identify response to climate change. The annual layers preserved in the glacier ice are evident in glacier B,C and E.

caubvick

2013 Google Earth image of Mount Caubvick, Torngat Mountains, Labrador.

In 1992 Glacier A terminates at the red arrow in an expanding lake. Glacier C terminates at the yellow arrow in a just forming glacial lake.  Glacier E terminates at the purple arrow in a glacial lake that is similar in length to the glacier. In 2015 each lake has notably expanded.  The arrows are in the same locations in the 2015 image.  At the red arrow, Glacier A has retreated 200 m, which is 20% of its entire length. Glacier C, yellow arrow has retreated 250 m, 40% of the total glacier length.  At the purple arrow, Glacier D has retreated 225 m, which is 35% of its total length.  The retreat of Glacier B and E is less clear as the terminus locations are hard to determine in 1992.  What is most evident is the reduction in ice area at the higher elevations of the glaciers noted by the green arrows. In 1997 there is little expansion of the three lakes since 1992, indicating most of the retreat has been in the last 18 years.  Glacier B provides a good snapshot of annual layers.  The black arrow indicates the lack of an accumulation zone, without which a glacier cannot survive (Pelto, 2010). The red arrow indicates a band of annual layers that marks what had been the typical snowline Indeed none of the glaciers in 2015 in either the 2013 Google Earth image or 2015 Landsat have significant retained accumulation, indicating none can survive current climate. Way et al (2014) figure 4 indicates an example of the same snowline setup on a different glacier near Ryans Bay. .  it is evident that in the last decade firn and snow are not retained consistently. Sharp et al (2014) indicate in Figure 52 the mass loss of Canadian Arctic glaciers in general, that parallels that of Labrador.

caubvick compare

1992-2015 Landsat comparison of Mount Caubvick glaciers

torngat 2014 annual layers

Glacier B with numerous annual layers with the snowline indicates by red arrow and lack of accumulation black arrow.

torngat cirque layers


Glacier C annual layers. 

Rapid Retreat of Freshfield Glacier, Alberta 1964-2014

The Freshfield Glacier is a large glacier southeast of the Columbia Icefield in the Canadian Rockies where recent retreat  has exposed a new glacier lake.  Today the glacier is 9.8 km long beginning at 3070 meters and ending at 2000 m near the shore of the less than 5 year old lake. This glacier during the Little Ice Age stretched 14.3 km, one of the longest in the entire range extending beyond Freshfield Lake, which was a glacier filled basin. By 1964 the glacier had retreated 1900 meters exposing Freshfield Lake. From 1964-1986 the glacier retreated up this lake basin losing another 1200 meters of length. A comparison of a 1964 photograph from Austin Post and as close to the same view as I could get in Google Earth illustrates the 50 years of retreat. The red line halfway up the lake is the 1964 terminus and the red line at the edge of the lake the terminus location in the topographic map from the 1980’s.  Here we examine Landsat images from 1986 to 2014 to further illustrate the changes. Clarke et al (2015) published this week indicates that it is likely that 70% of glacier volume in western Canada will be lost by 2100. In their Figure 4, three of the four scenarios show Freshfield Glacier as surviving to 2100. The adjacent Conway Glacier is also retreating leading to new lake formation. freshfield total
Freshfield Glacier Google Earth view
 
1964 image of Freshfield Glacier from Austin Post
freshfield compare
Google Earth view of Freshfield Glacier, indicating 1964, 1986 and 2014 terminus positions.

In each image the red arrow indicates the 1986 terminus position, the yellow arrow the 2014 terminus, pink arrow terminus of the eastern portion of the glacier in 2014, and blue dots the snow line on the date of the images.  In 1986 the glacier still reaches the western end of Freshfield Lake, the snowline is at 2600 m and the eastern terminus reaches a bedrock step beyond the pink arrow.  By 1994 the glacier had retreated to the southwest shore of the now fully formed Freshfield Lake, the snowline was between 2600 and 2700 meters.  By 1998 has retreated several hundred meters from the shore of Freshfield Lake into a new basin terminating 600 m from the 1986 terminus location. The snowline is again near 2600 m.  The eastern terminus has retreated from the bedrock step.

By 2009 the terminus has retreated from the basin where it terminated in 1998 exposing a new lake that is 300 m long the terminus no longer reaches.  The lower 1000 meters of the glacier has a thin width suggesting the glacier terminus ice thickness is also thin.  A Google Earth image from 2005 indicates two  basins, circular depressions above the terminus that indicate the collapsing and stagnant nature of the lower portion of the glacier.  The narrowness of the terminus reach is also evident.   By 2013 the glacier has further retreated from the new lake and now ends near the base of the bedrock step.  The eastern terminus has retreated to the pink arrow.  The snowline in this Sept. 22, 2013 image is at 2700 m and is close to the end of the melt season position, the equilibrium line altitude. In 2014 the terminus has retreated 1700 m from the 1986 position and 2900 m from 1964.  This is a rate of approximately 60 m year over a span of  50 years. The glacier remains nearly 50% snowcovered both in 2013 and 2014, indicating a persistent and consistent accumulation zone. The glacier terminus is nearing a bedrock step, with active crevassing on this step. This suggests that the retreat rate should slow in the short term. This glacier remains large and is not in danger of disappearing with present climate. Its behavior mirrors that of the Apex Glacier and Columbia Glacier  but is less dramatic in terms of area loss than or the disappearing Helm Glacier. Glaciers in Alberta as a whole are losing a much greater percentage of their area than Freshfield Glacier as reported by Bolch et al (2010)freshfield glacier 1986
1986 Landsat image

freshfield glacier 1994
1994 Landsat image

freshfield glacier 1998
1998 Landsat image

freshfield glacier 2009
2009 Landsat image
freshfield ge terminus
2005 Google Earth image

Red Channel|Green Channel|Blue Channel
2013 Landsat image

freshfield glacier 2014
2014 Landsat image

Conway Glacier Separation and Retreat, Alberta

Conway Glacier drains east from the border with British Columbia into the Howse River. The Howse River joins the Saskatchewan River upstream of the Bighorn Hydropower project, which impounds Lake Abraham and produces 120 MW of power. The map of this area was updated based on 1990 images which indicate Conway Glacier is comprised of two lobes that join near the terminus.   An inventory of glaciers in the Canadian Rockies indicate area loss of 15% from 1985 to 2005 (Bolch et al, 2010).  The more famous Columbia Icefield, 50 km north, has lost 23 % of its area from 1919-2009 with ice loss at a minimum during the 1970′s (Tennant and Menounos, 2013)Here we examine Landsat imagery from 1986 to 2014 to see the impact of recent climate change.

conway glacier map

Map of Conway Glacier area from 1990 image.

In 1986 the two glaciers are still joined, with a surface lateral moraine at their junction, orange dots indicate this narrow surface rock band eroded from the ridge between the two lobes. The yellow arrow in each image indicates the 1986 terminus location of the northern lobe, the red arrow indicates a bedrock step near the southern lobe terminus, green arrow indicates an ice filled basin, and the purple arrow a small tributary joining the main glacier.  In 1986 the southern lobe extends 300 meters beyond the bedrock step.  By 1994 a small lake is developing at the basin indicated by the green arrow and the northern lobe is reduced in width.  Overall less than 40% of the glacier is snowcovered.  By 1998 the southern lobe has retreated to the bedrock step and the northern lobe has retreated from the end of the lateral moraine.  The glacier again is less than 40% snowcovered.  The 2013 image has better resolution thanks to the better Landsat 8 imagery, and has been sharpened using a higher resolution panchromatic image layer by Ben Pelto (Technique will be explained in a future post).  The glaciers are no longer joined.  The northern lobe has retreated 500-550 m since 1986 and a small lake has formed at the 1986 terminus location, another yellow arrow indicates 2013 terminus.  The northern lobe has retreated above the bedrock step, a total retreat of 500-600 m since 1986.  Two additional red arrows have been added to indicate 1986 and 2013 terminus location.  The small lake at the green arrow has expanded.  The tributary connection at the purple arrow is nearly severed.   Retained snowpack on the glacier is also limited in area with most of the glacier in 2013 being bare glacier ice. This indicates that snow was not retained in recent previous years either.  For a glacier to be in equilibrium it needs more than 50% of its area to be covered by snow at the end of the melt season, not  35% with a few weeks left in the melt season. as in 2013. This glaciers retreat and volume loss mirrors that of the region including Saskatchewan Glacier and Fraser Glacier.   Peyto Glacier is the nearest glacier, just 20 km southeast, with a long term mass balance record, which indicates a cumulative loss or over 28 m w.e or 30 m of glacier thickness.

conway glacier 1986a

1986 Landsat image

conway glacier 1994

1994 Landsat image

conway glacier 1998

1998 Landsat Image

Red Channel|Green Channel|Blue Channel 2013 Landsat image-Pan sharpened by Ben Pelto (Univ. Northern British Columbia)

Warren Glacier Retreat, British Columbia, Canada

Warren Glacier in Garibaldi Provincial Park, British Columbia, Canada terminus retreat has been observed for over a century. A period of extensive retreat from 1890-1964 was followed by a period of minor advance from 1973-1977, and then rapid retreat from 1977-2009. Johannes Koch has documented this retreat in the map below and with the historic images as well, the work has been published with less colorful graphics (Koch et al., 2009).
. When I first saw the glacier in 1986 it had just retreated from the edge of the lake. By 2003 as seen in the somewhat blurry satellite image below, the glacier was 310 meters from the lake edge. In the 2009 Google Earth image the glacier is 500 meters from the lake edge. The rate of retreat over the 25 year period is 20 meters per year. The rate of retreat has again increased from 2003-2009, being 32 meters/year. The upper section of the glacier has unlike nearby Helm Glacier maintained some snow covered areas even in poor snow summers such as 2005 and 2009. This suggests the glacier can survive current climate with further retreat. The average thinning of Warren Glacier is similar to that of Helm, Sphinx and Sentinel Glacier at nearly 50 meters since 1928, note Figure 14 (Koch et al. 2009). This thinning due to ongoing negative mass balance has led to a 50% reduction in area since 1928. The large area loss as a percentage reflects the large relatively flat low lying basin now occupied by the lake.