Bailang and Angge Glacier, China Retreat and Lake Expansion 1995-2020

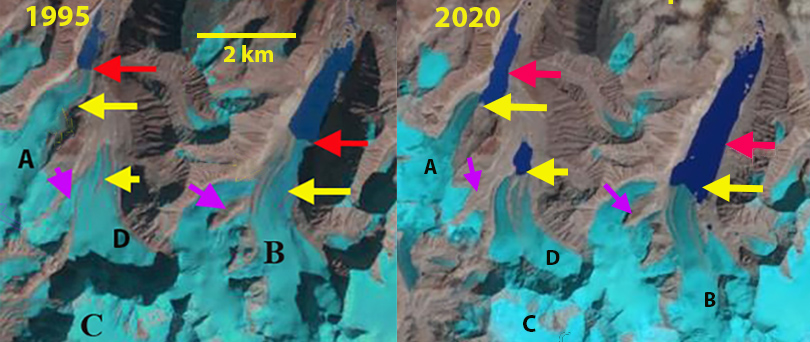
Bailang (B) and Angge Glacier (A) in 1995 and 2020 Landsat images indicating retreat and lake expansion. Red arrow is the 1995 terminus location, yellow arrow the 2020 terminus location, purple arrow rock ridges that expand separating tributaries. Chubda Glacier (C) to the south and an unnamed glacier Point D between Angge and Bailang.

Bailang Glacier and Angge Glacier, China are adjacent to the Chubda Glacier, Bhutan, They drain north from Chura Kang and are summer accumulation type glaciers that end in proglacial lakes. The glacier runoff feeds the Xung Qu River a tributary of the Kuri Chhu in Bhutan that powers the Kurichhu Hydropower plant a 60 mw run of river plant in Eastern Bhutan. Both lakes are impounded by broad moraines that show no sign of instability for glacier lake outburst flood. The number of glacier lakes in the adjacent Pumqu Basin to the west has increased from 199 to 254 since the 1970’s with less than 10% deemed dangerous (Che et al, 2014).  In the Yi’ong Zangbo basin to the east  Hongyu et al (2020) observed that from 1970 to 2016 total area of glaciers in the basin  decreased by 35%, whereas the number of glacial lakes increased by 86. Here we compare Landsat images from 1995 and 2020 to identify their response to climate change.

Bailang Glacier in 1995 terminated in a proglacial lake that was 2.1 km long at an elevation of ~5170 m, red arrow. Angge Glacier terminated in a lake that was 1 km long at an elevation of ~5020 m. Between the two is an unnamed glacier labeled “D” here that does not end in a proglacial lake.  By 2001 both glaciers experienced minor retreat of less than 250 m.  By 2014  Bailang Glacier had retreated  800-900 m and the lake was now 3 km long and had no change in water level.  A key tributary on the west side near the purple arrow had also detached. Angge Glacier retreat from 1995 to 2015 was 700 to 800 m, with the glacier retreating to a westward bend in the lake basin.  The glacier has an icefall just above the current terminus suggesting the lake basin will soon end, which should slow retreat.  The D Glacier between them has developed a proglacial lake as well. By 2020 the Bailang Glacier has retreated 1300 m since 1985 and has lost connection with tributaries on either side of the ridge on the west side of the glacier noted by the purple arrow. Angge Glacier has retreated 1100 m since 1995 and has a very narrow connection to the lake, which is now ~2 km long. The glacier in between Bailang and Angge, D Glacier, has developed a 900 m long proglacial lake which also matches the retreat during the last 25 years. This glacier has lost contact with its western tributary as well at western purple arrow.

The reduced lake contact at Angge Glacier is similar to that seen at Shie Glacier, while the lake expansion at Bailang Glacier is similar to that at Daishapu Glacier and Drogpa Nagtsang Glacier.

Bailang (B) and Angge Glacier (A) in 2001 and 2014 Landsat images indicating retreat and lake expansion. Red arrow is the 1995 terminus location, yellow arrow the 2020 terminus location, purple arrow rock ridges that expand separating tributaries. Chubda Glacier (C) to the south and an unnamed glacier Point D between Angge and Bailang.

High Glacier Snow Line Post-Monsoon 2018 on Bhutan-China Border

Angge Glacier (A) and Bailang Glacier (B) in China and Chubda Glacier (C) in Bhutan in Post Monsoon 1995 and 2018 Landsat images indicating the snowline purple dots is exceptionally high in 2018.  Red arrow is the 1995 terminus location and yellow arrows the 2018 terminus location. Point 1-3 are glacier passes from China into Bhutan.

The end of the monsoon season leads to finally some clear satellite images of snowlines and glaciers in the Himalaya.  A Landsat image from September 12, 2018 along the China-Bhutan  indicates high snowlines (5500 m) that reach the top of some glaciers and the glacier divide between nations on other glaciers.

Bailang Glacier and Angge Glacier, China are adjacent to the Chubda Glacier, Bhutan.  A These glaciers drain north and south from near Chura Kang on the Bhutan/China border.  Despite being in different nations on different flanks of the Himalaya, the retreat and resultant lake expansion is the same. These are all summer accumulation type glaciers that end in proglacial lakes.  All three lakes are impounded by broad moraines that show no sign of instability for a potential glacier lake outburst flood.  The number of glacier lakes in the region has increased 20%  (Che et al, 2014)   The Chubda Glacier terminates in Chubda Tsho, a glacier moraine dammed lake, Komori (2011) notes that the moraine is still stable and the lake is shallow near the moraine, suggesting it is not a threat for a glacier lake outburst flood.  Jain et al., (2015) noted that in the last decade the expansion rate of this lake has doubled. The glacier feeds the Chamkhar Chu Basin.

Here we examine 1995-2018 Landsat images from the post monsoon period to identify both retreat and the anomalously high snowlines in 2018.  In 1995 the highest observed snowline is at 5300 m, purple dots, Point 1 -3 are glacier passes from China into Bhutan that are snowcovered.  The glaciers terminate at the red arrows.  In 2000 the highest observed snowline is 5250-5300 m. There is limited retreat since 1990. In 2017 the highest observed snowline is at 5300-5350 m.  In 2018 the highest observed snowline is at 5500-5550 m.  The glacier passes at Point 1 and 2 lack any snowcover.  The glaciers at Point 3 have no retained snowcover despite top elevation above 5400 m.  Bailang Glacier has retreated 900 m from 1995 to 2018 that has led to lake expansion.   A retreat 1995-2018 retreat of 800 m of Angge Glacier has led to lake expansion.  A retreat of Chubda Glacier of 800 m  has led to lake expansion from 1995-2018 has led to lake expansion. 

2000 Landsat image from the post monsoon indicating the snowline purple dots.  Red arrow is the 1995 terminus location  Point 1-3 are glacier passes from China into Bhutan.

2017 Landsat image from the post monsoon indicating the snowline purple dots.  Red arrow is the 1995 terminus location  Point 1-3 are glacier passes from China into Bhutan.

Sept. 12 2018 Landsat image indicating the snowline purple dots is exceptionally high in 2018.  Red arrow is the 1995 terminus location and yellow arrows the 2018 terminus location. Point 1-3 are glacier passes from China into Bhutan.