Upernavik Glacier Retreat, NW Greenland

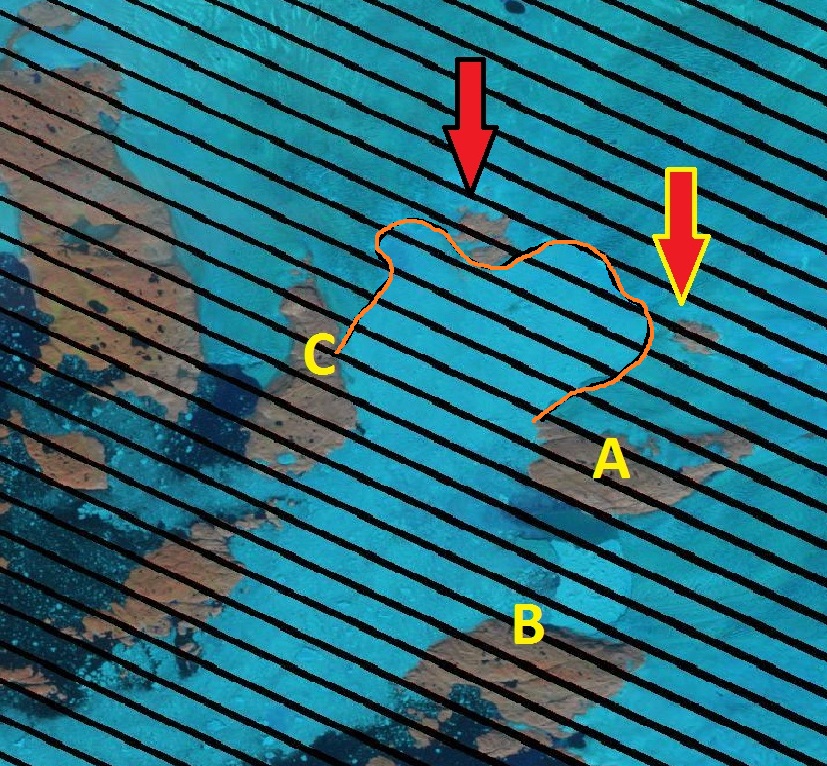
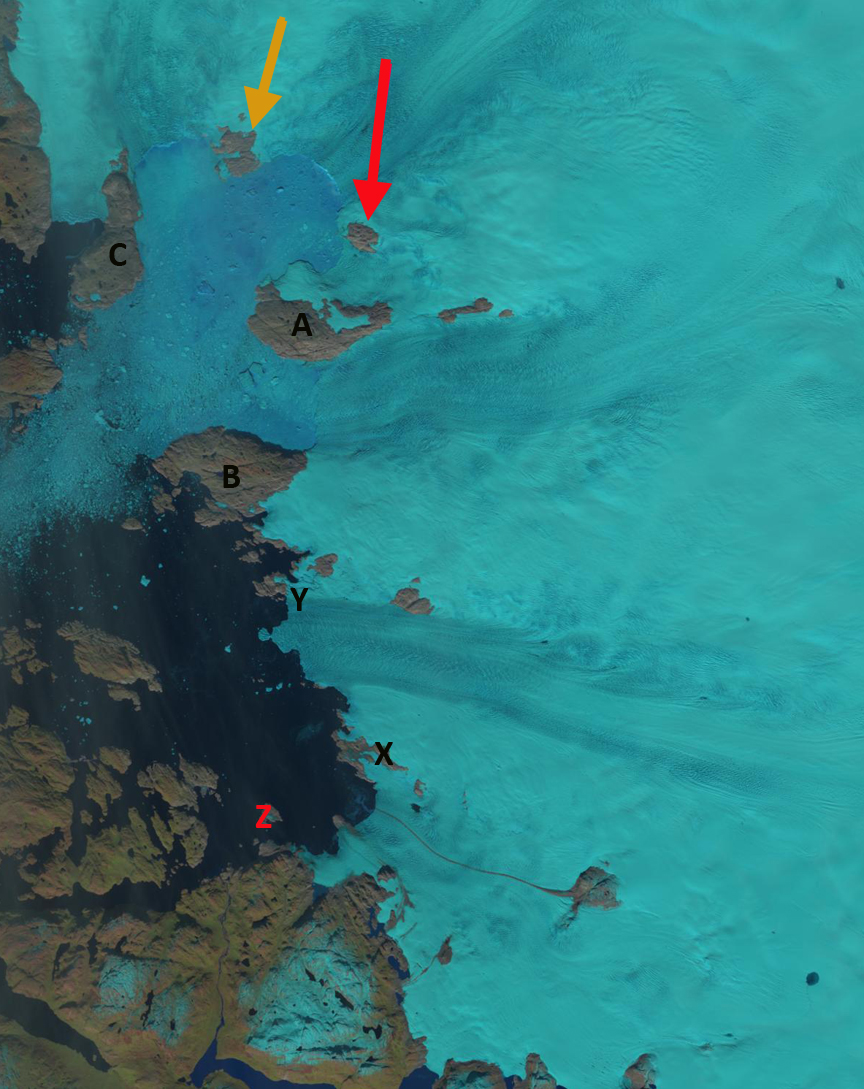
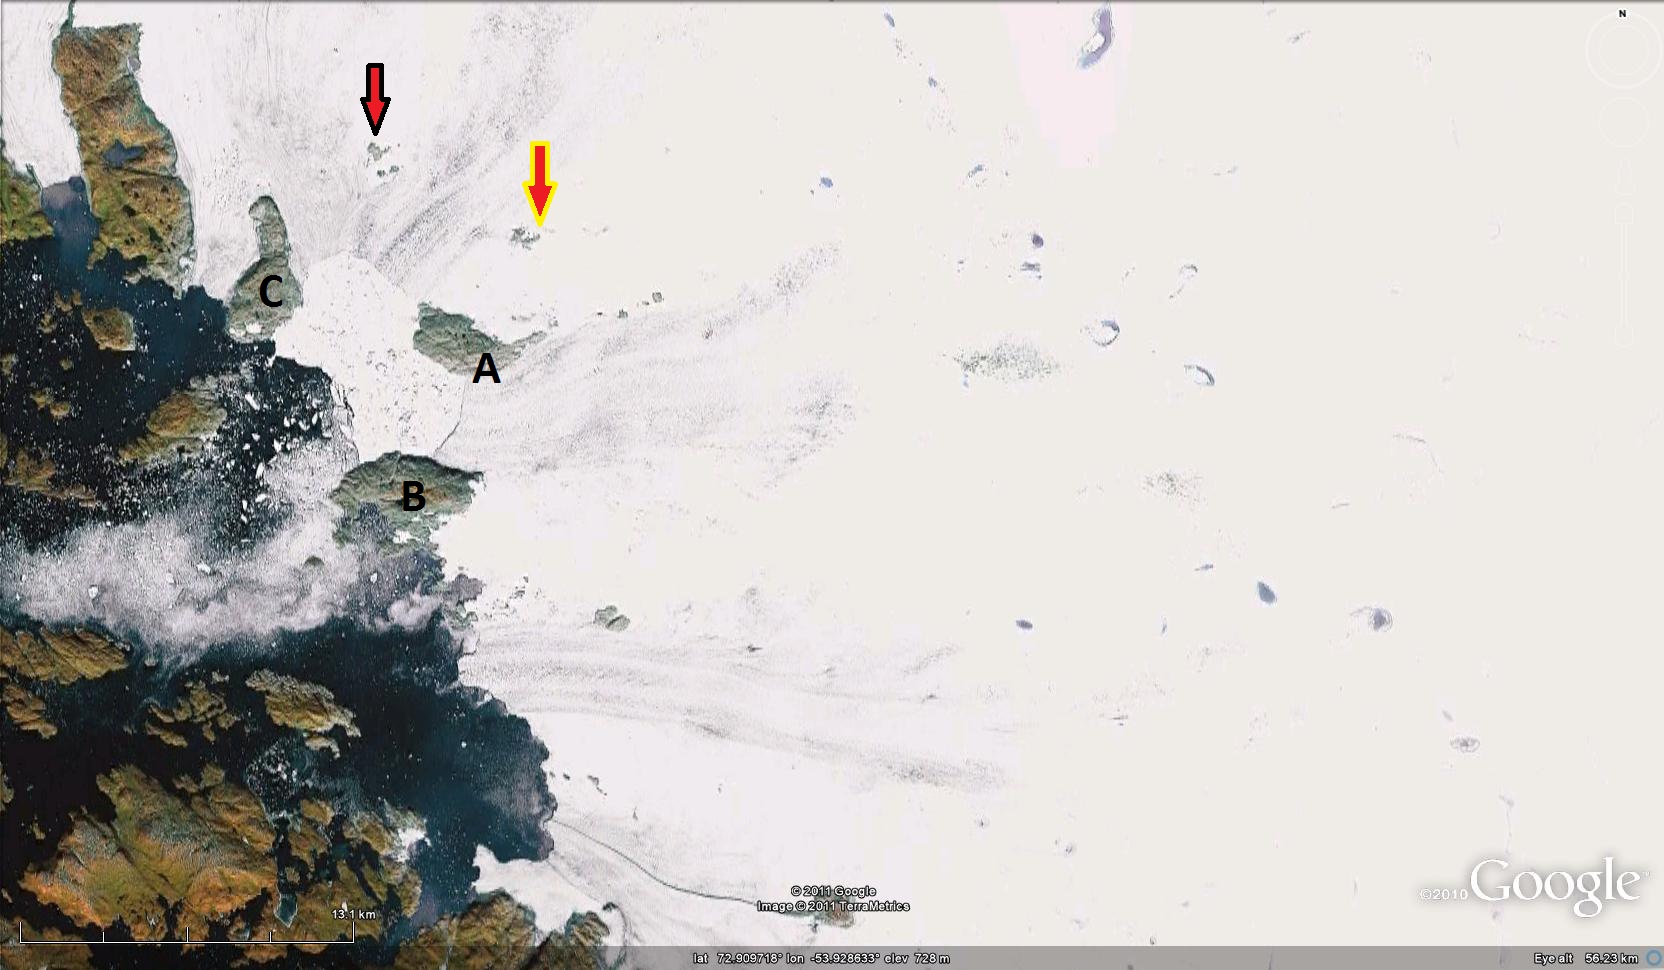
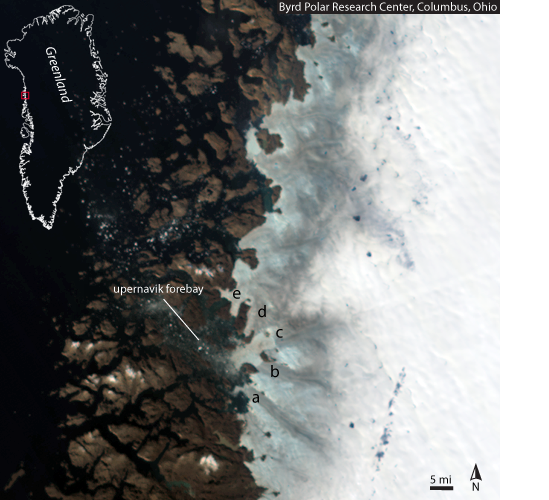
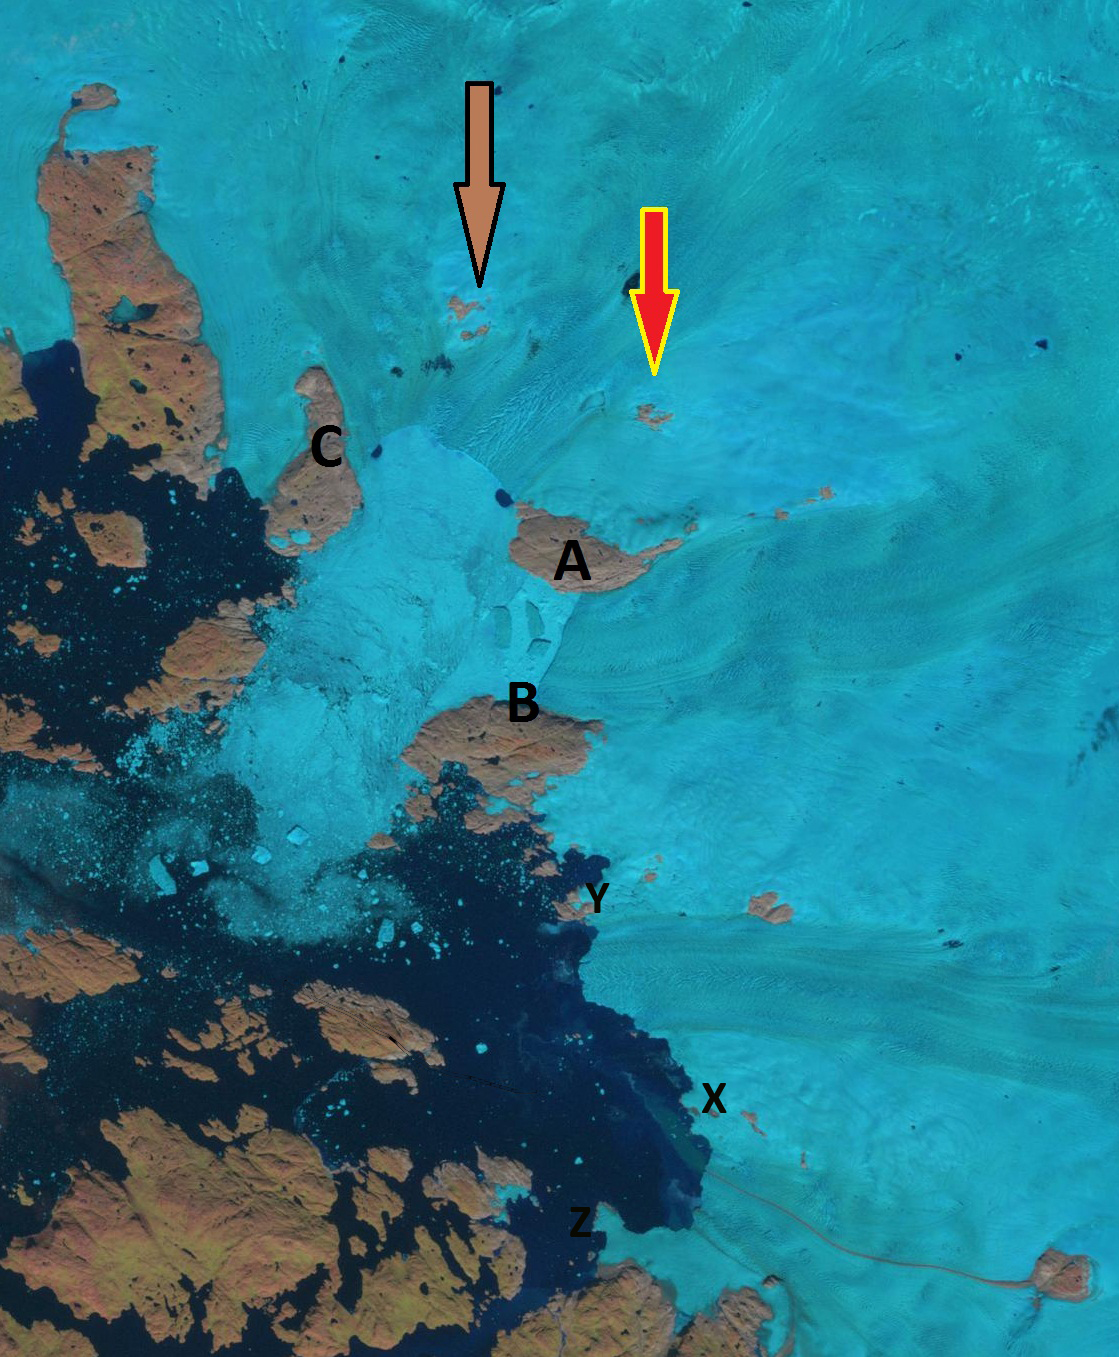
Box and Decker (2011) focused on the changes in the terminus of 39 Greenland Outlet glaciers from 2000-2010. Of these 35 had experienced net loss with the collective loss of 1593 km2 over the last decade. (Box and Decker, 2011). The retreat has occurred irrespective of the different characteristics of various glaciers (Bailey and Pelto, SkS) One of the glaciers in this group is Upernavik Glacier on the NW Greenland Coast. The Upernavik Glacier refers today refers to an increasing number of separate termini that were one termini up through 1950. Jason Box of Ohio State focused on the different termini in a 2008 post, commenting on the separation of termini A and B. Here we will focus on the development of two new islands between 2002 and 2010 due to the retreat of termini C as identified by Box and Benson in the image below. There are three marginal rock islands at the icecap periphery that are consistently labeled in the images below A, B and C. In addition the two arrows indicate two former nunataks, surrounded by ice in the 2002 Landsat image (top image below), and are now becoming rock islands at the glacier front in both Landsat 2010 (middle two images) and MODIS 2011 image (bottom). In the closeup Landsat image the glacier front is indicated in orange, beyond the terminus the fjord is still filled with considerable glacier debris that has calved. The black lines in the image are the uncorrected scan lines. A 2013 Landsat image indicates changes along outlet A as island at Point X, Y and Z emerge from the ice compared to 2002. upernavik2002 upernavik 2013
2013 Landsat image
Google Earth currently has an image that predates the development of the new island as well. This is not the only new island in Greenland by any means. Warming Island on the east coast has gained notoriety. It is seen below in a nice August 2010 Landsat image. Box and Decker (2011) note that ice loss for Upernavik Glacier’s combined termini was 7.9 square kilometers per year from 2000-2010, in Table 2. For the 2002 to 2010 period it is evident the Upernvavik terminus C lost at least 35 square kilometers as the two new islands begin to develop, mostly between 2002 and 2008. This glacier follows the pattern of Umiamako Glacier and Jakobshavn Glacier. It also is worth noting it has a deep bed that extends well under the ice sheet as observed by Morligheim et al (2014). upernavik base
Bridge Glacier Retreat Acceleration, BC, Canada

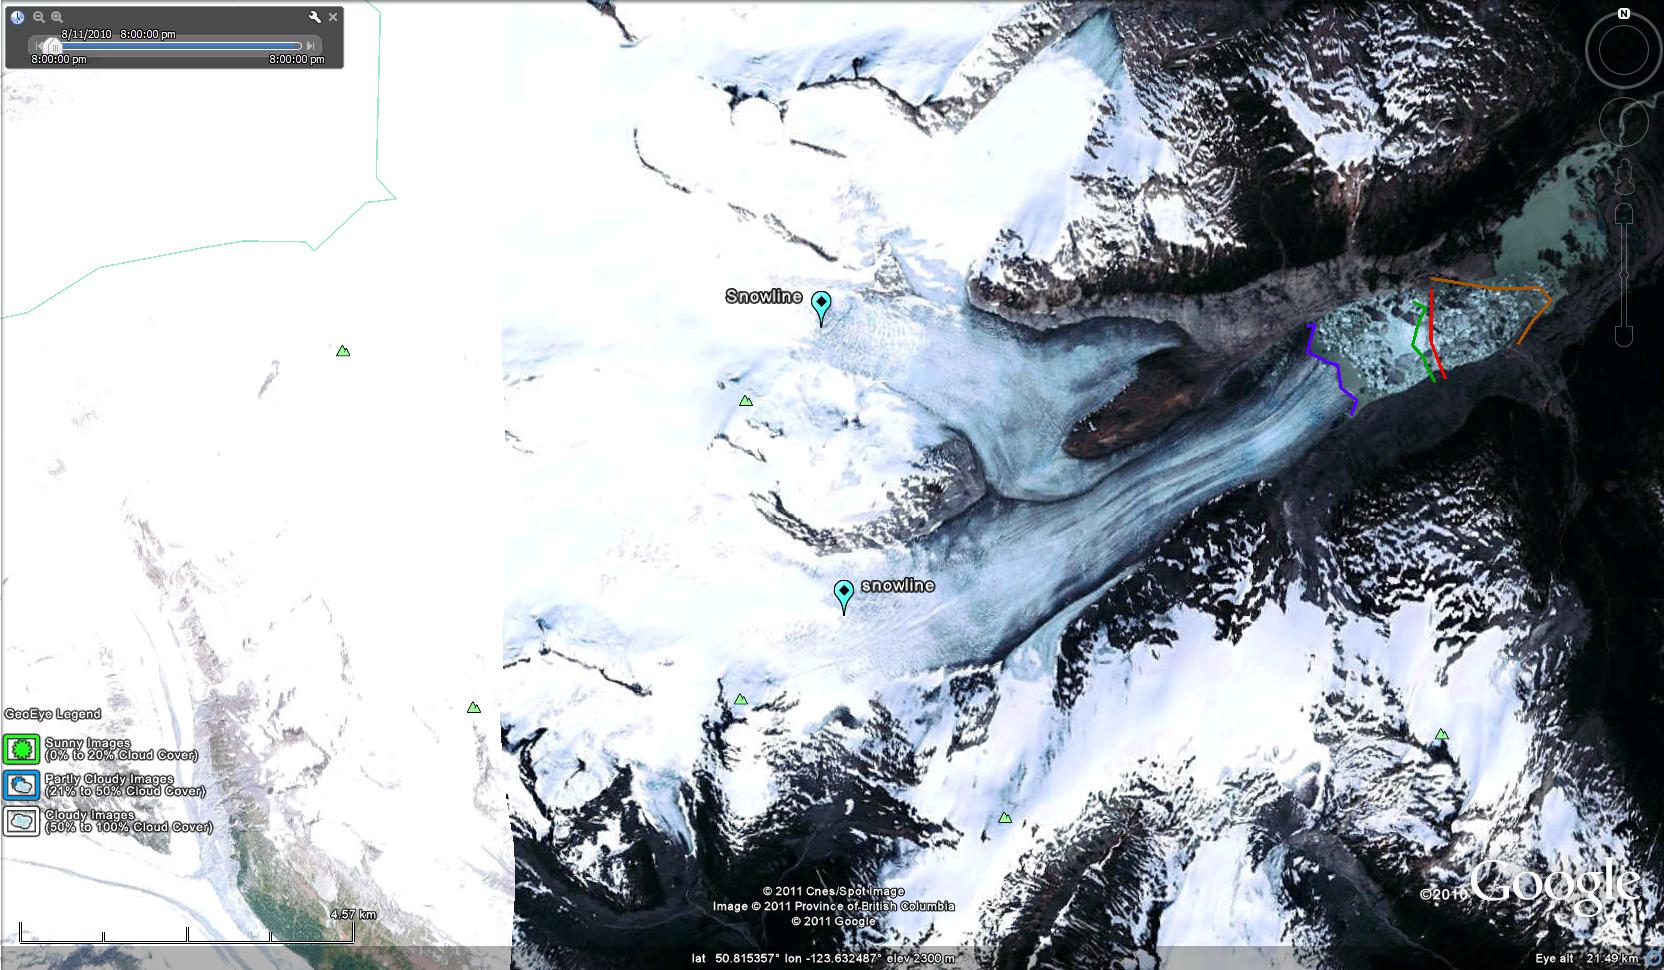
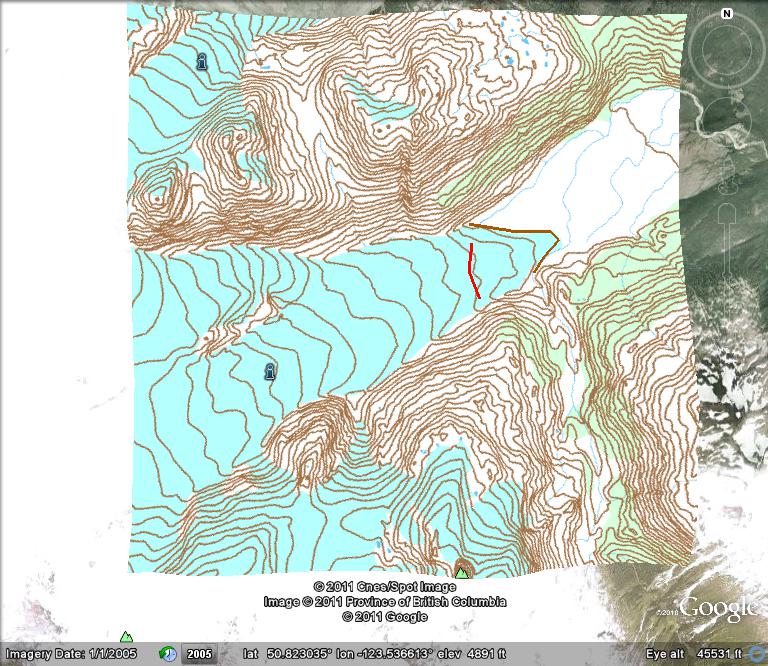
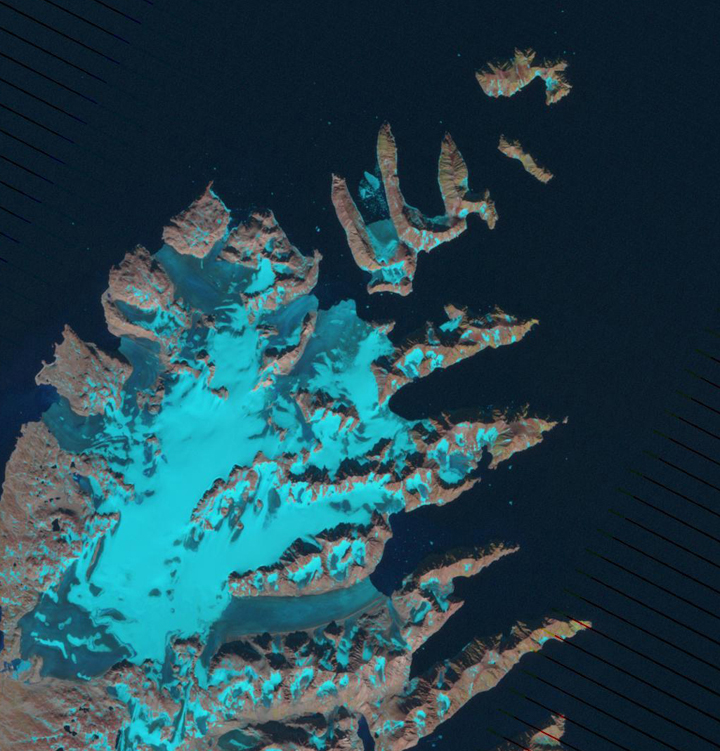
Bridge Glacier is an 17 km long outlet glacier of the Lilloet Icefield in British Columbia. The glacier ends in a rapidly expanding glacial lake with 1100 meters of retreat from 2005-2010. This 200+ m per year retreat is a substantial acceleration over the observed retreat rate of 30 m per year from 1981-2005 by Allen and Smith (2007). They examined the dendrolchronology of Holocene advances of the glacier and found up to 2005 a 3.3 kilometer advance from the primary terminal moraine band, with the most extensive advances being early in the Little Ice Age. The glacier currently ends at 1400 m and in 2010 had a late summer snowline of 2000 m. . The glacier terminus in 1970 is shown in map form, and is indicated by a brown line. The 2003 terminus position from a Landsat image, second image, is next with a red line marking the terminus. The normal Google Earth image, third image, is from 2005 and has a green line. An image from Geoeye from August 2010, last image, terminus purple line indicates the rapid acceleration of retreat. Retreat from 1970-2003 was 48 m per year. The retreat from 2003 to 2010 is 1400 meters, 200 m per year. This continued retreat and area loss will lead to glacier runoff decline in summer. This is crucial to the large Bridge River Hydro complex. This complex managed by BC Hydro can produce 490 MW of power. Stahl et al (2008) note in their modeling study of the glacier that ,”The model results revealed that Bridge Glacier is significantly out of equilibrium with the current climate, and even when a continuation of current climate is assumed, the glacier decreases in area by 20% over the next 50 to100 years. This retreat is accompanied by a similar decreasein summer streamflow.” This parallels our findings on the Skykomish River in the North Cascades, Washington Pelto (2008) and Pelto (2011).

Gilkey Glacier Ogive Spacing and Retreat

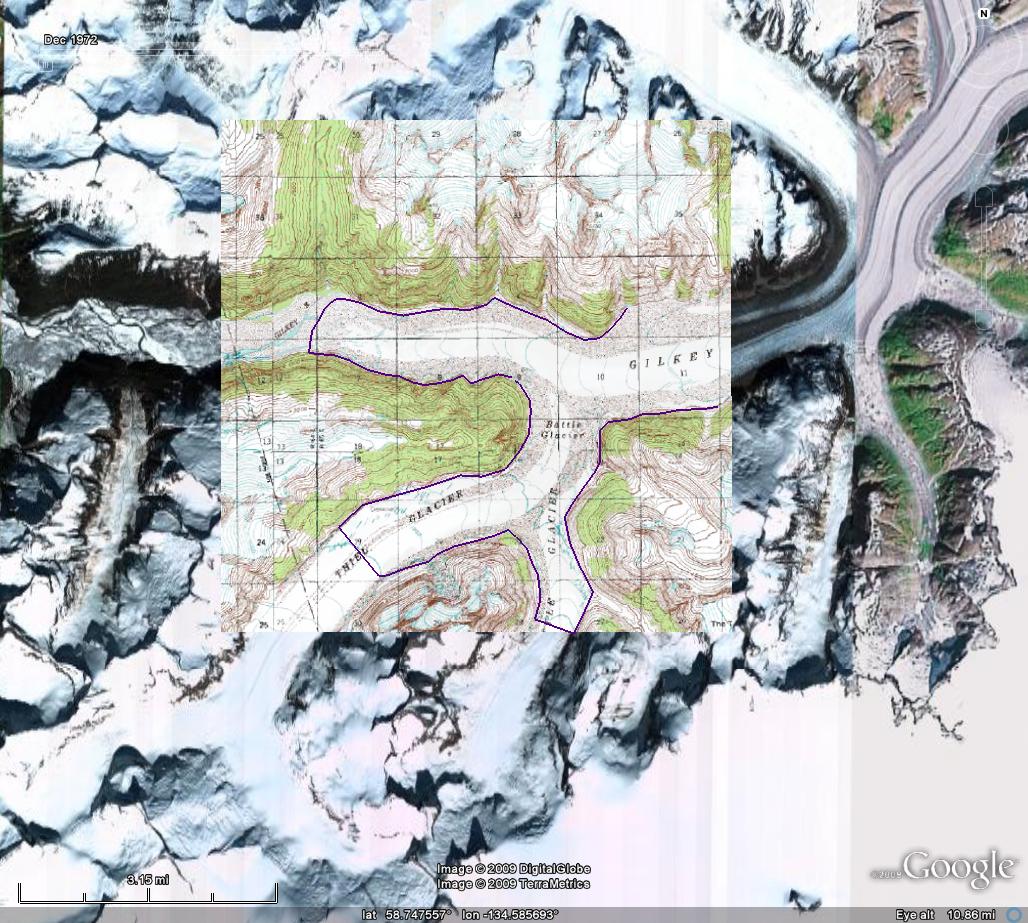
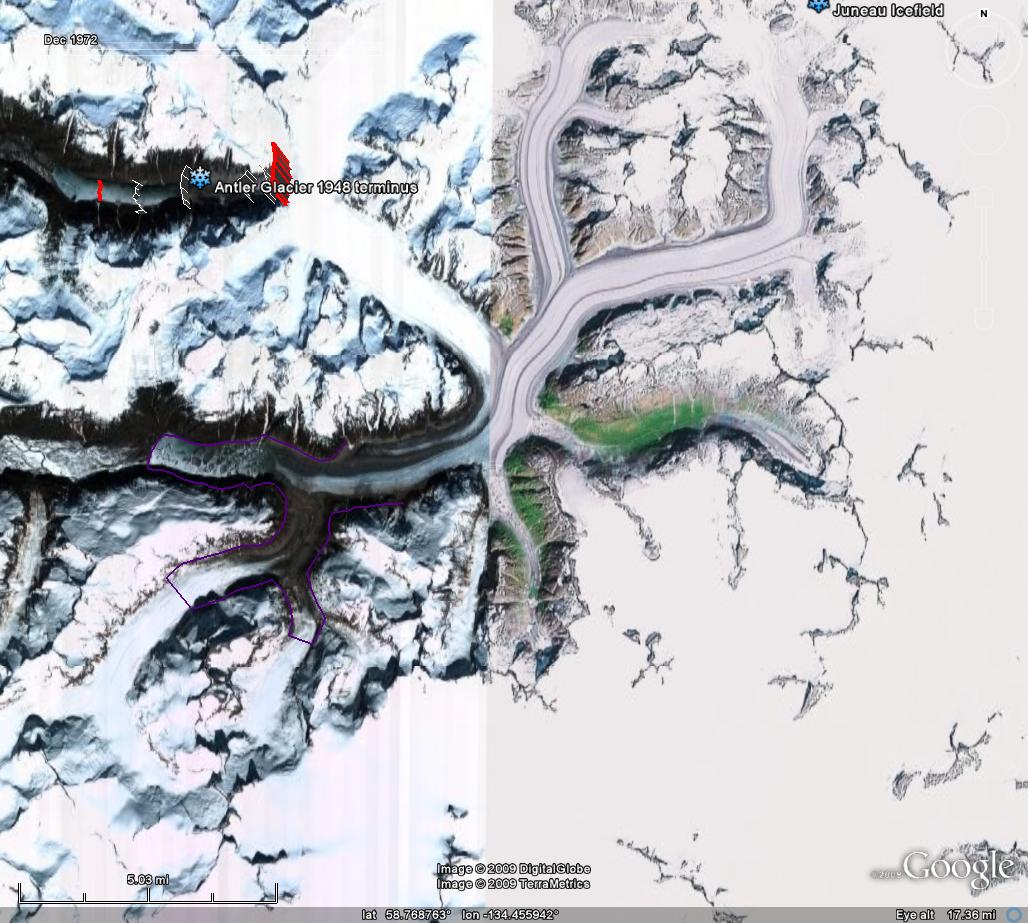
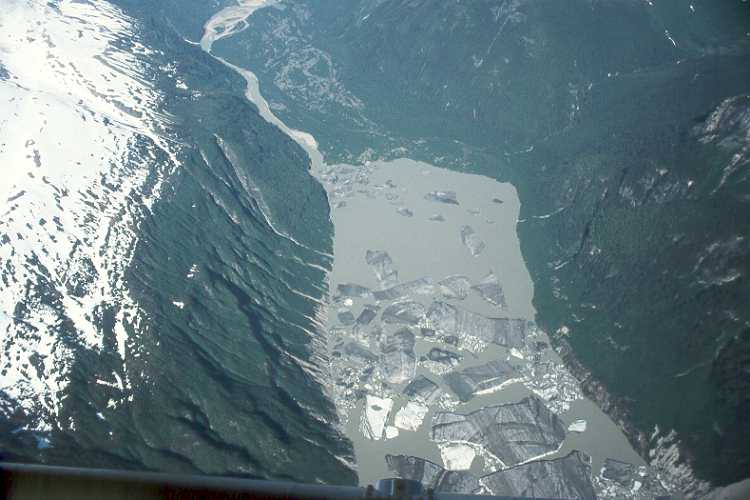
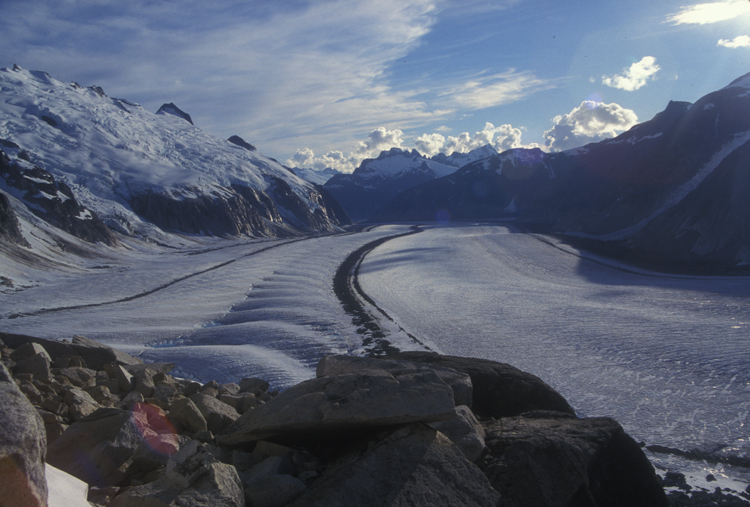
The Gilkey Glacier is a 32 km long outlet glacier flowing west from the Juneau Icefield. From 1948 to 1967 the Gilkey Glacier retreated 600 m and in 1961 a proglacial began to form. By 2005 Gilkey Glacier has retreated 3900 m from the 1948 terminus location. The glacier is currently terminating in this still growing lake, notice the new bergs and rifting at the glacier terminus. The retreat has been resulted from and in a thinning of in the lower reach of the glacier and the separation from Battle and Thiel Glacier. A major tributary to Gilkey Glacier, is Vaughan Lewis Glacier. At the base of the Vaughan Lewis Icefall where the Vaughan Lewis Glacier joins the larger Gilkey Glacier ogives form, as seen from above and below the icefall (Scott McGee). The ogives form annually and provide a means to assess annual velocity in this section of the glacier. Aerial photography of the ogives from the 1950’s combined with current satellite image provide the opportunity to assess ogive wavelength over a 50 year period, providing a long term velocity record for Gilkey Glacier. An ogive is a bulge-wave that forms annually due to a seasonal acceleration of the glacier through an icefall. The acceleration is enhanced in icefalls that are horizontally restricted. In most cases we do not have specific measurements of velocity through all season to ascertain the timing of the accelerated period, though typically spring would be the fastest. After formation the bulges move down glacier and a new bulge is formed the following year. The resulting train of ogives extending down glacier can be used to estimate the ice velocity by measuring the peak to peak separation between adjacent waves. Ogives can be visually identified as a series of arcuate wave crests and troughs pointing down glacier. Downglacier from this formation point the crests and troughs gradually flatten until the ogives are merely arcuate light and dark bands on the surface of the glacier. The dark bands are dense, blue and dusty ice that is compressed during summer, whereas the light bands are bubbly, white, air-filled ice that is compressed during winter.
In 1981 one of my tasks was to ski out through the top of the icefall inserting stakes in the crazily crevassed region to track summer velocity for the Juneau Icefield Research Program (JIRP). This has been completed often but not most years by JIRP. What we discovered was that velocity in 1981 had not changed from the 1960’s and 1970’s. Today we have frequent satellite imagery of the ogives to ascertain annual velocity that can be compared to the few aerial photographic records, in this case from 1056 and 1977. In several recent years Scott McGee of JIRP has specifically surveyed the distance between the first 11 ogive crest below the icefield. A comparison of the the ogives in 1956, 1977 and 2005 is possible by overlaying the images below. . The distance from the first to the 40th ogive has gone from 6.8 km in 1956 to 6.75 km in 1977 to 6.2 km in 2005. In 1956 and 1977 the first ten ogives spanned 1500 meters indicating an annual glacier velocity of 150 meters. From 2003-2007 the distance of the first ten ogives averaged 1440 m, or 144 meters per year. The change in velocity is quite small, compared to the large retreat of the glacier. One other key measure of the ogive surveying program is the surface elevation. A longitudinal profile containing 179 survey points was established at the base of the Icefall in 2001-2007. This profile begins in the trough immediately upglacier of the crest of the first wave ogive and continues downglacier nearly 1.8 kilometers to a point where the amplitude of the ogives becomes zero (Graphs and data from JIRP) During this six year time period, the surface has lowered an average of 17 meters – nearly 3 meters per year – along the longitudinal survey profile, with a maximum of 22 meters. This substantial thinning at the base of the icefall indicates reduced discharge through the icefall from the accumulation zone above. This will lead to further retreat and velocity reduction of Gilkey Glacier.