2025 North Cascade Glacier Climate Project Field Plan-42nd Year.

2025 Field Season: For the 42nd consecutive summer we are heading into the field to measure and communicate the impact of climate change on North Cascade glaciers. This year an overall focus of the project is supporting the UN’s “International Year for Glaciers’ Preservation”. This means focusing on glaciers that have disappeared and are in critical danger of disappearing in the next decade. Jill Pelto, Art Director and Mauri Pelto, Science Director

This field season follows the 2021-2024 seasons that featured either historic heat waves and/or periods of extended warm weather. The heat led to a greater exposure of bare ice on glaciers with a higher albedo and greater density. The observed melt rates are 7-9 cm/day water equivalent during warm weather events vs 4-6 for snow surfaces. This led to substantial mass losses on North Cascade glacier for the four years of over ~6 m. 

Science objectives: We will complete detailed measurements on 10 glaciers, three of which are part of the World Glacier Monitoring Service reference glacier network (48 glaciers globally), which have 30+ consecutive years of mass balance observations. This summer we will have an opportunity to assess the long-term ramifications of the 2013-2024 period of unprecedented mass balance losses and associated glacier changes, with detailed mass balance, crevasse depths and glacier surface elevation profiling.  We also focus on the impact of diminishing glacier size on downstream runoff.

Drilling and emplacing ablation stakes on Sholes Glacier.

Art Objectives: We will collaborate with several artists who will join us for a portion of the field season. They will be able to create their own work about the landscape and the science or may join us for fieldwork and make plans for future artwork. We hope to use this art to share our research with a broader audience and highlight the beauty and importance of these places. 

Cal Waichler Sketch of Lower Curtis Glacier.

Communication Objectives: We will leverage the brands of our expedition sponsors and the focus on vanishing glaciers that the UN brings this year. These organizations can help spread our message. We will utilize a combination of artists and scientists to tell the story.

From the Glaciers to the Sea: this is one of two paintings that tells stories of watersheds fed by North Cascade glaciers that flow out into the Puget Sound. The snowpack and glaciers in the mountains in this region provide crucial meltwater to river systems, many of which connect critically to the ocean.

Field Team 2025:

Jill Pelto (she/her) is an artist and scientist from New England who grew up loving winter sports and trips to the mountains. She incorporates scientific research and data into paintings and prints to communicate environmental changes. Her multi-disciplinary work weaves visual narratives that reveal the reality of human impacts on this planet. She completed both her B.A. degrees in Studio Art and Earth and Climate Science, and her M.S. focused on studying the stability of the Antarctic Ice Sheet at the University of Maine, spending two field seasons at a remote camp in the southern Transantarctic Mountains. Jill will be joining the project for her 15th field season. She is excited about continuing to document the change in North Cascade glaciers that she has witnessed each of the last ten years — through science and art.

Jill’s 2025 Paintings inspired by our work about the Skykomish River Watershed and the Nooksack River Watershed.

Mauri Pelto (he/him) has directed the project since its founding in 1984, spending more than 800 nights camped out adjacent to these glaciers. He is the United States representative to the World Glacier Monitoring Service. For 15 years he has been author of the blog “From a Glacier’s Perspective”, and associate editor for three science journals.  He is on the Science Advisory Board for NASA’s Earth Observatory. His primary position is Associate Provost at Nichols College, where he has been a professor since 1989. He either runs on trails or skis on alpine and cross country trails every day.

Emmett Elsom (he/him) is an environmental science student at Western Washington University from Portland, Oregon. Growing up mountaineering and backpacking in the Cascade Range, he developed a love for the region and a fascination with the complexities of its ecosystems. In 2024 he had an opportunity to work In the field with the Oregon Glaciers Institute, assisting with SNOTEL data collection and fieldwork. This year, he is looking forward to broadening his understanding of the ecological role of glaciers and their melt across the Pacific Northwest, and the power of utilizing art in science. 

Caitlin Quirk (she/her) is a Masters student of Environmental Humanities at the University of Utah. She writes essays and poetry about socio-environmental justice, land relations, and political ecologies of climate change. Before graduate school, Caitlin worked as a mountaineering instructor and environmental researcher. Through these roles, she formed deep relationships with glaciers throughout the Pacific Northwest.  

Katie Hovind (she/her) is an environmental science student at Western Washington University. She feels a deep connection to the Cascade mountains and their watersheds from growing up in this region, and hopes to share their beauty and importance with others. She was a field assistant with NCGCP last year, and is excited to continue collaborating this year to explore ways science and art can evoke caring—for protection of natural spaces and response to the climate crisis. This season, she will help conduct a vegetational succession study at the Easton’s terminus to observe the changing alpine plant growth in the wake of a receding glacier.

Margaret Kingston: is an oil painter and art educator from Winthrop, Washington. Originally from New Hampshire, she moved 3000 miles with her husband Jonathan Baker to the Methow Valley after visiting the North Cascades National Park. Landscapes of the Pacific Northwest have been her inspiration for the past 13 years, captured first through a photo then realistically painted on canvas. As a backcountry skier, hiker, and biker she captures the energy of places these activities take you. With funding from the Mary Kiesau Fellowship Grant, Margaret will plein air paint on site in honor of her friend Mary Kiesau. Her observations during time spent with the North Cascade Glacier Climate Project will be shared through the resulting artwork and at a community event in the Methow Valley. Learn more about Margaret Kingston’s work at MkOilPaintings.com 

Claire Sianna Seaman (she/her) is a painter, filmmaker, and printmaker from Leavenworth, WA. She holds a BA from Smith College in Studio Art, with a concentration in Climate Change. She is currently earning her MA in Human Geography at the University of British Columbia. Claire has been featured in the Wild and Scenic Film Festival Art Exhibition and received an Artist Trust GAP Award. She worked with scientists from the University of Washington Climate Impacts Group  to create an art piece that imagined climate resiliency in the Pacific Northwest. This piece is currently part of the 5th National Climate Assessment Art x Climate Gallery on display at the Smithsonian Natural History Museum in Washington, D.C https://www.clairesianna.com/

2025 Schedule 

July 28:   Hike In Columbia. 

July 29:   Columbia Glacier survey

July 30:   Hike Out Columbia/Hike in Lower Curtis

July 31:   Lower Curtis Glacier Survey

Aug. 1:    Hike out, Hike in Ptarmigan Ridge

Aug. 2:    Sholes Glacier

Aug. 3:    Rainbow Glacier

Aug. 4:    Rainbow Glacier

Aug. 5:    Hike out. Hike in Easton Glacier (Resupply in Bellingham WA) 

Aug. 6:    Easton Glacier

Aug. 7:    Deming Glacier

Aug. 8:    Easton Glacier

Aug. 9:    Easton Glacier

Aug. 10:  Hike in Mount Daniels

Aug. 11:  Mount Daniels Survey

Aug. 12:  Ice Worm Glacier Survey-Exit

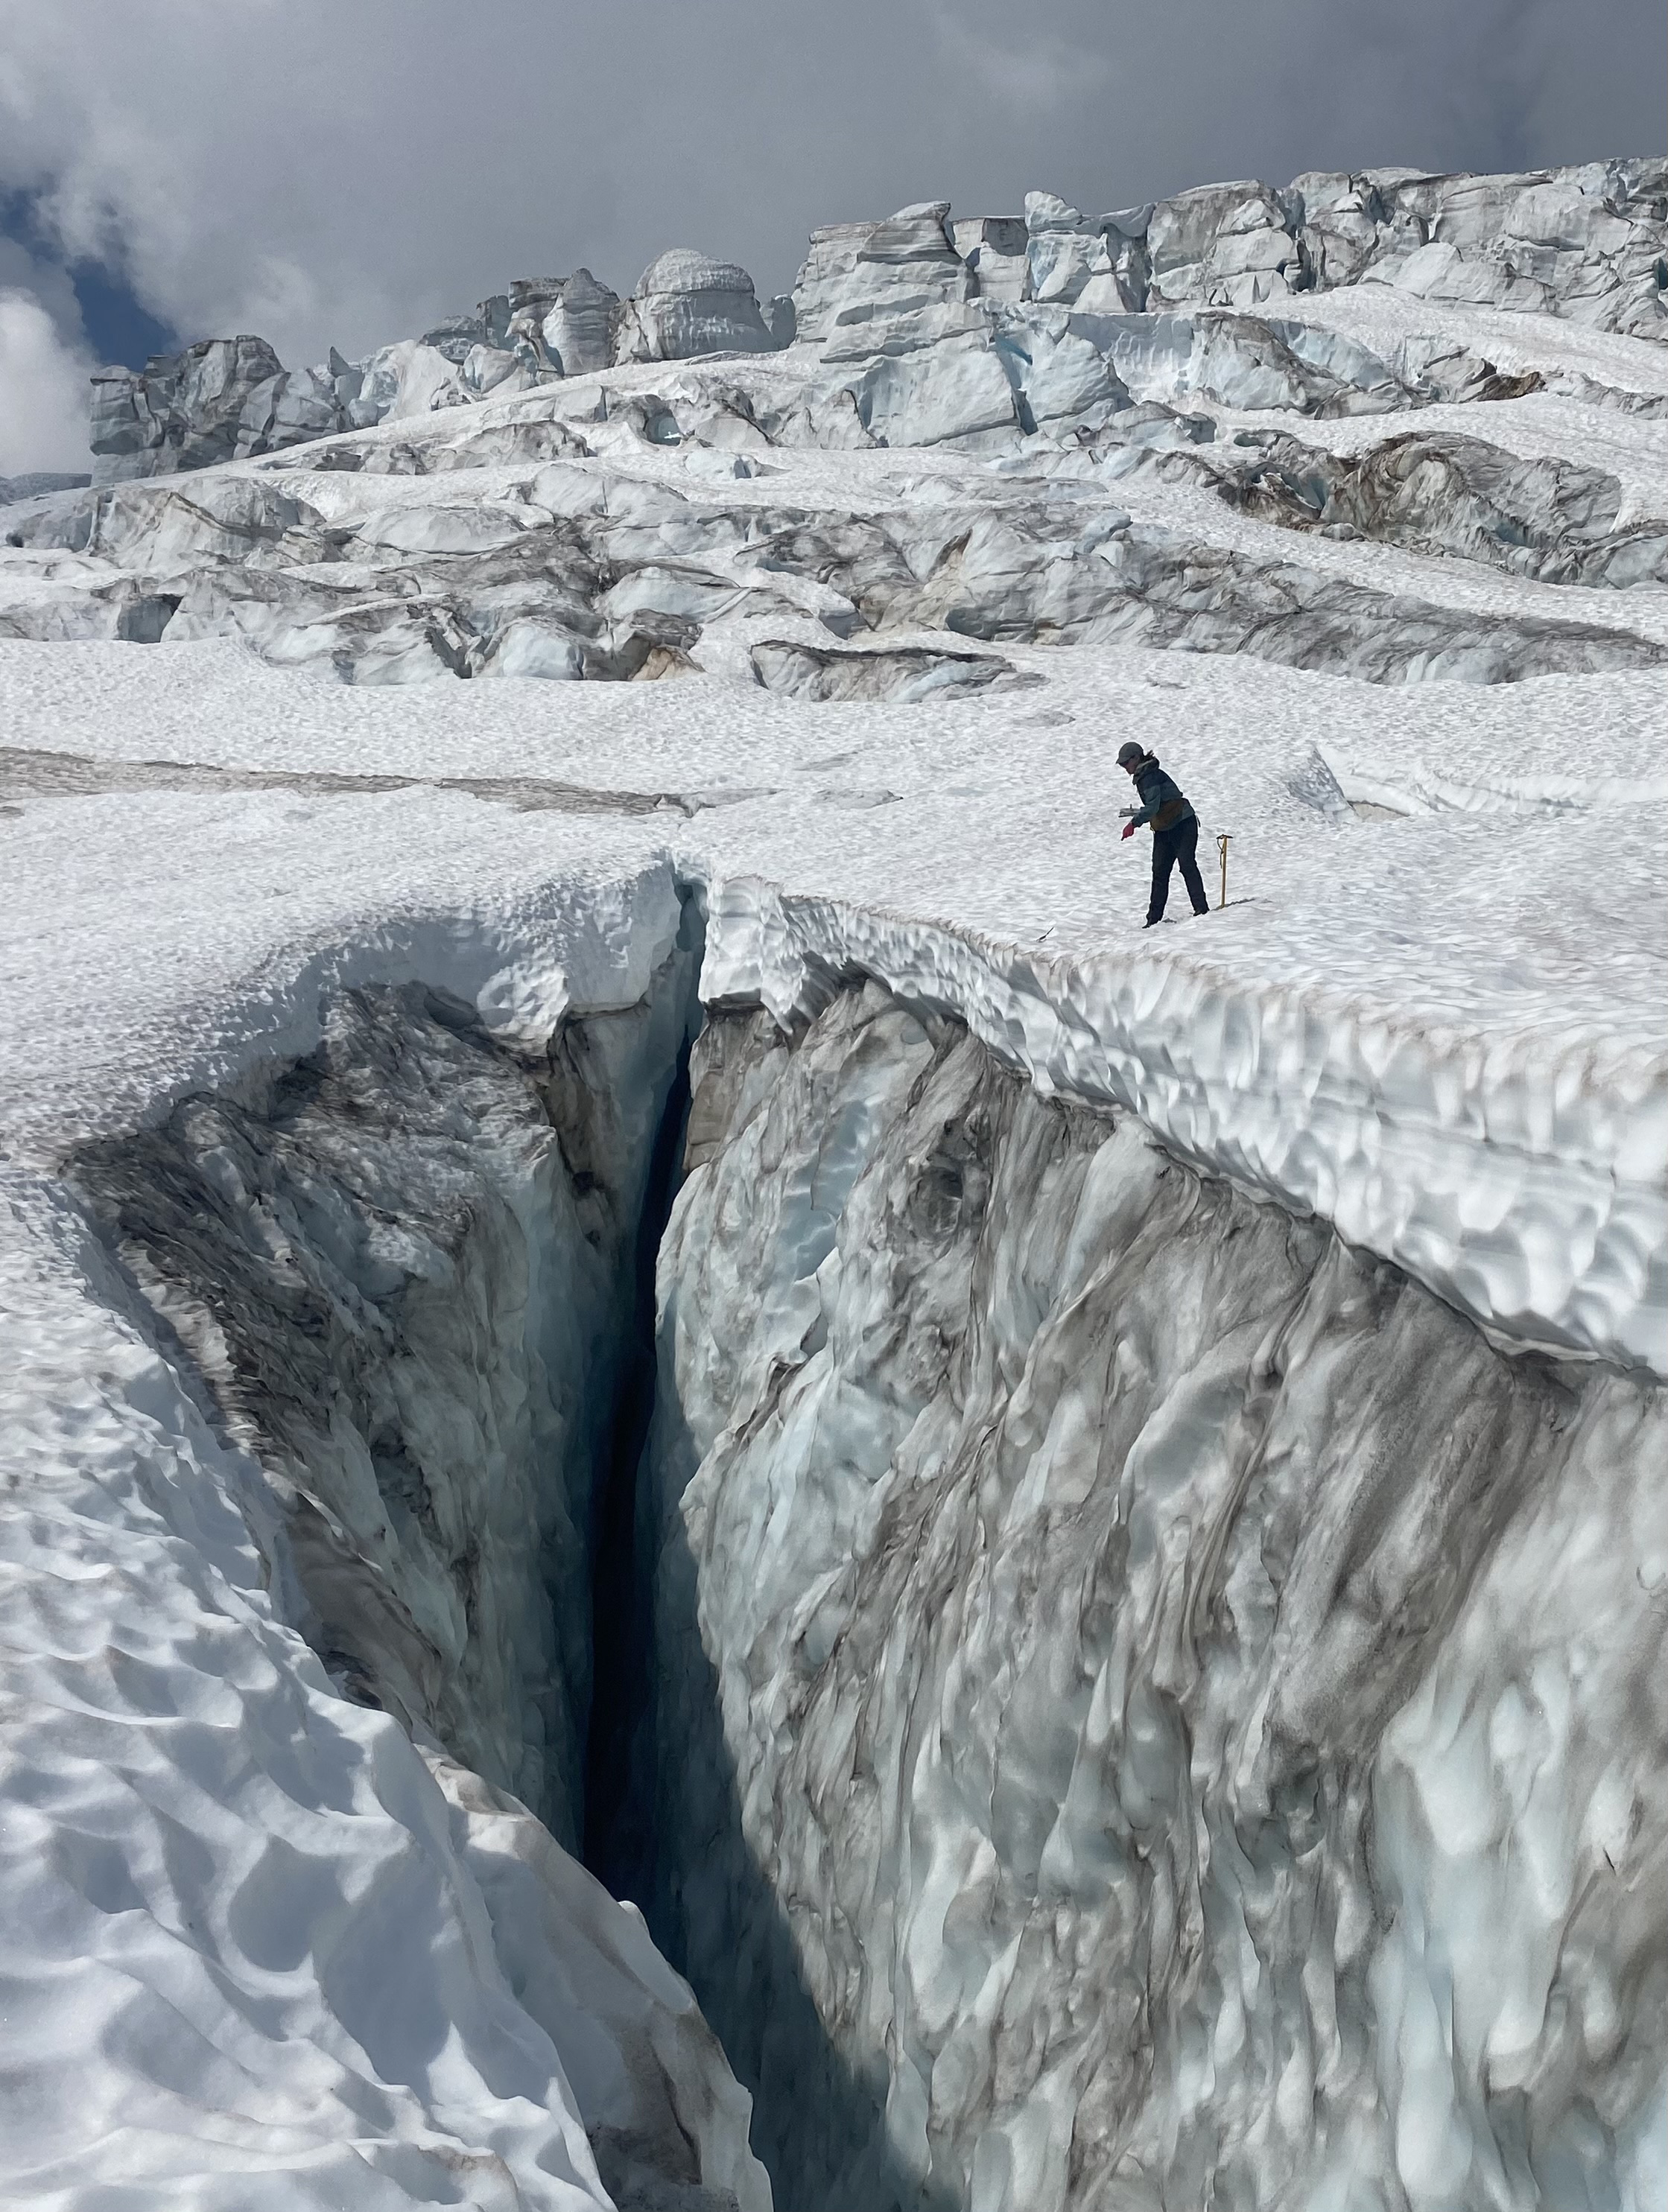
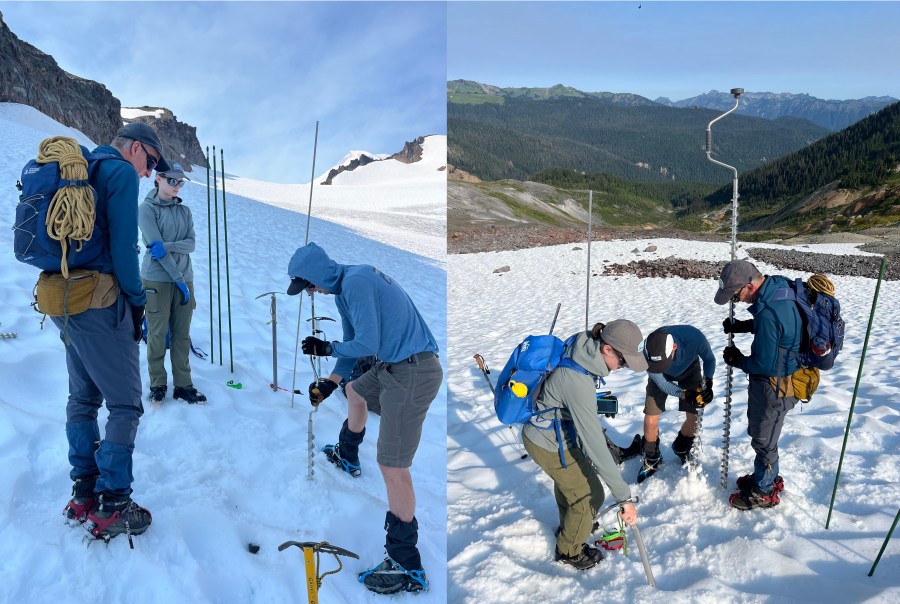
Assessing Crevasse Depth on Easton Glacier

Loss of Hinman Glacier, North Cascade Range 1958-2022

Himan Glacier in 1958 USGS map and in 2022 Sentinel 2 False Color image. The three ice masses with an area greater than 0.01 km² are indicated.

Hinman Glacier had descended the northwest flank of Mount Hinman in the North Cascades, Washington and based on 1958 aerial photographs, Hinman Glacier the USGS had listed this as the largest glacier in the North Cascades south of Glacier Peak with an area of 1.3 km² (Post el al 1971). In 2022 the glacier is gone with the largest relict fragment of ice at 0.04 km². This is the story of this glaciers demise that as documented by the North Cascade Glacier Climate Project, that for 40 years has observed in the field the response of glaciers to climate change.

Hinman Glacier in 1988 with 4 distinct ice masses.

In the 1960’s the glacier extended from the ridge top of Mount Hinman at 2250 m to the bottom of the valley at 1675 m. In 1988, Hinman Glacier from the west was  a group of four separated ice masses that we surveyed. The amount of blue exposed that year indicates the glacier lacked a consistent accumumulation zone. This is indicative of a glacier that cannot survive (Pelto, 2010).  In 1992 we mapped the largest of these remaining ice masses at 0.12 km², this was another year with only pockets of blue ice left. In 1998 the glacier has a few areas of blue ice are seen, the glacier was 20% of its mapped size 0.25 km².

In 2005 we observed how thin the ice was including being able to see rock at the bottom of several crevasses  (see below). In 2006, from a Google Earth image,at this point the glacier is no longer detectable under the snowcover that persisted that summer, note the map outline and the gorgeous new “Hinman” Lake  The new lake is 1 km long. A 2009 view from the far end, north end of Lake Hinman up the valley and mountain side that was covered by the Hinman Glacier, now 90% gone. Each of the two larger ice masses from 1998 is now divided into at least two smaller portions. By 2022 the ice fragments have further diminished with the largest just 0.04 km2, less than 4% of its 1958 size. The tendency of this former glacier to be bare of snowcover by late August in many years, is what led to the rapid loss. This same story is playing out on Foss Glacier on the other side of the ridge, though not as quickly.

Hinman Glacier thin sections of ice fragmenting in 2005.

The loss of glacier area of this glacier and in the Skykomish River Basin has impacted summer runoff in the Skykomish River watershed. From 1958-2009 glacier area declined from 3.8 km² to 2.1 km²,  (Pelto, 2011), and in 2022 has further diminished to 1.7 km², a 55% reduction. We have monitored all four major glaciers in the basin Columbia, Foss,  Hinman and Lynch Glacier, the primary glaciers in the basin, declined in area by 25%, 70%, 95% and 40% respectively since 1958. Despite 15% higher ablation rates during the 1985-2022 period, the 55% reduction in glacier area led to a 40-50% reduction in glacier runoff between 1958 and 2022. The impact on the Skykomish River is evident.

Glacier runoff on Hinman Glacier heading the Skykomish River. Streams like this used to drain across the glacier all summer long. Now they no longer exist to feed the Skykomish in late summer.

A key threshold of in-stream flow levels considered insufficient to maintain short term survival of fish stocks is below 10% of the mean annual flow (Tennant, 1976).   For the Skykomish River 10% of mean annual flow is 14 m3s-1.  In the Skykomish River from 1958-2021 there have been 363 melt season days with discharge below 14 m3s-1.  Of these only three occurred before 1985, and 67% have occurred since 2003. The loss of 55% of the glacier runoff is a key reason for the onset of critical low flow days. Of more concern for aquatic life is the occurrence of extended periods of low flow (Tennant, 1976). From 1929-2021 in the Skykomish River basin there have been 12 years where streamflow dropped below 14 m3s-1 for 10 consecutive days during the melt season, 1986, 1987, 1992, 1998,  2003, 2005, 2006, 2007, 2015, 2017, 2019, 2021 and 2022.  Precipitation has not declined during this interval, hence earlier snowmelt, reduced glacier runoff and greater evapotranspiration must be causing the increase in late summer low flow periods.

In 2022 a cool start to summer allowed snowpack to persist in the basin into August. Runoff was strong from Columbia Glacier on Aug.1 as we forded the outlet stream, see below. By September glaciers represented the main area of melt. An extended warm period extending into October led to persistent low flow conditions, below 495 cfs (14 m³/sec), from Sept 9.-Oct. 20.

The former Himan Glacier from the new”Hinman” Lake that has formed since 1958 with glacier retreat, 3 small ice patches remain in this 2009 view.

Hinman Glacier basin in 2006 Google Earth view, with “Hinman Lake”.

Himan Basin in Open Elevation map and in 2022 Sentinel 2 False Color image. 

Streamflow and temperature in the Skykomish River at the USGS site at Gold Bar. Period of low flow begins after flow drops below ~500 CFS.

(https://waterdata.usgs.gov/monitoring-location/12134500/)

Fording headwaters of North Fork Skykomish, which is the runoff from Columbia Glacier, on 8-1-2022. 

The Disappearance of Multiple Baffin Island Glaciers 2002-2019

Glaciers at Point A and B have melted completely away.

The commemoration of a single disappearing glacier in Iceland, Okjokull has brought attention to what is quite a common event this decade, glacier disappearance. Here we report on a number of glaciers in the southern part of the Cumberland Peninsula, Baffin Island  that have either disappeared or separated into several parts  from 2002-2019. Way (2015) noted that on the next peninsula to the west, Terra Nivea and Grinnell Ice Cap had lost 20% of their area in the last three decades. The retreat and disappearance of ice caps in the area have led to a INSTAAR project at UColorado-Boulder examining vegetation that had been buried and is now being exposed.  This year the high snowlines by early June have led to the near complete loss of snowpack across glaciers of the region.  The melt rate of the exposed ice is higher than that of the snowcovered portion of the glaciers.

In the first image a small valley glacier at Point A has melted completely away.  At Point B a small plateau glacier is gone.  At Point C a remanent is left, though it cannot survive long now.  Below  the slope glacier at Point F is gone.  The plateau glacier at point G is gone.  The niche glacier at point E has separated into three small parts.

Glaciers at Point F and G have melted completely away.

Glacier at Point H has melted completely away.

At Point H a plateau glacier has been lost. At Point I two interconnected glaciers have separated into five smaller glaciers. Below the plateau glaciers at Point J and L have been lost.  At Point K a combination icecap-valley galciers has now separated into three parts.  At Point M an interconnected ice cap now consists of of six small glacier parts. The plateau glacier an Point N has been lost.  The slope glacier at Point O has been lost.  The disintegration and separation has been noted at other locations in the region such as Coutts Ice Cap and Borden Peninsula.

Glaciers at Point J and L have melted completely away.

Glaciers at Point N and O have melted completely away.

Galaxy Glacier Rapid Retreat, Pukulkul Basin Glacier disappears, British Columbia

Over the ridge south from Stave Glacier is a 1.5 km long unnamed glacier, that is on the west flank of Galaxy Peak, hence referred to here as Galaxy Glacier. The glacier is in Garibaldi Provinical Park, British Columbia. galaxy areaKoch et al (2009) in their detailed survey of glaciers in the park chronicled the Park’s glacier retreat from 1952 to 2002. Koch et al (2009) Found that all 45 glaciers are retreating, and Stave Glacier was experiencing its fastest retreat from 1976-1996, with a 750 m retreat. Satellite imagery from 2012 indicates the Stave Glacier retreat rate from 1996 to 2012 is 1600 m or 100 m per year, even faster. Here we utilize Landsat imagery from 1985, 1987, 1992 and 2009, plus Google Earth imagery form 2006 to examine the retreat and separation of Galaxy Glacier. The orange arrow indicates the terminus of the Galaxy Glacier (G) in 1985 where it joined the glacier (P) in the Pukulkul Basin where several lakes have been forming. This basin is just north of Pukulkul Peak. In 1985 Galaxy Glacier and the Pukulkul Basin Glacier are joined at the orange arrow, the red arrow marks the 2009 terminus and the purple arrow indicates the connection to the highest accumulation area on the east slope of Corbold Peak. By 1987 Galaxy Glacier has separated from the Pukulkul Basin Glacier, the latter has an area of 0.45 square kilometers and is larger than the lake it ends in. By 1992 the Galaxy Glacier is separated by 500 meters from Pukulkul Basin Glacier. The area of bare rock at the purple arrow at the top of Galaxy Glacier has expanded. By 2006 the Pukulkul Basin Glacier is gone and a 2.5 km long series of lakes is in its place. Galaxy Glacier has retreated 800 m from the new lake, and 650 meters from its 1985 position. The purple arrow indicates two large rock outcrops effectively ending significant glacier inflow from the upper east slopes of Corbold Peak. By 2009 the Pukulkul Basin Lake has a deeper blue as the glacier input has declined. The glacier is 90% bare of snowcover and the bedrock at the purple arrow has continued to expand. A closeup of the glacier from the 2006 Google Earth imagery indicates exposed firn layers at the blue arrows. This indicates that all the snowcover not just from the most recent winter has been lost but a number of previous winters as well. This is indicative of a glacier that has no consistent accumulation zone and cannot survive (Pelto, 2010). This glacier similar to the nearby Helm Glacier cannot survive current climate. The purple arrows indicate the limited connection to the upper slopes of Corbold Peak. The red arrow indicates the current terminus position. Galaxy Glacier has lost half of its area in the last 25 years, and the 800 m retreat is one-third of its total length. galaxy glacier 1985
1985 Landsat

galaxy glacier 1987
1987 Landsat

galaxy glacier 1992
1992 Landsat

galaxy glacier 2006
2006 Google Earth

galaxy glacier 2009
2009 Landsat

galaxy glacier closeup
2006 Google Earth Cloesup

Death of a Glacier, Whitechuck Glacier, Washington

The Whitechuck Glacier supplies flow to the headwaters of the Whitechuck River. Its white expanse has graced these headwaters for thousands of years. The Whitechuck Glacier retreated slowly from its advanced Little Ice Age position until 1930, while rapidly thinning. Thus, prepared it began a rapid retreat in 1930. This rapid retreat culminated in the total disappearance of the north branch of the glacier in 2001. No more does this glacier dominate the headwaters, and its demise has and will continue to alter the hydrology of the Whitechuck River headwaters. How did this glacier die and what are the impacts when a glacier disappears? This is the glacier that also led to the first glacier survival forecast model.

A progressive temperature rise from the 1880’s to the 1940’s led to ubiquitous retreat of North Cascade glaciers. The Whitechuck Glacier was no exception: by 1950 the glacier’s northern terminus had retreated 1050 m and the southern terminus 750 m. More importantly the glacier had thinned dramatically. The glacier had flowed down relatively gentle slopes into a large flat basin. The 1967 aerial photograph of the area from Austin Post, USGS indicates the two merged branches of the glacier North Branch (NB) and south Branch (SB), note the lack of snowcover on the North Branch (Figure 1).

The USGS topographic maps of Glacier Peak from 1958 show the still large Whitechuck Glacier with an area of 3.1 km2 (Post et al., 1971). The USGS remapped the area based on aerial photographs from 1983.and this map still has two branches with two termini, the northern branch feeding the northern terminus, and the southern branch feeding both the northern and southern terminus. Both branches exceeded a mile in length in the 1950’s (Figure 2).whch67

whitechuck 1983

The 1984 the USGS maps of the East Glacier Peak and West Glacier Peak quadrangles indicate the southern terminus had retreated 450 m, from the 1958 map terminus position. The northern terminus had retreated 180 m and was still near the lip of a basin at 1975 m. In 1988 during our field visit the southern terminus of the glacier ended in a new lake #1 at 2020 m (Figure 3). The lake is not in evidence on the 1984 updated USGS topographic maps or in 1979 aerial photographs of the area. The terminus had retreated 510 m since 1955, and 140 m since 1967. The lake that had been the terminus location in the 1958 map still exists, but is now 375 m from the edge of the new terminal lake, and has recessional moraines evident (Figure 4). The south branch of the glacier is thin and stagnant in the lower 200 m. Above this point crevasses are in evidence and the convex profile indicates that the south branch was still an active glacier in 1988. This remains the case in 2005, while in the former location of the north Branch several small lakes are evident where the glacier used to be.whch88cl

whitechuck recessional

The northern terminus of the Whitechuck Glacier ends in a lake basin at 1980 m in 1988. This basin was filled with glacier ice in 1967. In 1988, the new lake was 210 m long and still expanding. Total retreat of the terminus from 1955-1988 was 410 m. The northern half of Whitechuck Glacier extending up to Glacier Gap was a rapidly melting, concave, stagnant ice mass in 1988. The north branch had no crevassing and even the ice at the glacier surface lacks the normal blue ice color of glacier ice. Instead it was a dull dark grey color. The distance from the terminus to the top of this section of glacier is 1550 m. Total glacier area has decreased from 3.1 km2 in 1958 to 1.8 km2 in 1988 (Figure 5).whch88

1995 the southern terminus had retreated an additional 50 m expanding the lake #1 at the terminus (Figure 6). The south branch of the glacier no longer actively feeds the northern terminus, as the ice had become to thin for motion. The glacier ended in the lake on a gentle slope. The northern lobe was stagnant ice with no retained snowcover, and was only a narrow 500 m long section of ice, we quickly ascended this section on crampons in 1995. The upper most section had separated from the main body of the glacier at 2134 m. The area of the glacier had declined to 1.6 km2 in 1995.(Figure 7)
In 2002, the northern branch of the glacier was entirely gone. Instead of an ice filled valley extending 1.6 km from the lake to Glacier Gap at the former head of the glacier, there was a boulder-filled basin. There is a new lake #3 that has developed at 2000 m, 400 m northeast of the terminus lake #2. The walk to Glacier Gap took much longer picking our way through the loose bouldery terrain.whitechuck 1995 terminus

whitechuck 1995 ge

Upon our return in 2002 the entire northern branch was gone. The southern branch was thin and viewed from the 1950 terminus position lake illustrates the retreat. The southern lobe of the glacier is still thinning slowly, and retreating. A comparison of glacier surface elevation in 1983 and 2002 identifies the average thinning in the twenty year period from the USGS aerial photography in 1983 to 2002, for the northern branch is 15 m. For the southern branch the average thinning is 6 m. The total area of glacier ice left including the stagnant section by the northern terminus is 0.9 km2 less than 30% of the area of just 30 years ago. At the current rate of thinning and given the current ice thickness of 35 m this glacier will endure for the first half of this century. The south branch is not close to equilibrium and though its retreat is hastened by the recent warm weather. A comparison of the glacier viewed from Glacier Gap illustrates the change, in 1973. A view of the basin in 2005 indicates the four lakes that have formed the lack of a north branch and the limited snowcover on the south branch. (Neil Hinckley photo) and 2006 (Leor Pantilat photo) (Figure 8 and Figure 9)whitechuck north branch

whitechuck 2005

The largest and deepest is Lake #2 this is where the two glaciers used to intersect. A 2006 Google Earth view illustrates the glacier extent down to 0.7 km2 in 2006 from 3.1 km2 in 1958 (Figure 10and 11) .
whitechuckbasin2

whitchuck ge 2006

The retreat of this one glacier has led to the development of six new lakes, three in the last thirty years. By 2010 the relict ice around lake #2 was gone (Figure 12).
The 3.4 km2 of new bare bouldery surface can be slowly colonized by vegetation. Compared to many areas of glacial retreat where natural revegetation takes place fairly rapidly, there it is an achingly slow process, where even the portions of the basin exposed for fifty years have gained little colonizing vegetation. This may be because of the extremely limited growing season (the basin still has snowcover into July), and its relative isolation from seed sources. The loss of area has impacted glacier biota, such as ice worms, springtails, algae, bacteria, and other invertebrates and microbial organisms living on and in under these glaciers. This represents a substantial loss in biological processing and material that would otherwise be transferred downstream. whitechuck glacier lake #2

The amount of runoff entering the Whitechuck River has declined substantially in the summer. For thousands of years each square meter of glacier has contributed 800 gallons of runoff from July I-October 1. With the loss of glacier ice, this contribution should drop by 65-80% based on observations at two other sites where glaciers have disappeared (Pelto, 1993 & 2008). The change since 1950 in glacier area has reduced summer glacier runoff by 1.5 billion gallons annually. This represents a loss of between 20 and 25 cfs for the Whitechuck River during the July-September period. The water will also be less sediment laden and warmer. The impact will be less water for the fall salmon runs, and less food in amount and processing for stream invertebrates on which salmon feed downstream in the Sauk and Skagit Rivers. This mirrors the change in the Skykomish River Basin (Pelto, 2010). Two of the field visits to this area were with the late Cliff Hedlund, Corvallis, OR who did in fact sew his own gear.
hedlund

Grasshopper Glacier, Montana-nearly gone

Grasshopper Glacier, the largest is located about 19 km. north of Cook, Montana within Custer National Forest. The glacier on Iceberg Peak occupies a north facing cirque at nearly 3300 m. (11,000 ft.). In 1940, it was about 1.6 km. wide and on its northwest side terminated in a 15-m. cliff. In 1966, seen below, the glacier had an area of 0.42 square kilometers. The name of the glacier is derived from the myriads of grasshoppers that were embedded in the ice. These grasshoppers either were downed by sudden storms or were carried over the glacier by strong air currents, where the cold forced them onto the ice surface. The grasshoppers are an extinct type of Rocky Mountain grasshoppper Melanoplus spretus. They perished here, were buried by new snow and preserved. At the time the glacier ended in a small lake. Progressively the glacier has retreated. By 1966 it was 0.6 km long, in 1994, seen below, 0.36 km long and in 2006 0.27 km long.

In 2005 this glacier has ceased to exist as a glacier, there are a few remnant perennial snow and ice patches the largest with an area of 0.05 km2. In the majority of recent summers the glacier has lost all of its snowcover. Glacier survival is dependent on consistent accumulation retained on the glacier each summer, this glacier will not survive. The glacier has continued its rapid recession and the further segmentation into small disconnected segments, heralds the end of an active glacier. We do have a gorgeous new alpine lake in its place. Notice the basin is still largely devoid of plant life and the surface still has the color of newly exposed-deposited sediments.

Hinman Glacier, North Cascades disappears

In the USGS map for Mount Daniels-Mount Hinman in the North Cascades, Washington based on 1958 aerial photographs, overlain in Google Earth. Hinman Glacier is the largest glacier in the North Cascades south of Glacier Peak. Today it is nearly gone. Hinman Lake, unofficial name, has taken the place of the former glacier, which still has a couple of separated relict ice masses. From 1984-2007 all 47 glaciers observed by the North Cascade Glacier Climate Project receded. Hinman Glacier has had one of the more dramatic retreats. Immediately below is the 1965 Mount Daniels Quadrangle USGS map of the glacier. The glacier extends from the top of Mount Hinman at 7600 feet to the bottom of the valley at 5000 feet. The next image is of Hinman Glacier from the west in 1988,the Hinman Glacier is now a group of four separated ice masses, three are significant in size still. The third image in the sequence is the 1998 aerial image of the glacier a few areas of blue ice are seen, the glacier is 20% of its mapped size. There are still three sections of remanant blue glacier ice. The next picture in the chain is the glacier in 2006, from a Google Earth image,at this point the glacier is no longer detectable under the snowcover, note the map outline and the gorgeous new unnamed Lake Hinman. The new lake 0.6 miles (one kilometer long). Lastly is a 2009 view from the far end, north end of Lake Hinman up the valley and mountain side that was covered by the Hinman Glacier, now 90% gone. Each of the two larger ice masses from 1998 is now divided into at least two smaller portions. This is no longer a glacier and is just a few relict pieces of ice, the largest has an area of 0.05 square kilometers.

Stubai Glacier’s Protective Blanket

The north facing side of the Stubai Glacier, also referred to as the Schaufel Ferner, that comprises the biggest ski area in the area is open all summer down to the Eisgrat lift station. There are two main lifts that traverse up the glacier, some of the towers for the ski lifts are set right on the glacier. The linear features extending down glacier in this satellite view of the glacier are the ski lifts and the ski runs. stubai glacier view
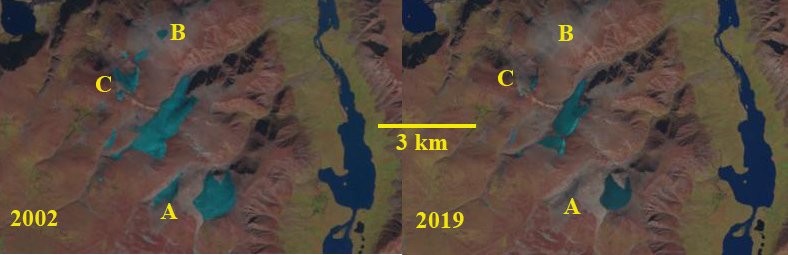
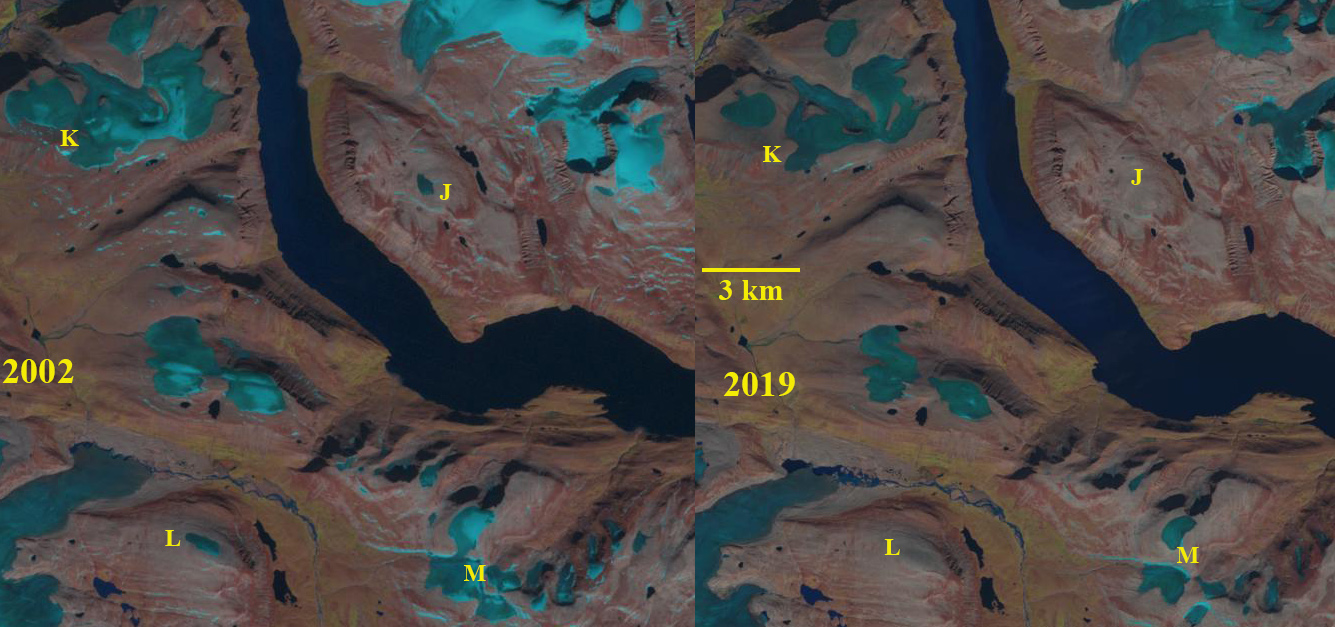
The Stubai Glacier has been retreating and thinning significantly as have most all glaciers in the Alps. Austria has a long term program monitoring the terminus position of over 100 glaciers. From 2000-2005 of the 115 glaciers observed and reported to the World Glacier Monitoring Service, all 115 experienced net retreat. The mass balance of Austrian glaciers, which represents volume loss, reported to the WGMS has been averaging a loss of more than 0.5 m per year since 1998. The loss of 5 m of ice in a decade on glaciers like the Stubai represents about 10% of their volume lost this decade. Stubai Glacier has experiences a 33% loss in its area since 1969 shrinking from 1.72 to 1.15 square kilometers (Aberman and others, 2009). This ongoing ice loss prompted the ski area in 2003 to begin to explore means to preserve the glacier and maintain there ski season. They turned to the University of Innsbruck’s Andrea Fischer and Marc Olefs, who explored three means to reduce the summer melting. Olefs and Fisher (2007) Innsbruck University.The first was injecting water during the winter into the cold snowpack to make it denser. This did add mass, but did not reduce the melt rate. The second methods was to pack down the snow periodically in the winter, again making it denser. Likewise this did not reduce ablation. This is not surprising given that ablation rates on dense ice and less dense snow are very similar on glaciers. The third method was to cover the glacier with a blanket, they used both felt and plastic. The plastic was more reflective, thinner and easier to deploy and as seen in the next two photographs blends in well with the glacier surface. The top image is from Ineedsnow.com.stubai_may 070122_austria_glacier_hmed10a.hmediumThis technique reduced ablation by 60%. Is snow making now being employed a better answer? The problem is that even one small glacier ski slope is still a large area to cover. Because of this success in 2005, the ski resort continues to employ these white polyethylene sheets to reduce melting in strategic areas on the glacier. They are typically spread out in May. The sheets can be seen emplaced around the lift towers in particular. The bare ice of the main section of the glacier is an area of 400,000 square meters (4,300,000 square feet) tough to cover with material, even if it is a low cost per square meter. This type of geoengineering applied to just part of one small glacier maybe practical, but it is not practical at a significant scale. The severity of the climate change we are experiencing is emphasized by the extent to which the ski area is being forced to adapt to try and maintain its summer ski area. In the pictures below, the problem is illustrated by the extent of bare glacier ice late in summer. The ski lifts are apparent as are the square snow patches around the lift towers in the upper image. In the lower image the view from the gondola shows a glacier with very little snow remaining, this is a sign of a glacier that is quickly losing mass. 20060727-080631_eisjoch_bahnen_bildstoecklferner_zoom_vo_station_eisgratstubai ablation