Rainbow Glacier Not Fading Away, Glacier National Park

Rainbow Glacier is the third largest of the 25 remaining glaciers in Glacier National Park occupying an east facing cirque between 2650 m and 2330 m. The glacier drains into Quartz Lake a key lake for bull trout in GNP, which are threatened by both invasive lake trout and climate change (Jones et al, 2013).  The National Park Serice and USGS have been established a glacier monitoring program that focuses on repeat photography, mass balance observations on Sperry Glacier and area change. GNP has lost the majority of the 150 glaciers that existed. The USGS reports that Rainbow Glacier had an area of 1.28 square kilometers in 1966 declining to 1.16 square kilometers in 2005, a 9.3% reduction. Has this slow rate of retreat continued? Here we examine Google Earth imagery from 1990-2013 and imagery taken by John Scurlock  compiled by Glaciers of the American West at Portland State University,

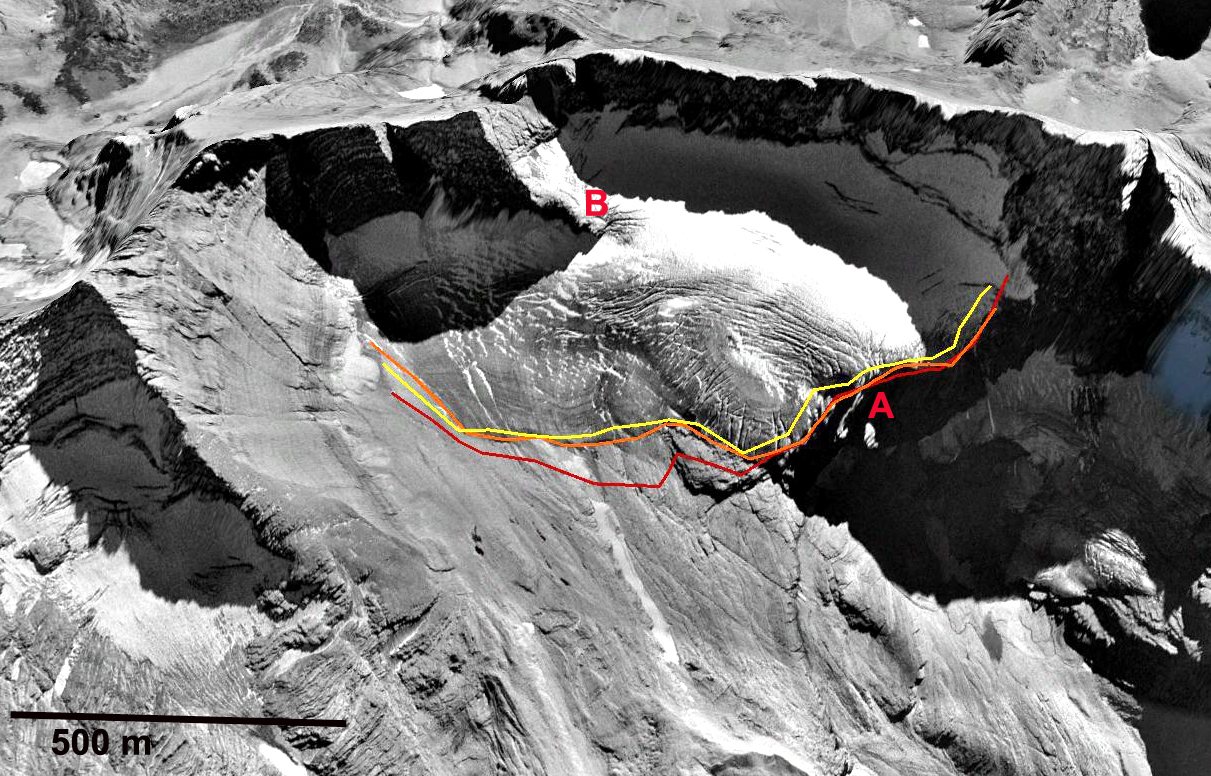
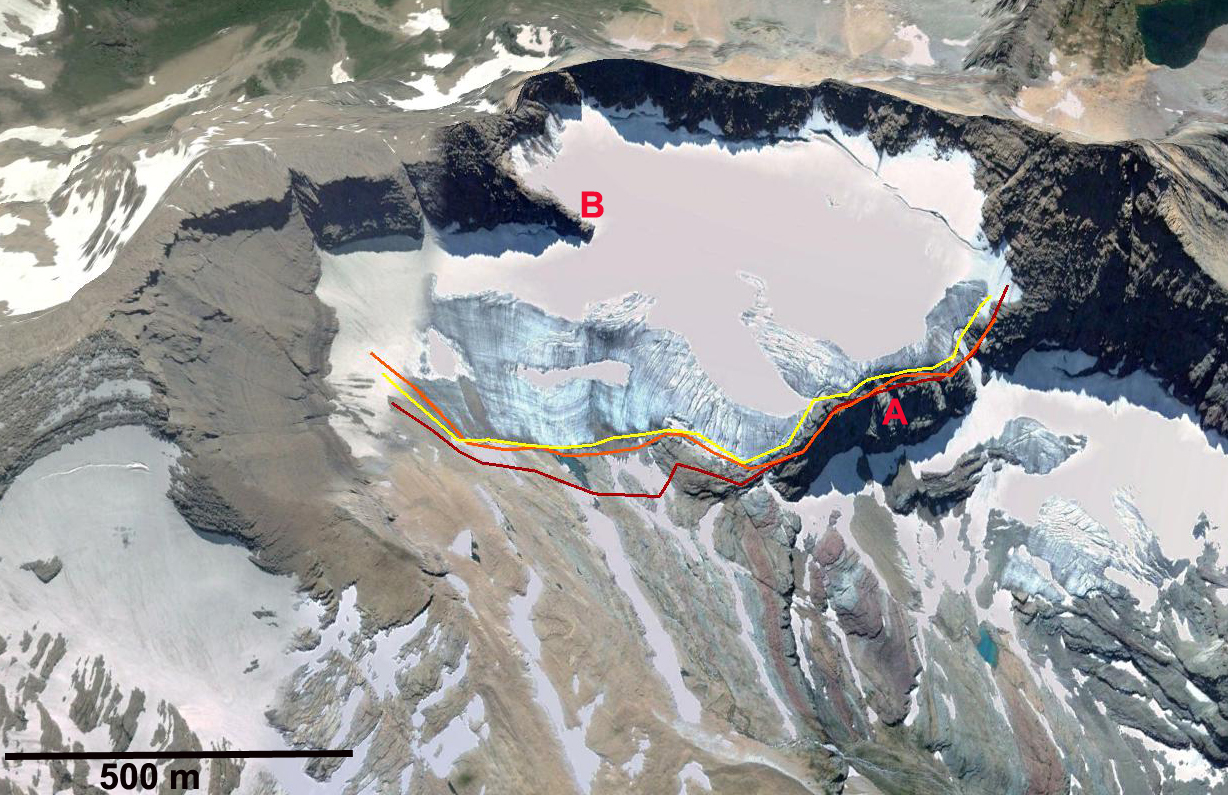
In the Google Earth images from 1990, 2003 and 2013 the margin of the glacier in 1990 is in red and from 2003 is in orange. The margin of the glacier from 1990 to 2003 indicates modest recession averaging 25-30 m along the glacier front.  This is part of the 9.3 % area loss noted by the USGS.  In 2013 there is too much snowcover to identify the glacier boundary, glacier ice is exposed providing a minimum extent at the green dots.  A comparison of 1990, 2005  and 2009 images, the latter from John Scurlock indicates the two primary terminus lobes.  From 1990 to 2005 the southern lobe retreated 45 m and the northern lobe 25-30 m. There is not a significant change in either lobe from 2005 to 2009. The 2003, 2005 and 2009 imagery does indicate a low percentage of retained snowcover.  This is the accumulation area ratio.  Persistent low values indicate a glacier that cannot survive.  In the case of Rainbow Glacier the accumulation area ratio is sufficient in most years to limit volume losses. In 2015 low snowpack exposed the terminus area,by late August the glacier still had 40% snowcover, indicating a negative mass balance, but not excessively negative.  Glacier area updated to 2015 using the Landsat image the area is now between 1.00 and 1.10 square kilometers an approximately 20% area loss in 50 years. It is evident that this is the only late summer area of snow-ice in the watershed and is particularly crucial to the water budget in late summer and early fall. The slow retreat of the glacier is good for the bull trout in the watershed, Rieman et al (2007) indicated the sensitivity of the trout to stream temperatures.  Glacier both increase flow and reduce stream temperature late in the summer. This is one glacier in the park that will not disappear by 2030 as has been often forecast.  It will join Harrison Glacier in this category, while other glaciers in GNP continue to disappear.

rainbow 1990 t

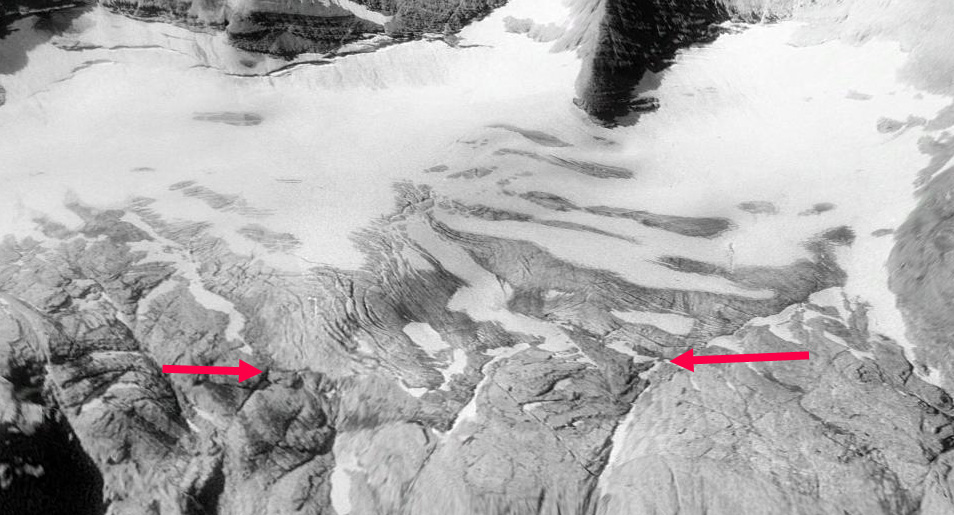
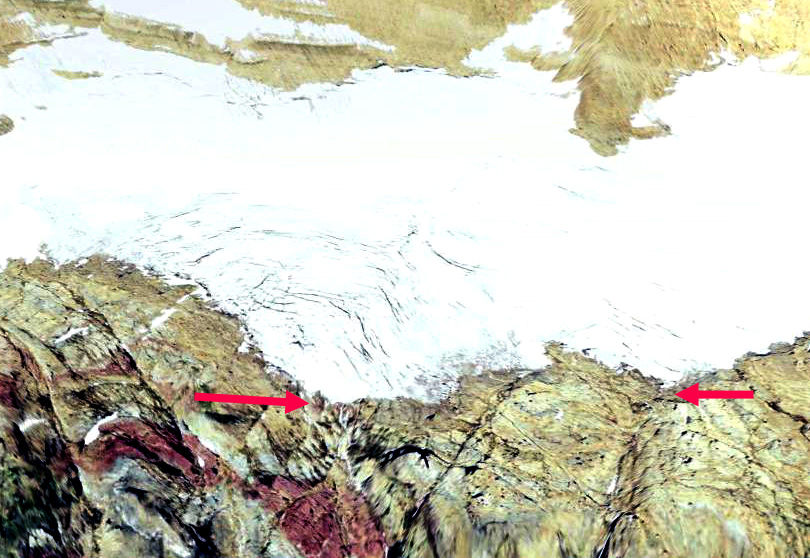
1990 Google Earth image with two main terminus lobes indicated by red arrows. 

rainbow 2005

2005 Google Earth image of Rainbow Glacier. 

rainbow glacier 2009 scurlock

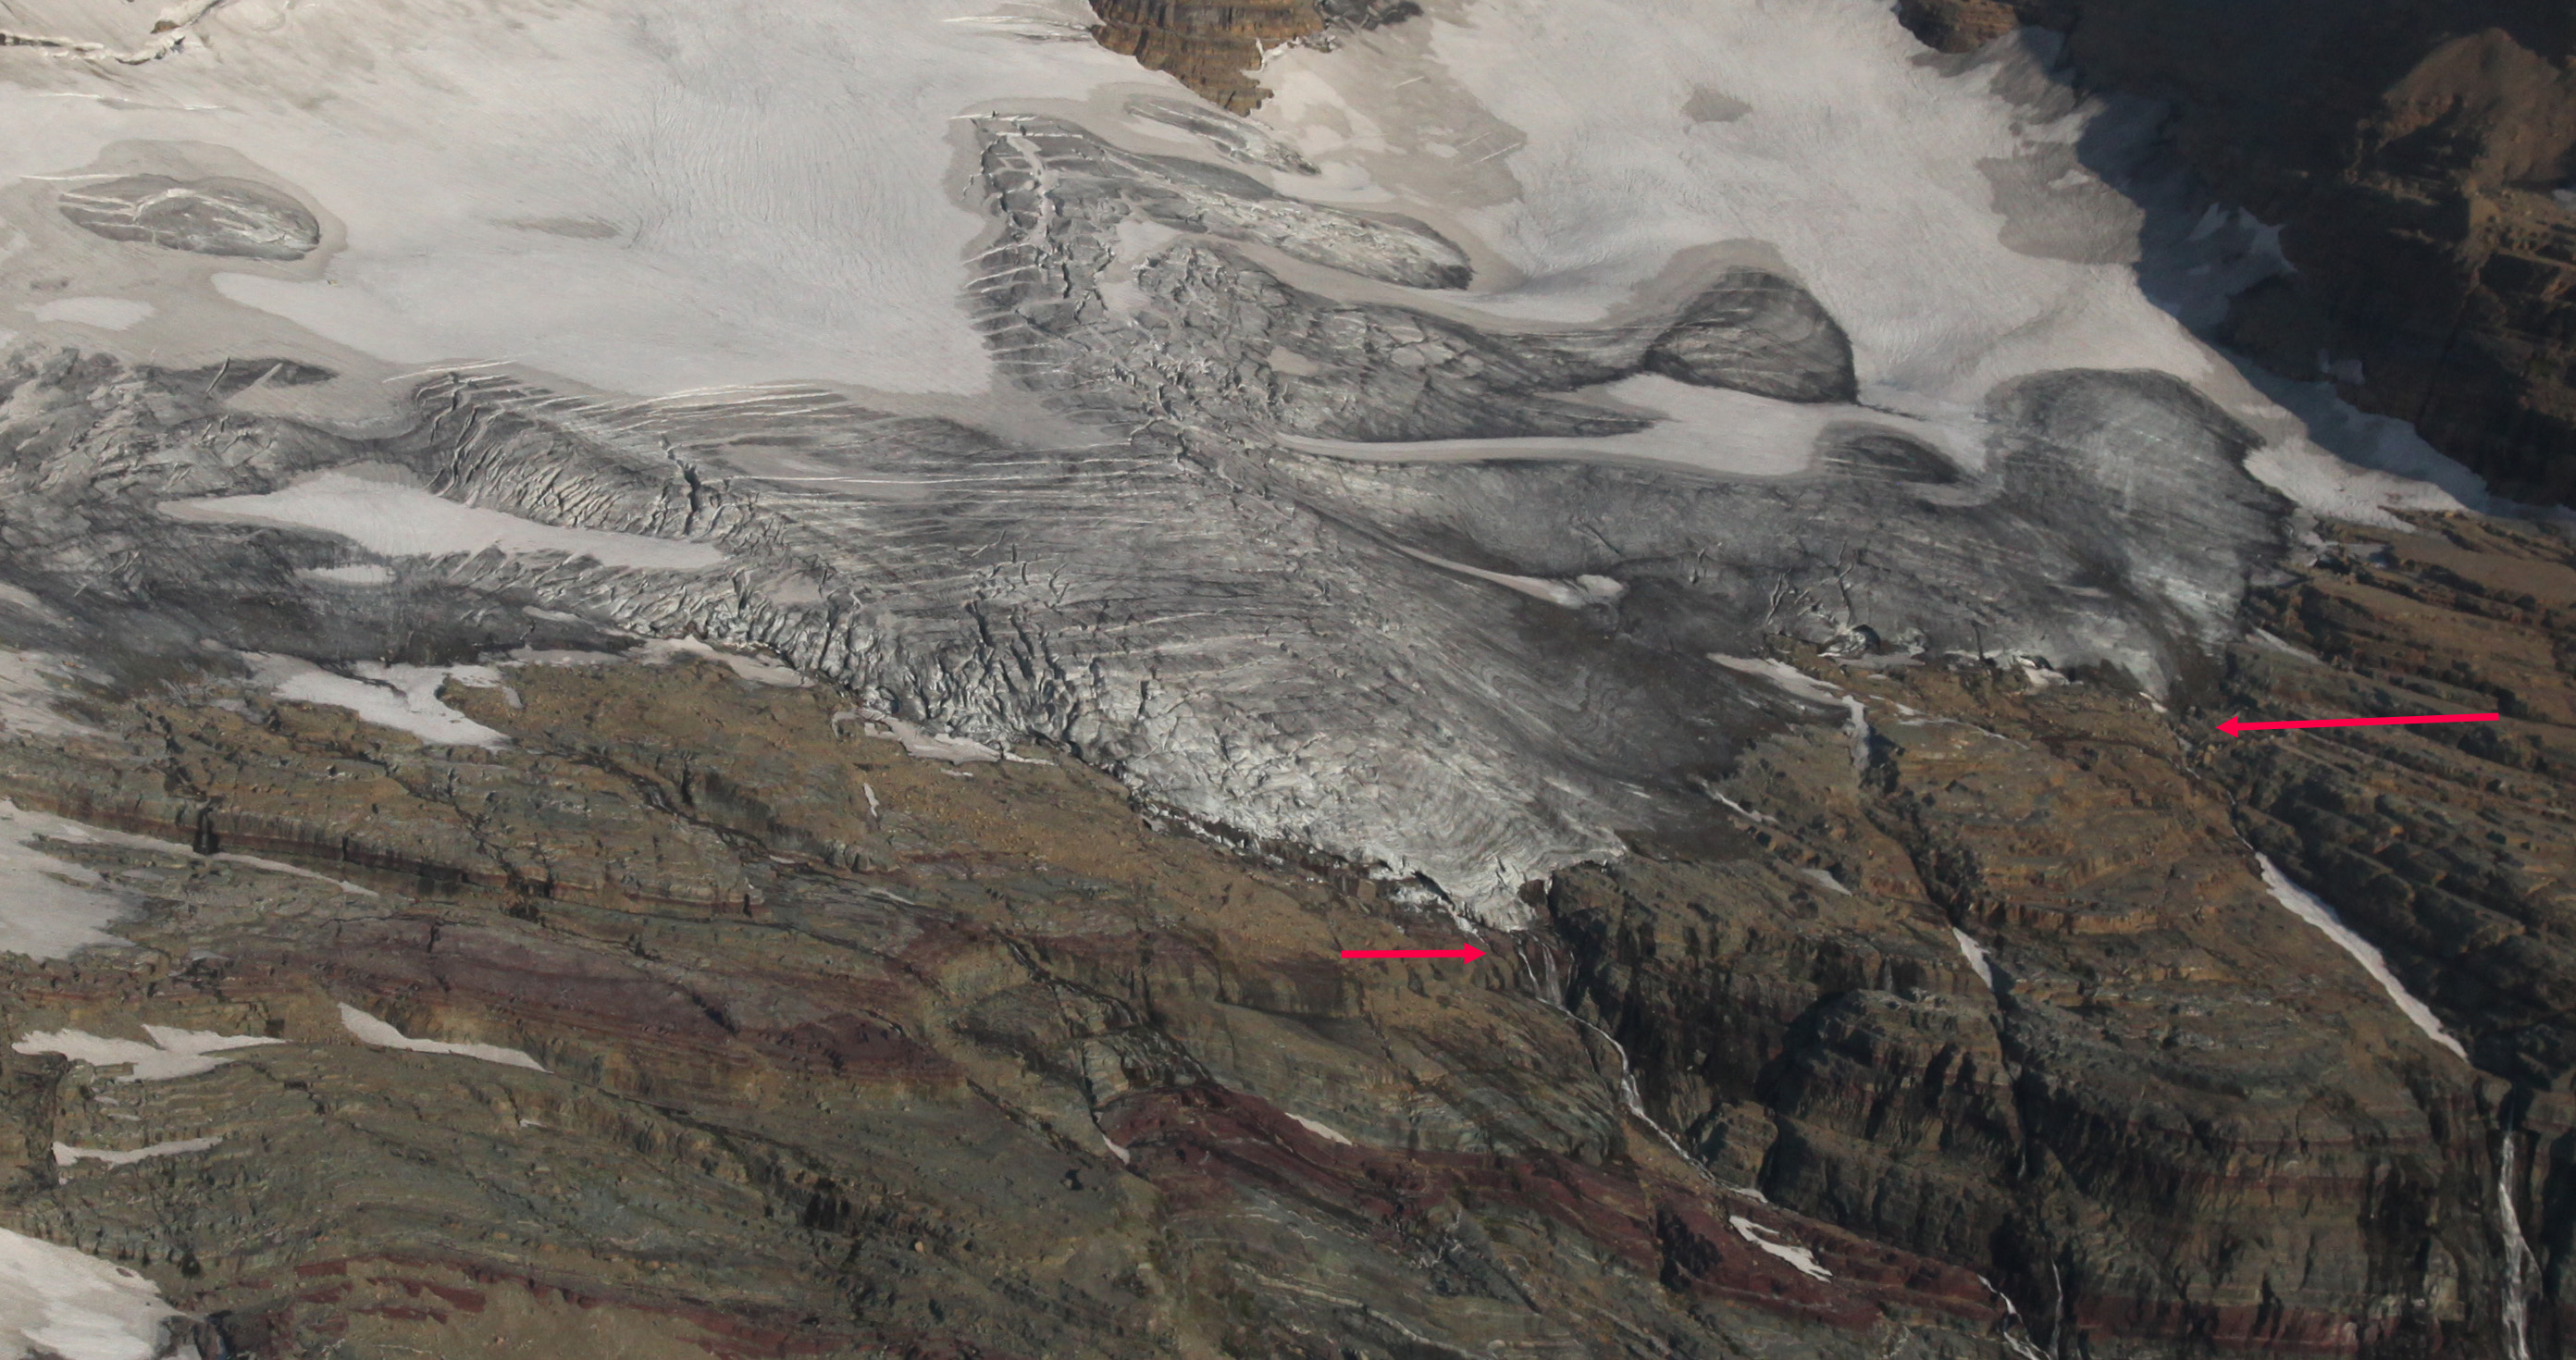
2009 John Scurlock image of Rainbow Glacier. 

Kintla Glacier Retreat, Glacier National Park, Montana

There continues to be a persistent misperciption that all glaciers in Glacier National Park, Montana will be gone by 2030, I get asked that by journalists frequently, and when I point out that is not the case, they are surprised. The number of glaciers has declined from 150 to less than 30 today, and most of those are doing poorly, however, there are a few that are retreating relatively slowly and not on the verge of disappearing. This week brings another examples from National Geographic. This post focusses on why this is not going to occur using Kintla Glacier as an example. Kintla Glacier is 8 km south of the border with Canada on the north slope of Kintla Peak and drains into Medicine Bow Creek and then Kintla Lake. All of the images from Google Earth and Landsat are oriented with south at the top. kintla areaKintla Glacier is noted by Key et al (2002) and by continuing USGS reseearch to have had an area of 1.7 km in 1966 and 1.15 km2 in 2005. This is the loss of nearly a third in 40 years. Here we examine changes from 1990 to 2013 using three Google Earth images and a Landsat image from 2013 to indicate the changes in the glacier during the last two decades. The margin of the glacier in the sequential Google Earth images from 1990 (red), 2003 (orange) and 2007 (yellow) indicate the limited retreat in this period. Retreat averages 30-40 m with a glacier length averaging 500 m. The width of the glacier changed even less. Hence, this glacier has lost 5-10% of its area from 1990 to 2007. n 1990 Jon Scurlock has some exceptional images of the glacier taken in 2009 and posted Glaciers of the American West. These images indicate a glacier that has less than ideal snowcover, but significant crevassing near the main terminus and insignificant retreat from 2007. In 2013 Landsat imagery from August indicates no major retreat. Thus, this glacier is thinning and retreating, but is not poised despite its small size to disappear by 2030. kintla 1990

kintla 2003

kintla 2007

Kintla 2013

A key indicator of a glacier that will not survive current climate for long, is retreat of the upper margin and appearance of bedrock outcrops on the upper glacier (Pelto, 2010), neither is apparent here. A indicates a cliff below the main terminus, and is a good measure of the lack of retreat from this point. Point B is the end of a buttress that has not changed significantly during the 1990-2007 period indicating a lack of change in the upper portion of the glacier. The last image is a picture of the glacier from 2007 indicating a glacier that is not about to disappear in the next twenty years. This glacier will survive beyond 2030 just as Harrison Glacier will. Other glaciers in this park that continues to lose glaciers are not going to survive as long, such as Grinnell Glacier or Sperry Glacier. All of the glaciers in the region are responding to recent climate change, but not at the same rate. Further warming will certainly eliminate all of them.

Kintla Glacier 2007a

Harrison Glacier, Glacier National Park Slow Recession

There continues to be a persistent misconception that all glaciers in Glacier National Park will be gone by 2030, I get asked that by journalists frequently and when I point out that is not the case they are surprised. An examination of 15 Glacier National Park glaciers using the recently published Alpine Glacier Survival Forecast method, indicates that 10 of the 15 glaciers are experiencing a disequilibrium response and will disappear, the other five have been shrinking little. A simpler and more visual look at the survival issue, illustrates why though they all are diminishing the glaciers will not all be gone by 2030. Blackfoot and Harrison Glacier are the two largest glaciers and show minimal changes in the accumulation zone. Both glaciers continue to retreat with the main termini retreating approximately 100-120 m since 1966. In this post we take a close look at the Harrison Glacier the most vigorous and slowest receding of the few remaining Glacier National Park glaciers. Key and Fagre (2003) utilized a model to construct the future of glaciers in the Blackfoot-Jackson watershed, and determined that all would be gone by 2030 with continued substantial warming, but not with limited additional warming. Based on the slow recession and equilibrium response of Blackfoot and Harrison Glacier to recent climate over the last 40 years these two glaciers are not going to disappear within the next 30 years. Harrison Glacier has according to the ongoing work of Northern Rocky Mountain Science Center (NOROCK) Has lost 9% of its areas between 1966 and 2005, a 40 year period. In the first image below the glacier is outlined in the 1966 map of Harrison glacier overlaid in Google Earth. The orange outline is left on the following three images all from Google Earth’s historic imagery files. The map indicates the area of crevasses above the main terminus. A look at the glacier over the last two decades indicates the glacier remains vigorous in terms of flow, as indicated by the many crevasses. In every image from 1991 second image to 2003 and 2005 last two images, even in these later summer images the glacier retains snowpack in its upper accumulation zone. This suggest a glacier that can survive current climate at a diminished size. The above images indicate the slow recent recession of the Harrison Glacier, which unlike the majority in the park is only slowly receding. This is in contrast to nearby Shepard Glacier and Grinnell Glacier which often are devoid of snow and are losing area at a rate of 10% per decade, four times that of Harrison Glacier. Why the difference? Most of the glaciers lay on the east or northeast slopes-lee side of the mountain ridges and have significant avalanching from the slopes above. Grinnell Glacier has a significant accumulation area at 7000 feet and Harrison Glacier at 9000 feet. Hence, the greater change in area as seen between the 1996 orange margin and 2006 recent margin for Grinnell Glacier