The theme changes from a glaciers to a glaciologists perspective with a focus on selected work at the AGU 2017. The research discussed here is from the Poster Paper sessions the most interactive part of the convention. The following are some interesting snapshots of the breadth and depth of ongoing research. The most compelling figure from each poster is used.
Richard Forster, U of Utah team presented work on the firn aquifer in Greenland. A feature we did not even know existed until 2011. They have conducted four field seasons, using ground penetrating radar and magnetic resonance soundings to map water table elevation, thickness and volume in several areas. They found the aquifer thickness has a typical thickness of 10-30 m. Further they found that firn aquifers have existed since at least 1993 and have expanded and shifted with time see above image.
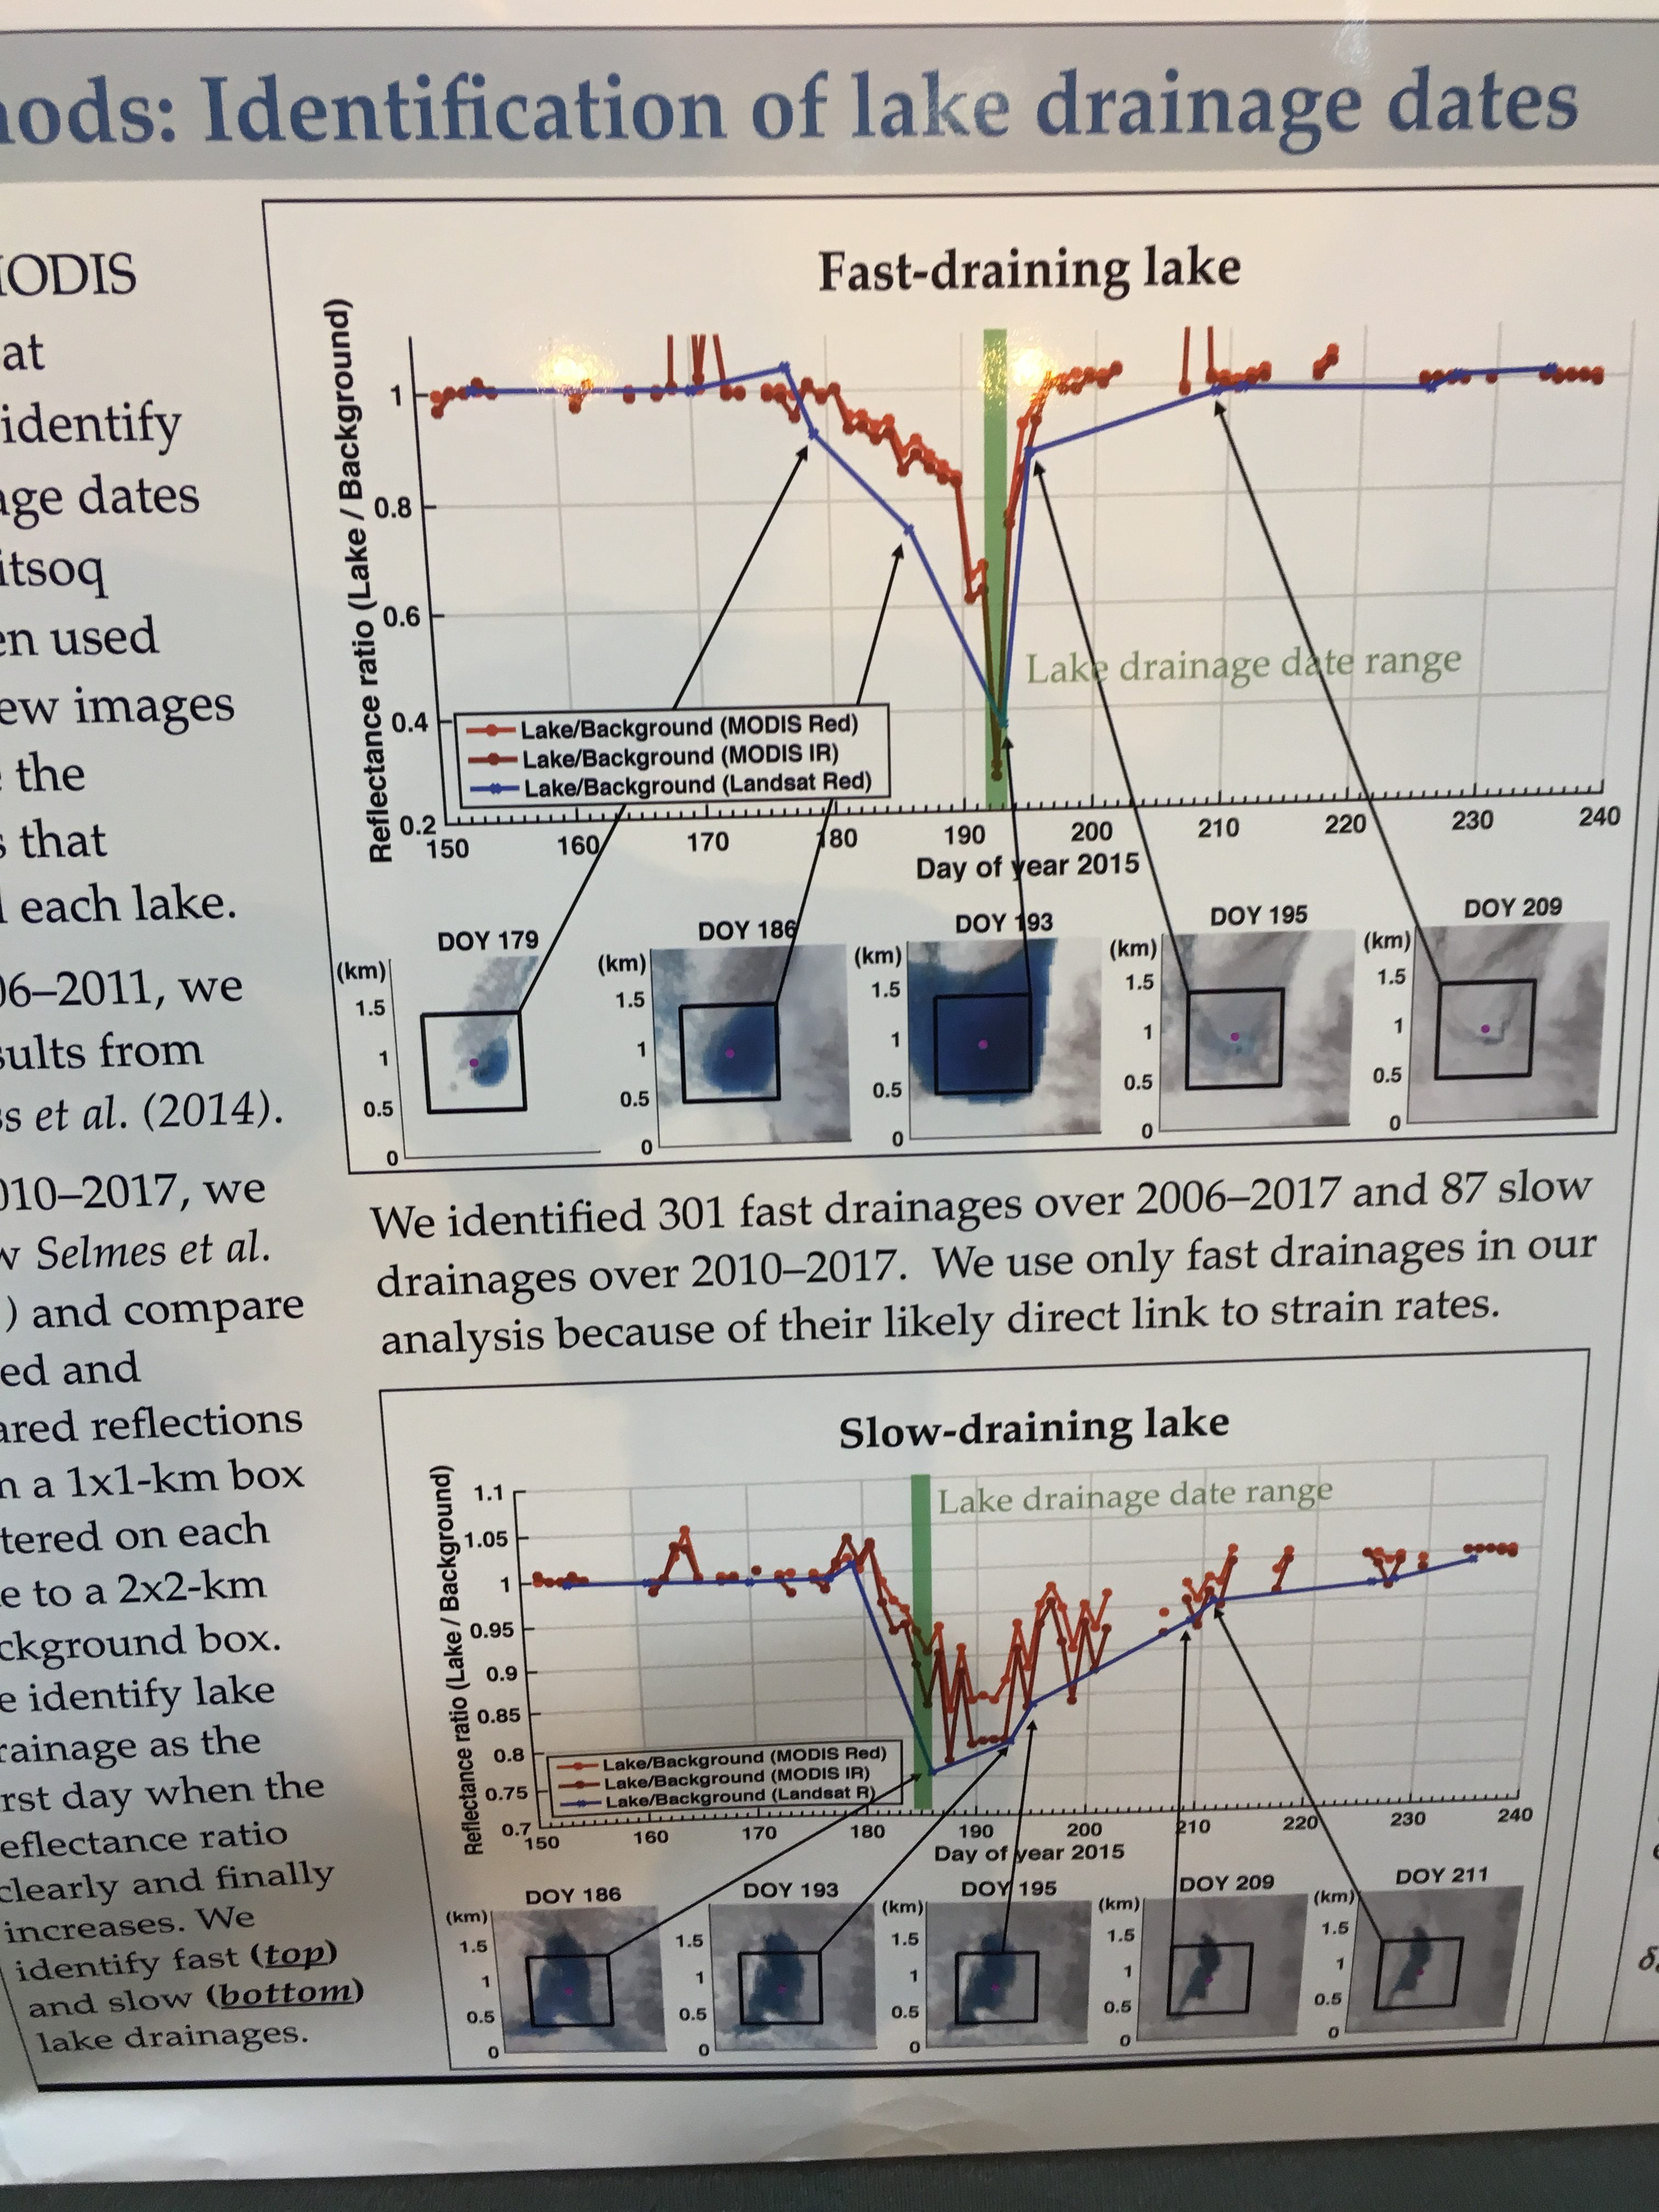
Kristin Poinar, NASA GSFC team examined the drainage of supraglacial lakes in Greenland. They investigated factors that control when and where the lakes drain to the ice sheet base. They observed 359 lake drainage events in a west Greenland region and compare the dates of these drainage events to strain rates calculated from satellite data. They noted both slow draining and fast draining lakes, the faster drainages occurring later in the summer on average. They found that strain rates did not satisfactorily predict lake drainage date.
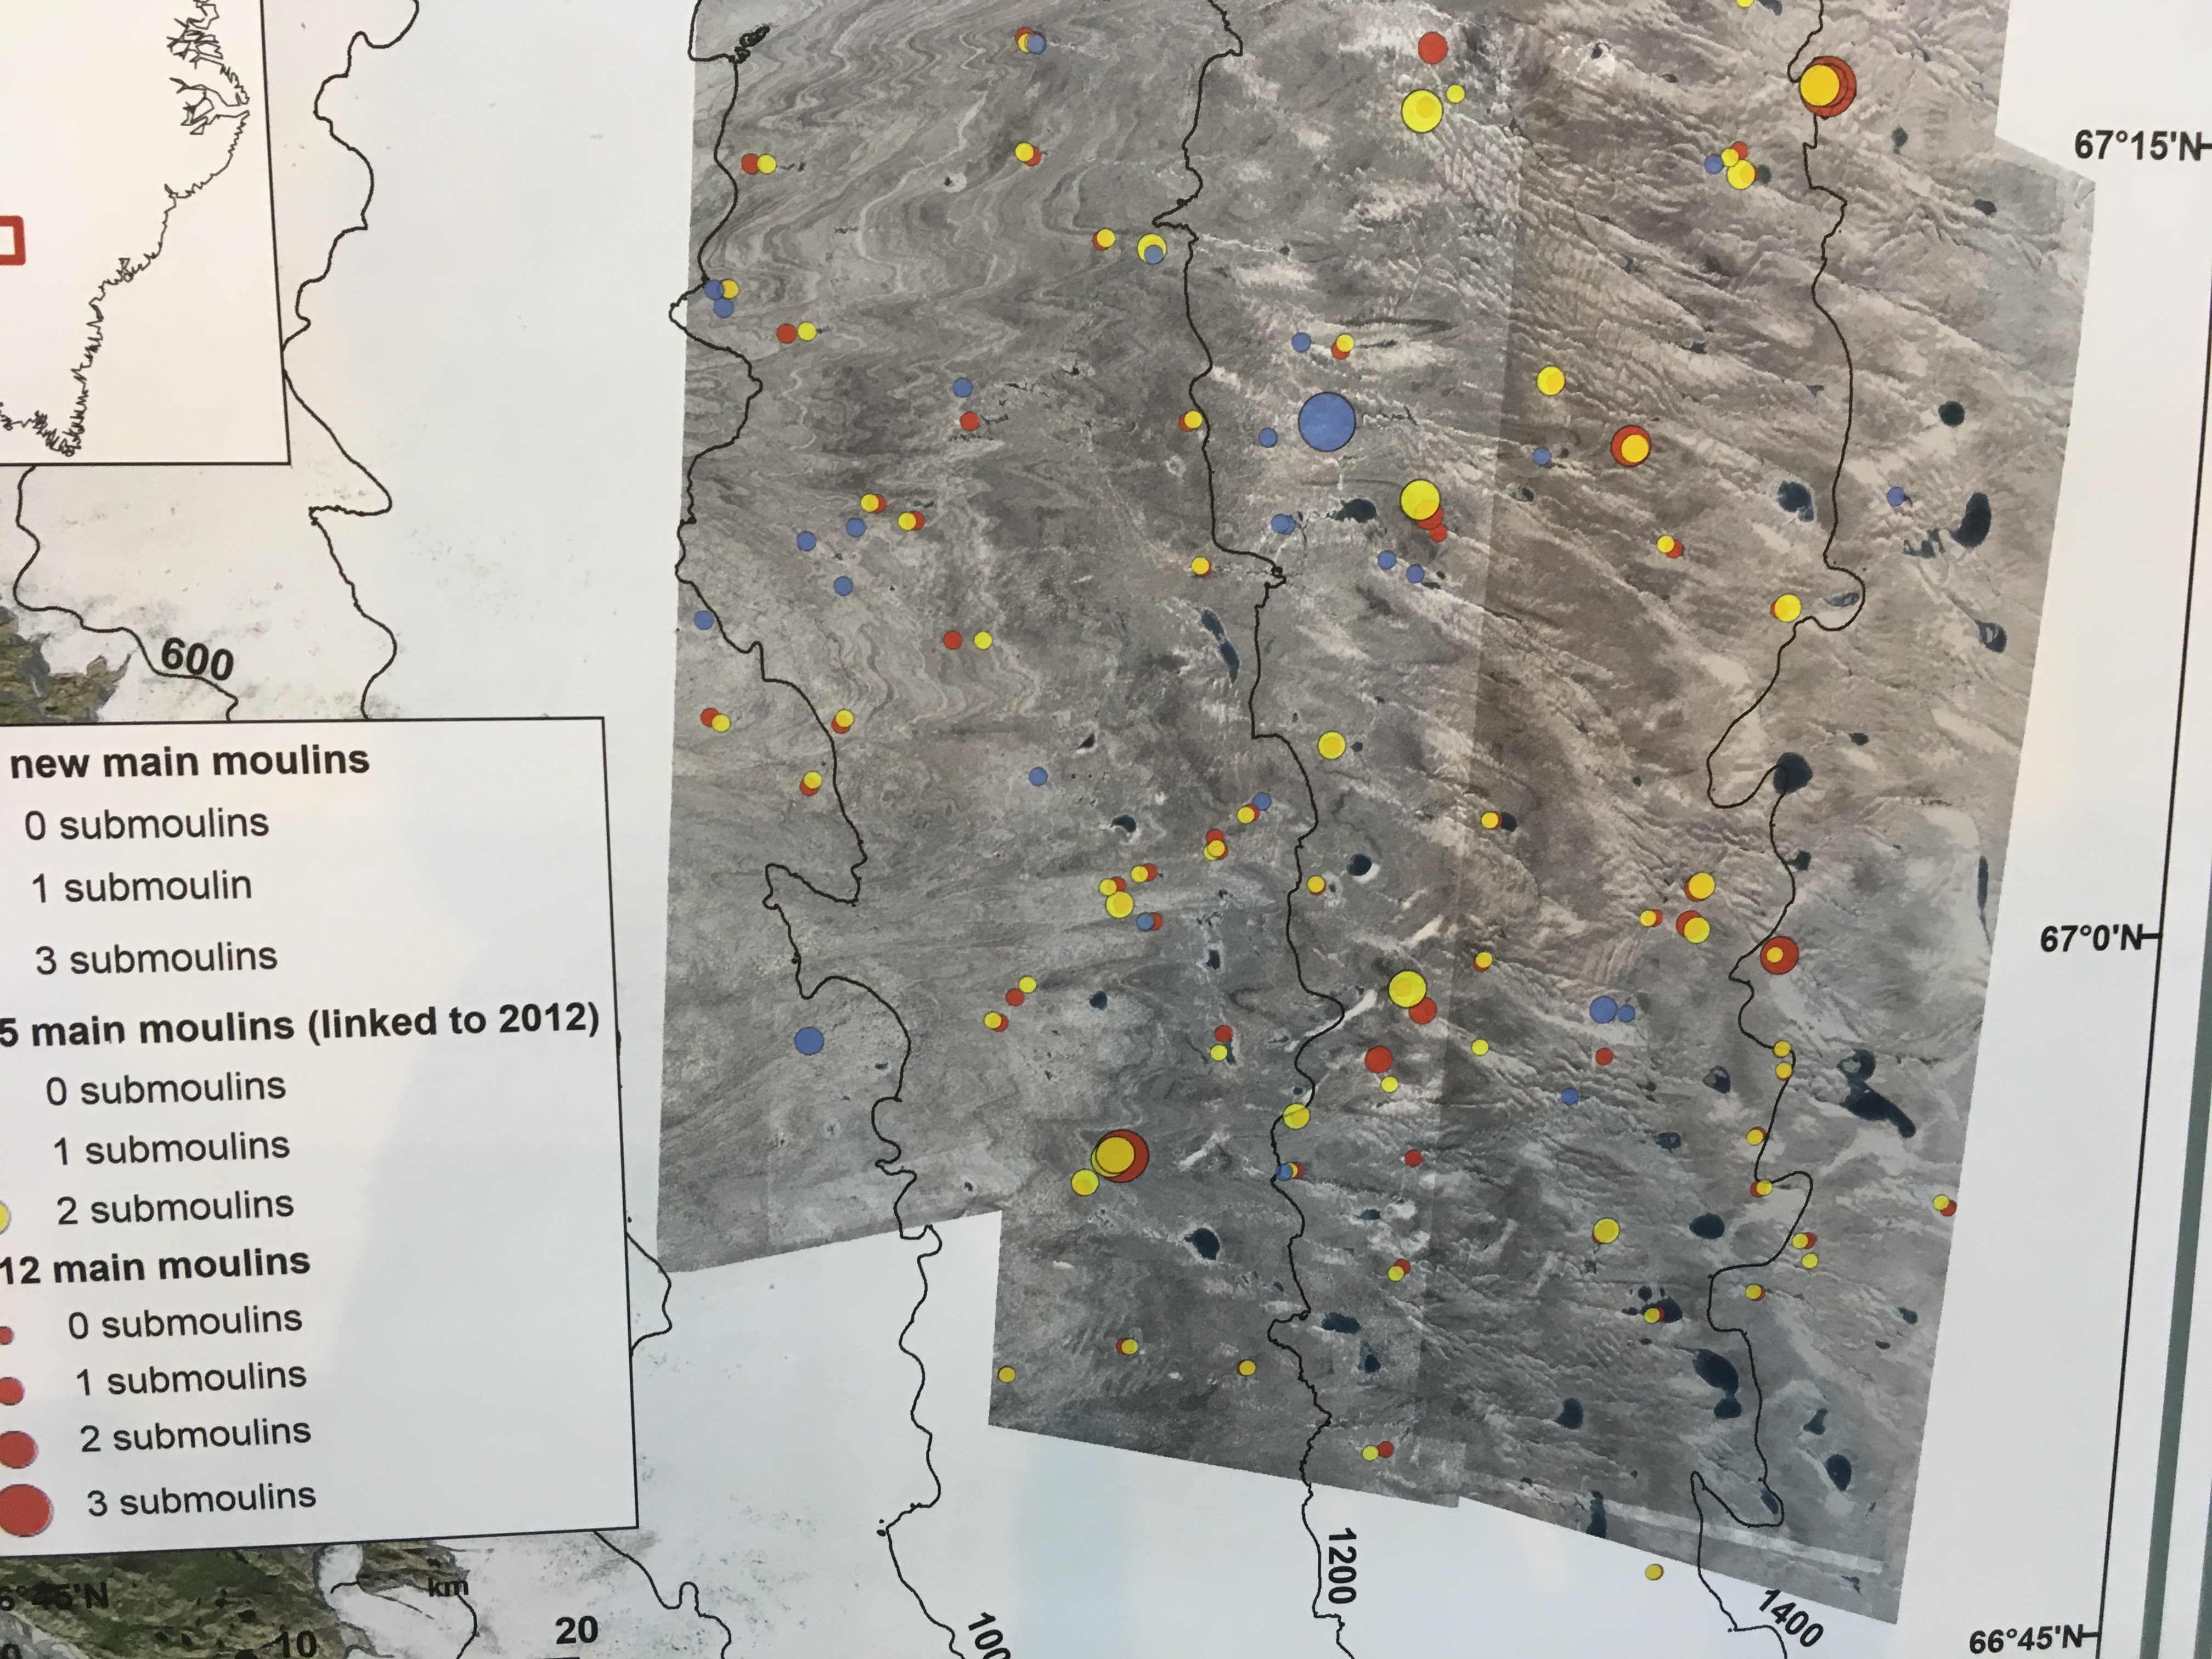
Vena Chu at UC-Santa Barbara’s team mapped river networks On Russell Glacier that terminate into moulins which connect surface melt to englacial and subglacial drainage networks. They used WorldView imagery to show development of molins and their migration between 2012 and 2015. The majority of moulins they mapped in 2015 were moulins in 2012. New moulins most commonly formed in crevassed, thinner ice areas near the ice margin, and a lesser but significant quantity at higher elevations above 1300 m.
Rohi Muthyala, Rutgers University team measured the discharge of supraglacial streams for three months, constructing rating curves. They compared air temperature and discharge in the upper and lower basin. The upper basin was more related to the daily air temperature. The stream system feeds into a moulin system.
Mariah Radue, University of Maine’s team mapped and dated the moraines and erratics adjacent to Potanin Glacier in the Mongolian Altai (49°N, 88°E). They used 10Be surface-exposure chronology to date glacial landforms mapped using satellite and Drone imagery. Based on our glacial reconstruction, we estimate changes in atmospheric temperature from the Last Glacial Maximum to the Late Holocene using snowline reconstruction techniques. Mongolia is a unique location because it is isolated from oceanic influences and a climate could provide insight into the roles of local radiation forcing from earth orbital changes, greenhouse gases, and a Asian climate dynamics.
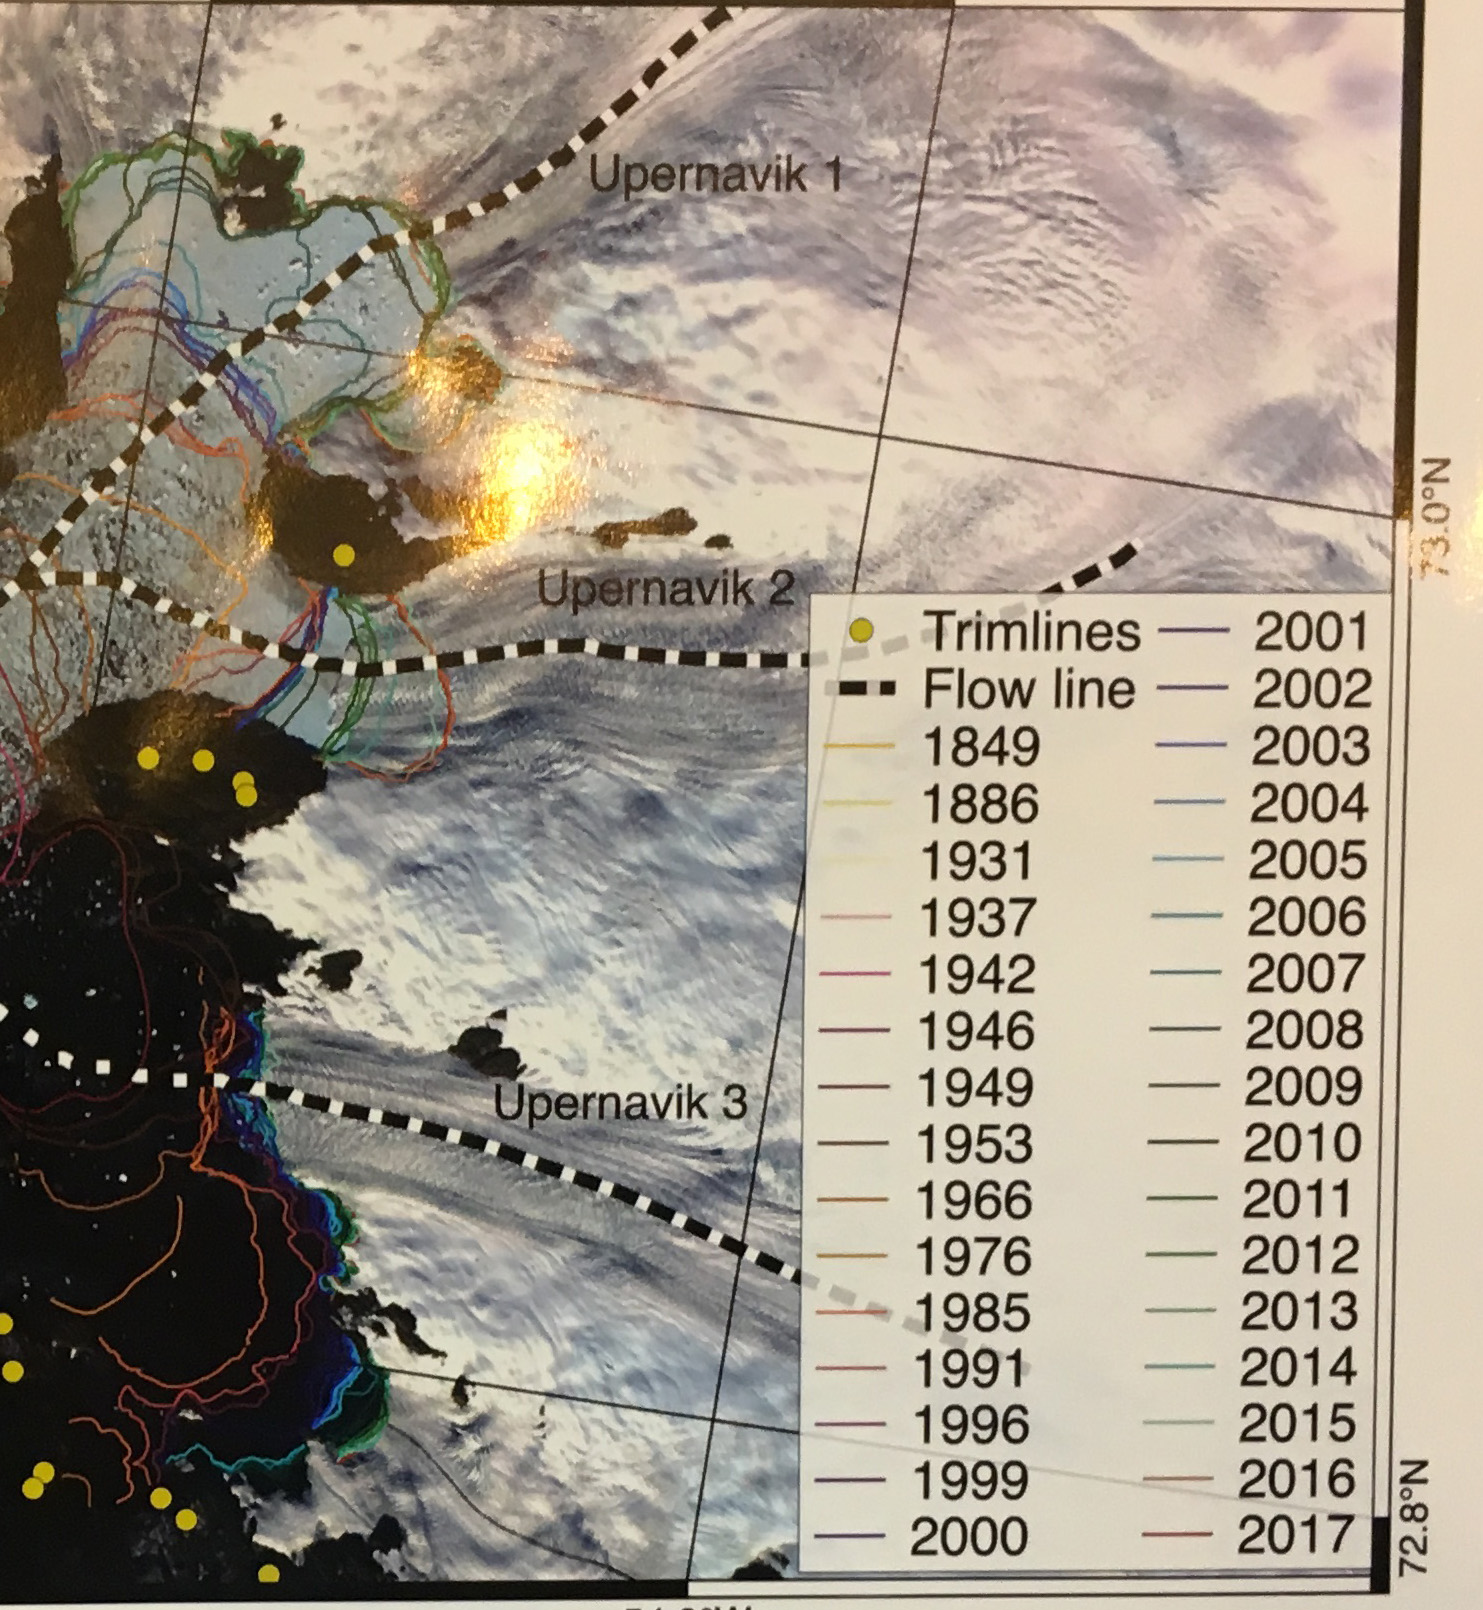
Konstanz Haubner, with a team from GEUS in Denmark provided a model simulating velocity and ice thickness change at Upernavik Glacier, Greenland from 1849-2017. In the image above the retreat is illustrated, separating into three separate glaciers with a more bedrock pinning points to stabilize. They noted a changing contribution to Upernavik’s ice mass loss from surface melt and ice dynamics in different time periods.
The 2013 winter season provided close to average snowpack in the North Cascades as indicated by the average SWE at SNOtel stations in the range. The summer melt season has proved to be long, warm and dry. The May-August mean temperature at the station closest to a glacier, Lyman Lake, has been tied for the 2nd warmest in the last 25 years with 2009 and only 2004 warmer. The summer has lacked record periods of warmth and has featured sustained warm temperatures and higher than average humidity, reducing the number of nights when the glacier surface has frozen. The average minimum temperatures at Lyman Lake are the highest in the last 25 years for July and August. The humidity was the strikingly high during our field season, note diagram from a Cliff Mass article on the topic. The net result will be significant negative glacier mass balances in the North Cascades. There is one month left in the melt season most glaciers are close to an equilibrium balance already.
Seattle Minimum Temperatures this summer. Notice August
April 1 SWE at Snotel Stations in North Cascades
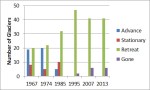
Graph of North Cascade glacier retreat of the 47 glaciers we assess 1967-2013.
The field team included Stewart Willis and Matt Holland, Western Washington University, Jill Pelto, U of Maine, Ben Pelto, UMass,-Amherst, Jezra Beaulieu and Oliver Grah, Nooksack Indian Tribe research scientists And Tom Hammond, North Cascade Conservation Council. Alan Kearney, Photographer worked with us for the first week capturing time lapse imagery of our work.
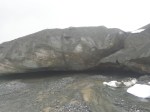
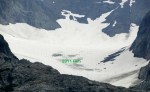
After a month of perfect summer weather we arrived to a foggy and wet conditions on the Columbia Glacier. The Columbia Glacier terminus was exposed and has retreated 85 m since 1990. The glacier had a substantial area of blue beginning 200 m above the terminus and extending along the western side of the basin for 400 m. The area of blue ice on August 1 was 50,000 square meters, by Aug. 21 the area had expanded to 200,000 square meters, the shift of the 2013 winter snowline during this period indicates a melt of m during the three weeks.
Columbia Glacier terminus west side
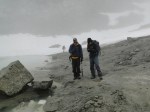
Stewart Willis and Ben Pelto surveying Columbia Glacier terminus
Jill Pelto at terminus Columbia Glacier
Columbia Glacier on Aug. 20
Columbia Glacier on Aug. 1
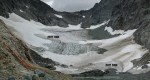
The Lower Curtis Glacier terminus was exposed early in the summer resulting in a continued retreat of 20 m since 2011, the area of thick seraced terminus lost since 1990 has been 60,000 square meters. The lateral retreat and terminus retreat since 1990 are both in the 125-150 meter range depending on location.
Lower Curtis glacier lateral retreat
Matt Holland and Jill Pelto at Lower Curtis Glacier terminus
Lower Curtis glacier terminus retreat
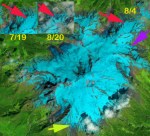
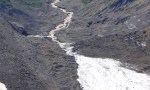
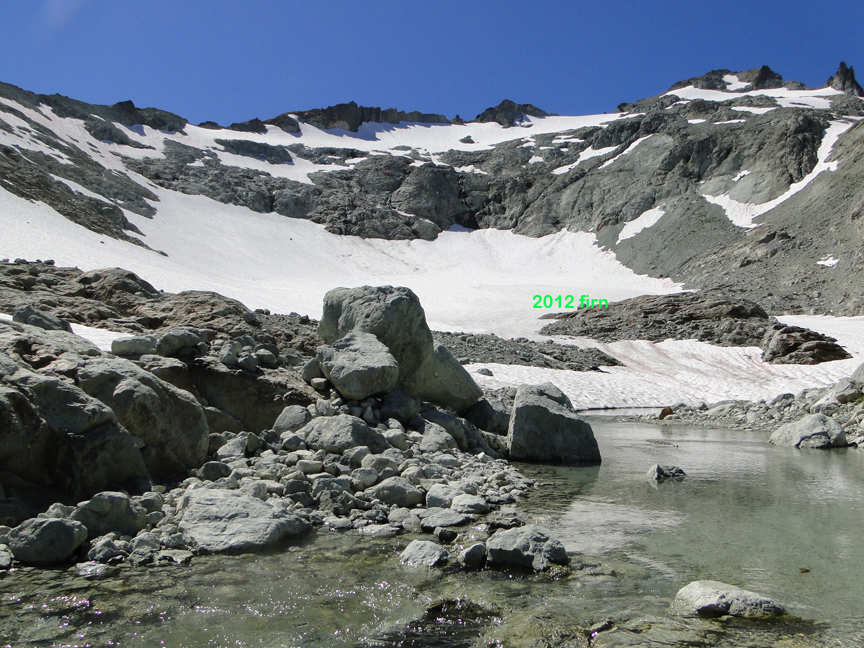
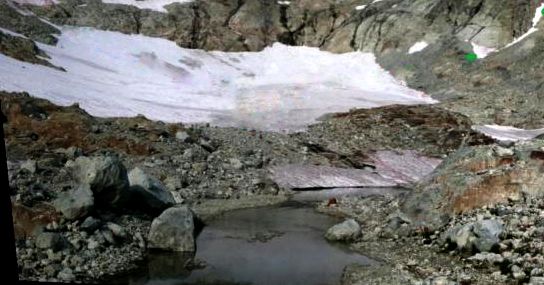
We spent a week observing ablation and resulting glacier runoff on Sholes Glacier. With Oliver Grah and Jezra Beaulieu who work for the water resources section of the Nooksack Indian Tribe we emplaced a stream gage right below Sholes Glacier and one on Bagley Creek which is snowmelt dominated. With the water level gages in we all began work on a rating curve for the Sholes Glacier site directly measuring discharge on 14 occasions, kayak socks helped reduce the impact of cold water. Average ablation during the week was 8.25 cm/day of snowpack or 5 cm of water, discharge measurements identified a mean of 5.2 cm/day of from the glacier during this period. The agreement between ablation and discharge was a nice result. Discharge became notably more turbid after 1 pm, peaking in turbidity around 5 pm. Of equal interest was the change in snowcovered area. On July 19th a Landsat image indicated 100% snowcover for Sholes Glacier. On Aug. 4th our surface measurements indicates a blue ice area of 12,500 square meters, which is also evident in a Landsat image from that day. By Aug. 20th a satellite image indicates that the blue ice area had expanded to an area of square meters. This coincided with the area where snowdepth was observed to be less than 1.2 m on Aug.4. This represents a volume loss of 592,000 cubic meters of water in 16 days.
landsat comparison of snowpack on Sholes Glacier. Fullly snowcovered on 7/19, 98% snowcovered on 8/4 and 60% snowcovered on 8/20.
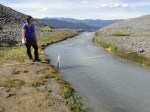
Sholes Glacier outlet
Sholes glacier outlet stream gage, Jezra Beaulieu
Sholes Glacier Aug. 3
Sholes Glacier Aug. 5
Sholes Glacier 9-1-2013 from aywolfpac-NWhikers
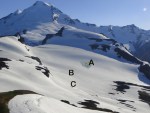
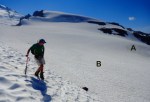
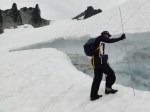
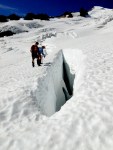
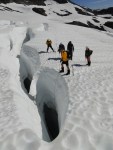
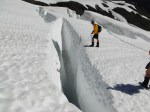
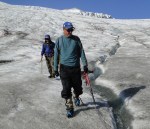
We measured the mass balance on Rainbow and Sholes Glacier during this period. The snowpack was poor on both, especially above 1900 meters on Rainbow Glacier. Typical depths are over 5-6 m, this year 3.75-4.5 m. The poor snow depths were also noted on the Easton Glacier above 2000 m in crevasse stratigraphy measurements. Each crevasse is approached probing to ensure it is safe and then assessed to make sure the crevasse is vertically walled, this enables a safe but also accurate measure. In some cases layers from mulitple years can be assessed. IN the Lynch Glacier crevasse the 2013 layer will be lost to melt before end of the summer.
Probing before approaching crevasse on Lynch Glacier
Rainbow Glacier annual layer
Rainbow Glacier annual layer
Rainbow Glacier annual layer
Annual stratigraphy at 2100 m on Easton Glacier
Easton Glacier stratigraphy at 200o m
Easton Glacier annual layer
Lynch Glacier annual layers
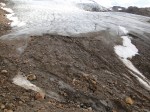
Easton Glacier had a terminus that was fully exposed by the start of August. The terminus slope has thinned markedly in the last three years as retreat has continued. The retreat of Easton Glacier has averaged 10 m/year from 2009-2013. This year the retreat will exceed that with two months of exposure. The Deming Glacier retreat has been exceptional over the last 12 months with at least 30 m of retreat.
Easton Glacier terminus retreat since 1990
Low slope of Easton terminus
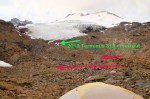
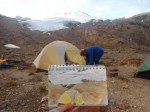
Easton Glacier camp sketch-Jill Pelto
Low slope of lower Easton Glacier
Deming Glacier terminus-David Tucker Mount Baker Volcano Research Center
Deming Glacier terminus from above, note debris cover extends across nearly whole terminus now.
The snowline on Easton Glacier was at 1850 m on Aug. 10th. By the end of August the snowline had risen to 1980 m, where snow depths had been 1.5 m three weeks previous. The mass balance of Sholes, Rainbow and Easton Glacier will all be close to – 1 meters water equivalent, that is losing a slice of glacier 1.1-1.2 m thick. Mount Daniels had the best snowpack of any location in the North Cascades. On the small and dying Ice Worm Glacier ablation and runoff were assessed simultaneously. The expansion of the area where 2013 has all melted expanded rapidly from 8/13 to 8/21. The glaciers lower section had is often avalanche buried, this year the snowpack was gone on much of the lower section. However, snowpack averaged 1.7 m across the entire glacier on August 14th. With daily ablation of 7-8 cm/day this will be gone by early September. This will lead to a substantial negative mass balance this year. Lynch and Daniels Glacier both had limited exposed blue ice and firn, and snowpack values that were slightly above average. Both glaciers will have small negative mass balances this year. On Lynch Glacier a large crevasse at exposed the retained snowpack of the last three years, from 2010-2012 5 m of firn remains.
Ben in his 9th year, Jill her 5th year and Mauri 30th year of glacier work in the North Cascades