A Voice for Glaciers at COP21

During the last six years From a Glaciers Perspective has published 520 Posts examining the response of glaciers to climate change.  No hyperbole has been needed to use words such as disappear, fragmented, disintegrated, and collapse.  Glacier by glacier from the fragmentation of glaciers to the formation of new lakes and new islands has emphasized the changing map of our world as glaciers retreat.   The story details change, but the story remains the same; glaciers are poorly suited for our warming climate, and their only response is to hastily retreat to a point of equilibrium, which many will not attain, and some have already ultimately failed. The Gallery below is a mere snippet of the changes that are occurring. These are illustrations of why our paper this year led by the World Glacier Monitoring Service team was titled Historically unprecedented global glacier decline in the early 21st century. As the UN Climate Change Conference 2015 in Paris, COP21 begins, since no glaciers are invited, there story must be told in pictures, data and our words.

Data: World Glacier Monitoring Service Mass Balance Time Series for Alpine Glaciers.


_summary-2012-2013-2014.xlsx

Pictures


Words:

After 34 consecutive summers working on glaciers, there is occasion to speak as more than just a scientist, since glaciers do not have a voice people hear.

Embarking on the 32nd Annual North Cascade Glacier Climate Project


sholes compare
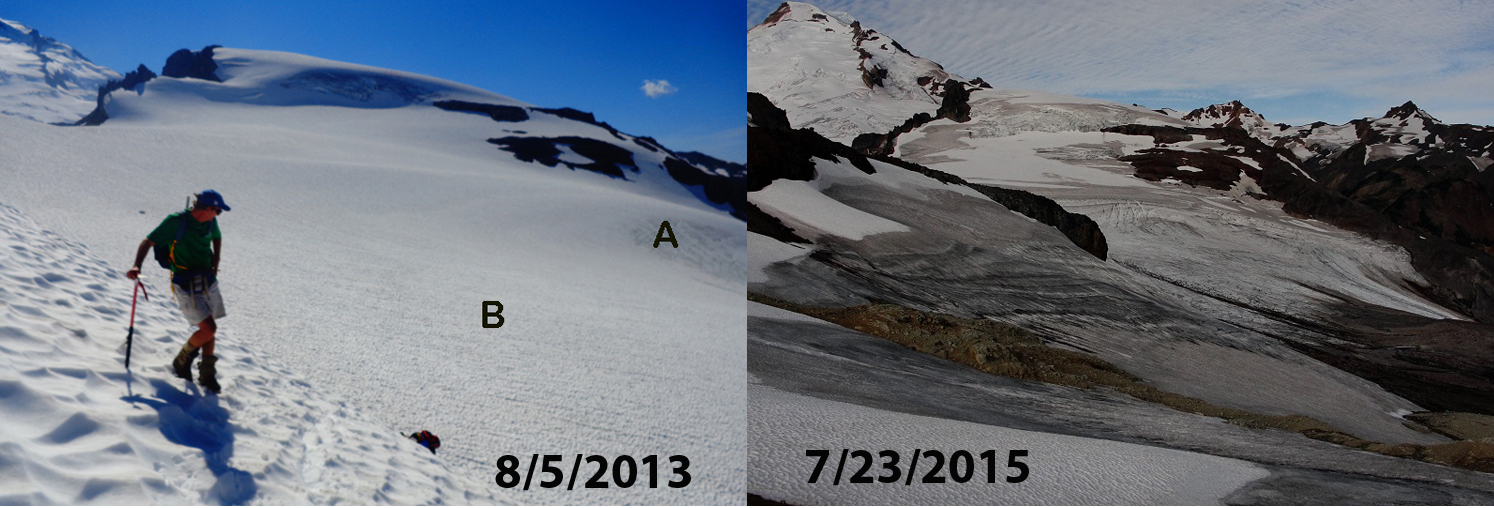
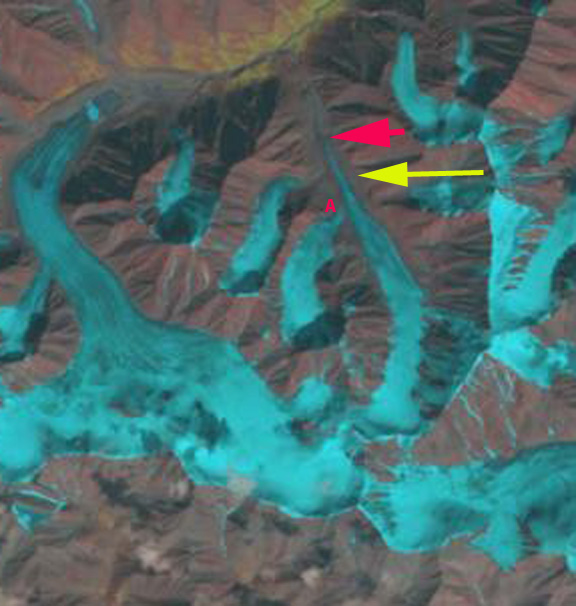
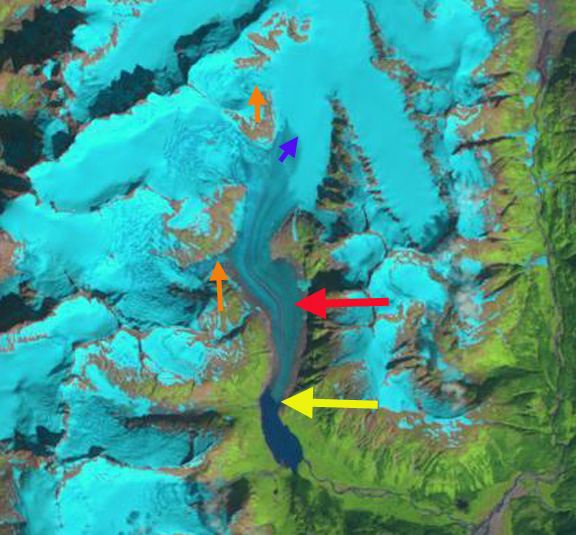
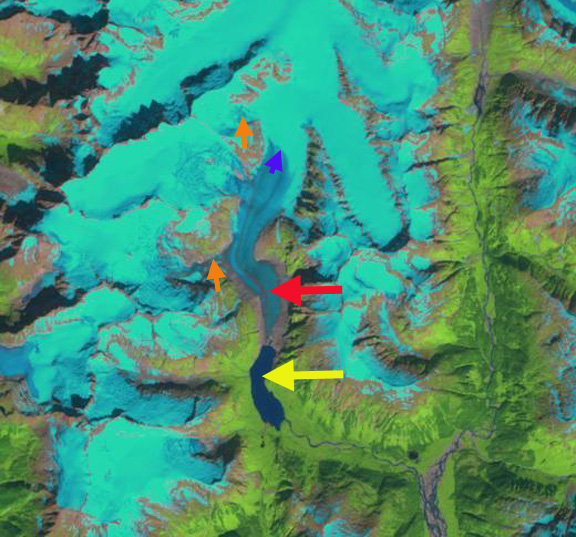
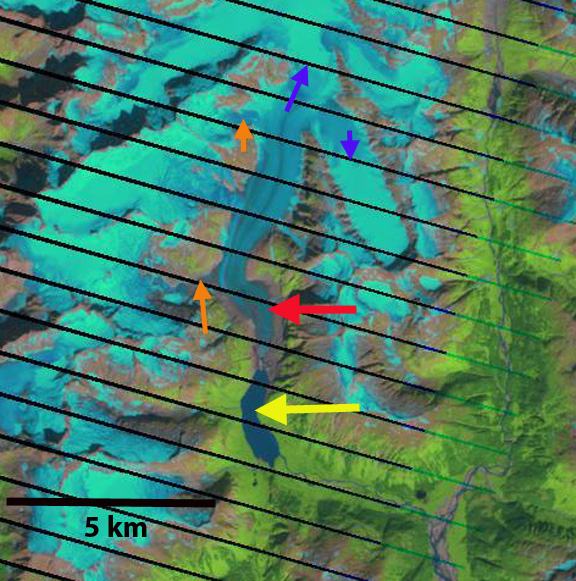
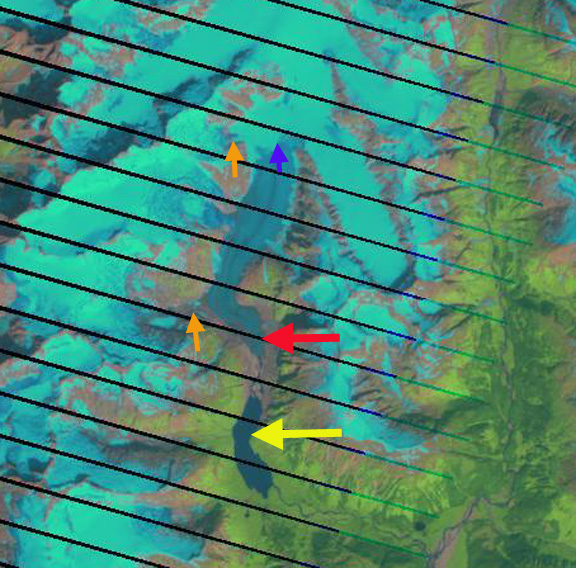
Sholes Glacier snowcover Aug. 5, 2013 (Jill Pelto) and Sholes Glacier July 23, 2015 (Oliver Grah)

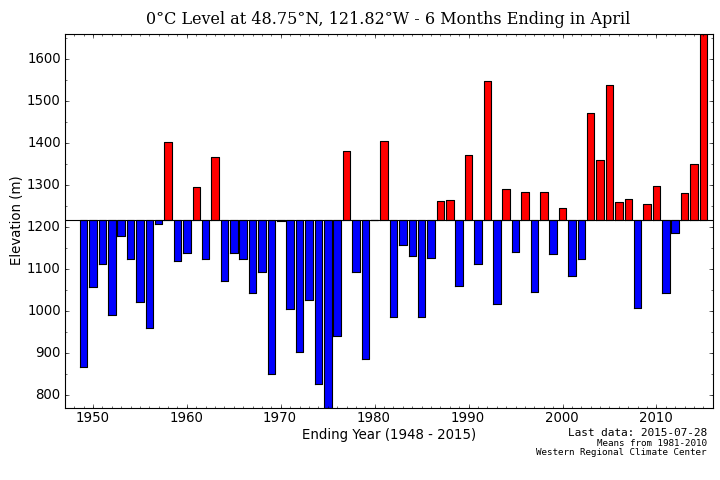
For the 32nd straight summer we will be investigating North Cascade glaciers and their response to climate change over the next three weeks (that means no new posts until Aug. 20).  In 1984 the program was initiated to study the impacts of climate change across an entire mountain range, instead of on just one glacier.  This had been a high priority of the National Academy of Science, I felt I could address.  The glaciers in the North Cascades provide water resources for irrigation, hydropower, salmon and municipal supply.  During our 32 years we have seen the loss of 25% of the entire glacier volume of the range.  Unfortunately 2015 is almost certainly going to be the worst year during this period.  We will likely lose over 5% of the volume of these glaciers in one year.  The problem has been high freezing elevations in the winter, note the difference from other years below.  Because of the drought conditions glaciers are even more crucial to runoff, note the daily spike in flow due to glacier melt in the Nooksack River in July, black arrows.  Blue arrow indicates rain storm.

winter 2015nooksack

Freezing levels on Mount Baker during winter 2015 versus previous winters.  Nooksack River discharge from the USGS in July.

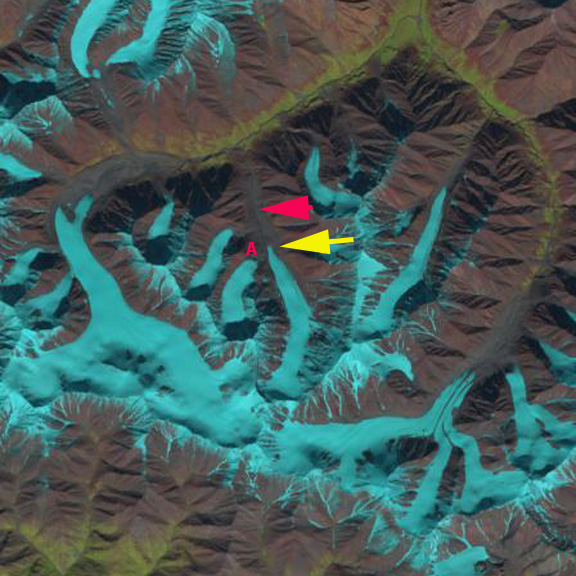
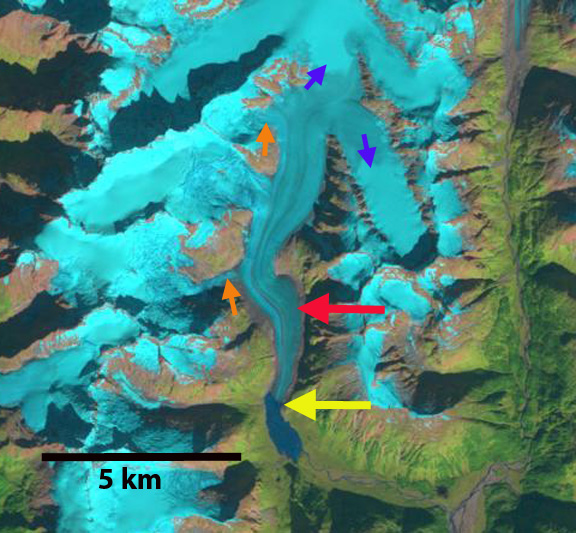
This has been followed by the warmest June and now July the region has seen. This has led to record low streamflow from either rain, groundwater or snowpack from non-glacier areas.  The result is that in glacier fed basins glacier runoff which is above normal because of the warm temperatures is even more important.  We are measuring flow below glaciers and melting on glaciers to quantify the percent of total flow contributed by glaciers.  In 2014 in the North Fork Nooksack River glaciers contributed more than 40% of total stream discharge in the river on 21 days, all in August and September. We again with the Nooksack Indian Tribe will be examining the issue, particularly at Sholes Glacier. We will also be measuring the mass balance, terminus change and mapping ten glaciers we visit every year, including Columbia Glacier seen below.

columiba compare

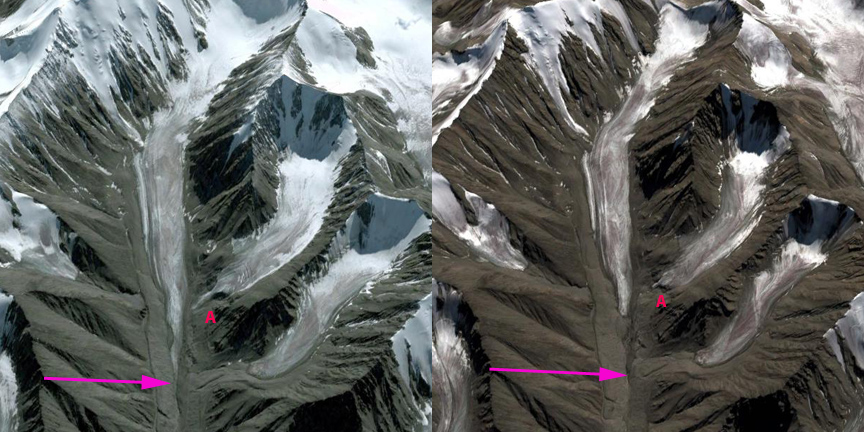
Terminus of Columbia Glacier and accumulation zone looking bare in 2005, the lowest snowpack year of the last 32 until this year

The glaciers are all in Wilderness areas which means no motorized vehicles or equipment, we have to hike everything in.  This has provided the opportunity to spend over 600 nights in a tent examining the glaciers, hiking/skiing over 3000 miles across the glaciers, and eating oatmeal each morning for breakfast.  It has also provided the opportunity to train and work with more than 60 different scientists.  This year the field team consists of Erica Nied from the University of Colorado, Tyler Sullivan from the University of Maine, Jill Pelto from the University of Maine for the seventh year and myself for the 32nd year.  We will be joined at times by Justin Wright, Oregon State, Tom Hammond, University of Washington, Ben Pelto University of Northern British Columbia, Oliver Grah and Jezra Beaulieu of the Nooksack Indian Tribe. Below are three videos from last year that illustrate: 1: Visual report on initial 2015 findings 2: How and why we measure mass balance.3. The Nooksack Indian Tribe perspective on threats of glacier runoff and our measurements of it.


Slender Glacier, Brooks Range, Alaska: Rapid Retreat 1992-2014

Slender Glacier is not an official name, but a well suited name to this glacier in the Romanzof Mountains of the Brooks Range of Northern Alaska.  It is adjacent to the Okpilak Glacier and drains into the Okpilak River, which is host to arctic grayling. Here we examine Landsat imagery from 1992-2014 to identify changes. U-Alaska-Fairbanks has an ongoing program in the nearby Jarvis Creek Watershed examining in part how will the anticipated future increase in glacier wastage and permafrost degradation affect lowland hydrology.  Matt Nolan (U-AK-Fairbanks) reports on changes of nearby McCall and Okpilak Glacier. These glacier have suffered increased mass loss since 1990 as a result of an increase in the equilibrium line altitude that has reduced accumulation area and is indicative of increased ablation (Delcourt al , 2008)

mt_michelson-1956
USGS 1951 map

In 1992 the glacier extended downvalley to the red arrow at 1530 m. The glacier also received contribution from a tributary glacier at Point A. By 2002 the glacier had receded a short distance from the red arrow and still received input from the tributary glacier at Point A. By 2013 the glacier had receded to the yellow arrow 1100 meters from the 1992 terminus position, and now terminates at an altitude of 1675 m. The tributary glacier is no longer connected to Slender Glacier at Point A. The percent of snowcover is better than on Okpilak Glacier immediately to the west, or East Okpilak Glacier to the southeast. The first tributary entering the glacier on the east side is also disconnecting from Slender Glacier.   In 2014 the Landsat image is after a light snowfall that has endured only on the glacier ice, helping outline the glaciers. The continued decline in retained snowfall and contributed snowfall from tribuatry glaciers will lead to an even more slender glacier.

slender glacier 1992
1992 Landsat Image

slender glacier 2002
2002 Landsat Image

slender glacier 2013
2013 Landsat Image

slender glacier 2014
2014 Landsat Image

Google Earth images from 2006 and 2012 indicate a rapid retreat of the thin main terminus, and the loss of contact with the tributary glacier at Point A. The retreat is similar to that of Fork Glacier and Romanzof Glacier in the same region. The retained snowcover in 2012 is minimal on Slender Glacier and its tributaries. Tributary A lost almost all snowcover in 2012 and 2013 suggesting a lack of a consistent accumulation zone, which a glacier cannot survive without (Pelto, 2010)

slender comparison
2006 Google Earth Image and 2012 Google Earth image

Sinclair Glacier Retreat, Alaska

Sinclair Mountain is on the east side of the Lynn Canal in southeast Alaska. The mountains hosts too substantial glacier, the south flowing unnamed glacier is referred to here as Sinclair Glacier. This glacier terminated in a lake in the 1982 map of the Skagway region. I observed this glacier from the air in 1982 and it was ending in this lake. Here we examine Landsat imagery from 1984 to 2014 to identify changes. sinclair map
USGS Skagway map
Sinclair ge
Google Earth Image

In 1984 the glacier ended at a prominent peninsula in the lake, red arrow in each image, the lake was 1700 m long. The snowline was at 950 m, indicated by the purple arrow, this was at the end of the melt season. The glacier was joined by two tributaries from the west side, orange arrows. In 1986 there is a small amount of terminus retreat visible. By 2001 the glacier has retreated out of the lake, which is 2.9 km long. By 2004 the southern tributary at the orange arrow is no longer connected to the glacier. The glacier has retreated 1.3 km from 1984-2004. The snowline is at 950 m with a month left in the melt season. In 2009 the image is not great quality, but the northern tributary is still connected to the main glacier by a thin tongue of ice at an icefall at 850 m. By 2013 the northern tributary is no longer connected to the main glacier, there is bare rock extending across the full width of the former icefall area. In 2014 the image is from the end of July and the snowline is already above 950 m. It is evident that the glacier will lose nearly all of its snowcover by the end of the melt season on October 10th. The glacier has retreated 900 meters since 2004, and 2.2 km since 1984. The recent loss of tributaries indicates less contribution of ice to the glacier and that retreat will continue. This retreat is the same as that of nearby Field Glacier, Meade Glacier and Ferebee Glacier.
sinclair 1984

1984 Landsat image
sinclair 1986
1986 Landsat image
sinclair 2001
2001 Landsat image
sinclair 2004
2004 Landsat image
sinclair 2009
2009 Landsat image
sinclair 2013
2013 Landsat image
sinclair 2014
2014 Landsat image

West Speel Glacier Retreat and Lake Formation, Southeast Alaska

West Speel Glacier is an unnamed glacier that drains the same icefield as the Wright and Speel Glacier 45 km southeast of Juneau, Alaska. Here we examine the changes in this glacier from 1984-2013 using Landsat imagery. west speel glacier ge
Google Earth image

In 1984 the glacier ended on an outwash plain at the head of a branch of Speel River. The red arrow indicates the 1984 terminus for each image, the purple arrow the 2013 terminus and the yellow arrows tributary glaciers. In 1984 all three tributary glaciers fed West Speel Glacier and the glacier has no proglacial lake at the terminus. The eastern tributary pink arrow has some retained snowpack with three weeks left in the melt season. Each tributary indicated by yellow arrow is still contributing to the glacier. In 1997 a lake basin is beginning to develop, though it is still largely filled by ice. The eastern tributary pink arrow, has lost all of its snowpack. In 1999 the proglacial lake has formed and has length of 1 km, the lake has expanded south and north of the 1984 terminus position, and does not entirely represent glacier retreat. The noted tributaries are still all connected to the main glacier. In 2013 the glacier has retreated 1200 m from the 1984 position and the lake is still expanding. The yellow arrows indicate that none of the three tributaries are still connected to the main glacier. The glacier in a sense is losing its income flow from these subsidiaries. The eastern tributary has retained some snowcover with six weeks left in the melt season in 2013, but this is mostly gone a month later. The melt season is off to a quick start in 2014, which promises to be a poor year for this glacier. The retreat of this glacier is the same story as seen at nearby Speel, Gilkey and Norris Glacier. west speel glacier 1984
1984 Landsat image
west speel glacier 1997
1997 Landsat image

west speel glacier 1999
1999 Landsat image

west speel glacier 2013
2013 Landsat image

west speel 2013sept
Sept. 2013 Satellite image