Vilkitskogo Glacier, Novaya Zemlya Retreat Releases Islands 1990-2020


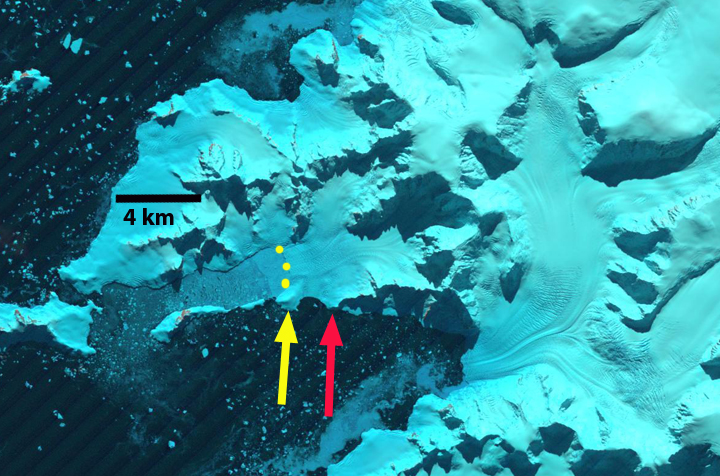
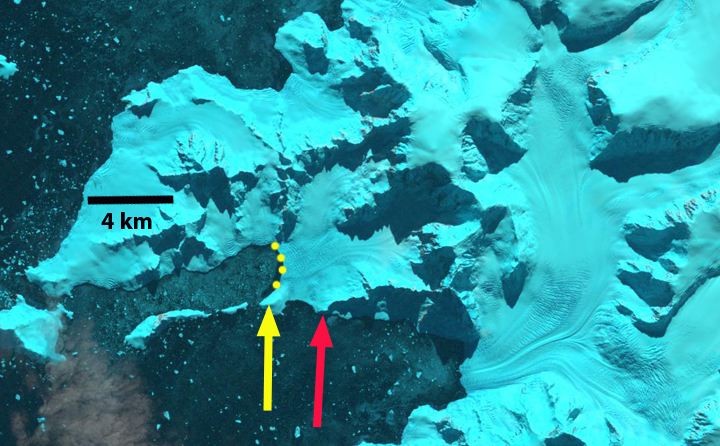
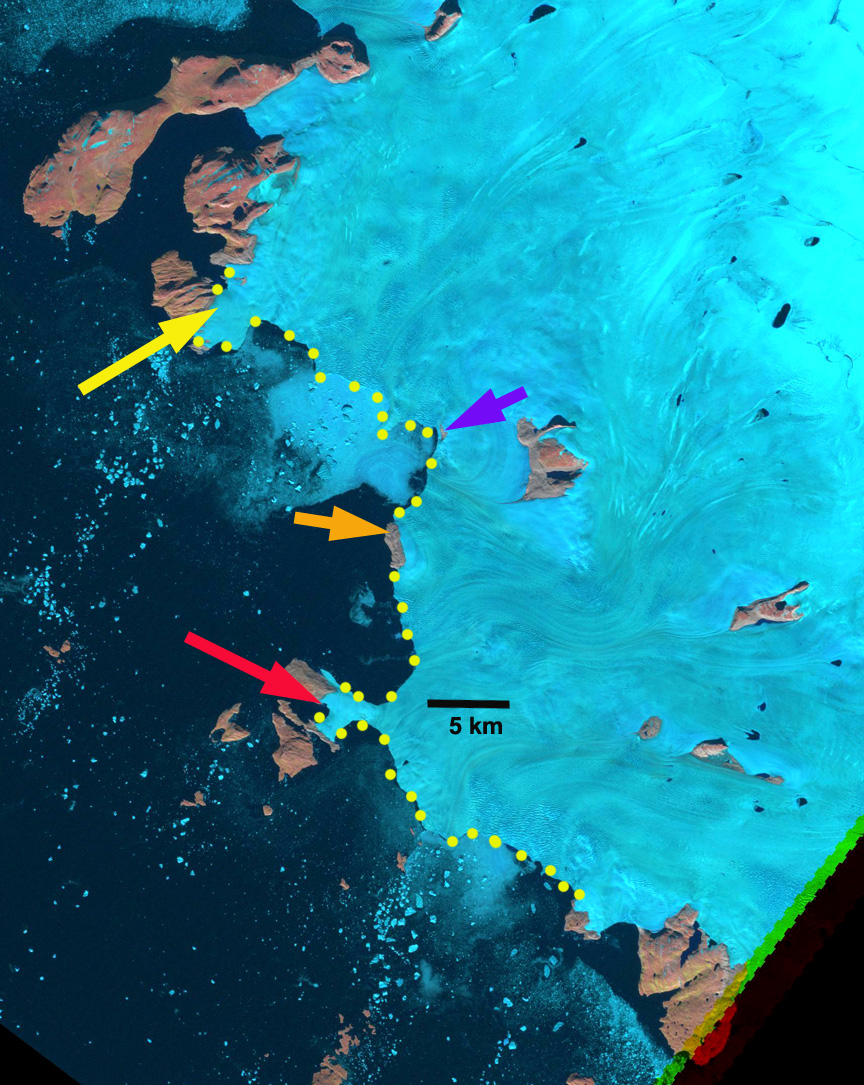
Vilkitskogo Glacier North (VN) and South (VS) terminus in 1990 and 2020 Landsat images. Terminus in 1990 ends on an island forming. Red arrow is 1990 terminus, yellow arrow is the 2020 terminus.  The 2020 image is from early June and shows low snowpack for so early in summer.

Vilkitskogo Glacier has two termini that had just separated in Vilkitsky Bay in 1990.  The glacier flows from the Northern Novaya Zemlya Ice Cap to the west coast and the Barents Sea. The glacier has been retreating rapidly like all tidewater glaciers in northern Novaya Zemlya (LEGOS, 2006;)(Pelto, 2016), Carr et al (2014) identified an average retreat rate of 52 meters/year for tidewater glaciers on Novaya Zemlya from 1992 to 2010 and 5 meters/year for land terminating glaciers. For Vilkitskogo they indicate retreat into a widening fjord, and that the south arm has a potential bathymetric pinning point. The increased retreat rate has occured synchronously with sea ice cover depletion in the Barents Sea and sea surface temperature increases. Both factors would lead to increased calving due to more frontal ablation.

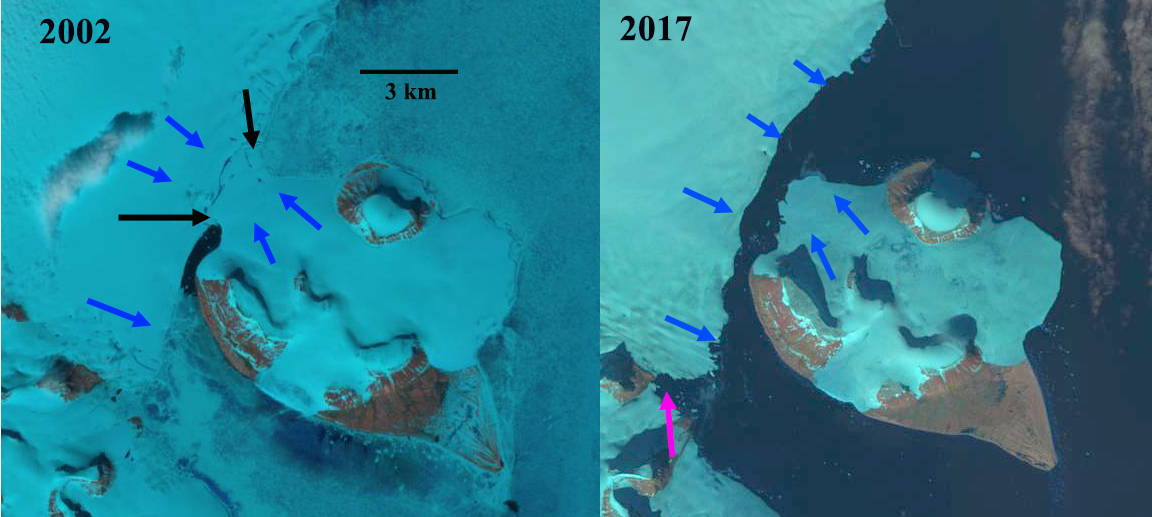
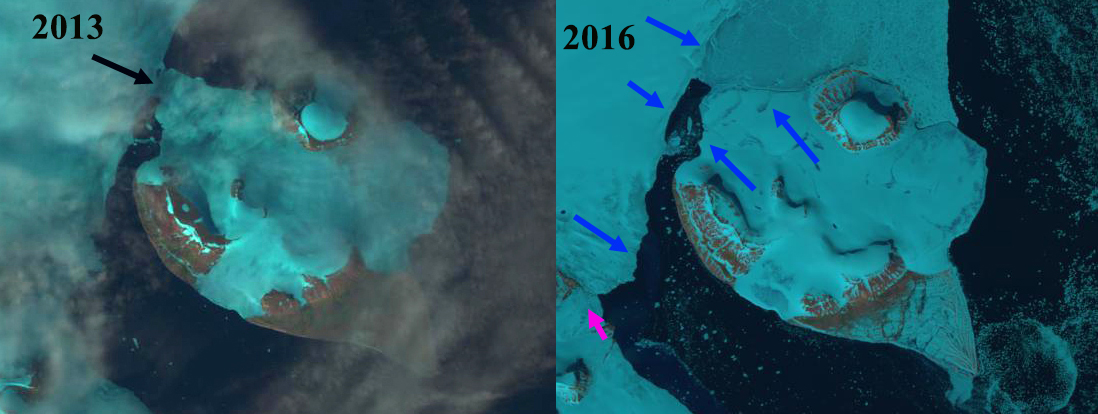
The north and south glaciers both terminated at the mouth of their respective fjords in 1990, with the southern arm ending on a small island/peninsula extension. In 1994 there is limited evident retreat.  By 2001 embayments had developed particularly along the peninsula separating them and the south terminus still ended on a developing island.  By 2015 Vilkitskogo North has retreated 5000 m along the northern side of the fjord and 4000 m along the south side since 1990.  This fjord has no evident pinning points, and the rapid calving retreat should continue.  Vilkitskogo South has retreated 1000 m on the west side and 1800 m on the east side.  The retreat had exposed a new island in the center of the glacier.  The glacier in 2015 terminates on another island.  Retreat from this pinning point will allow more rapid retreat to ensue.

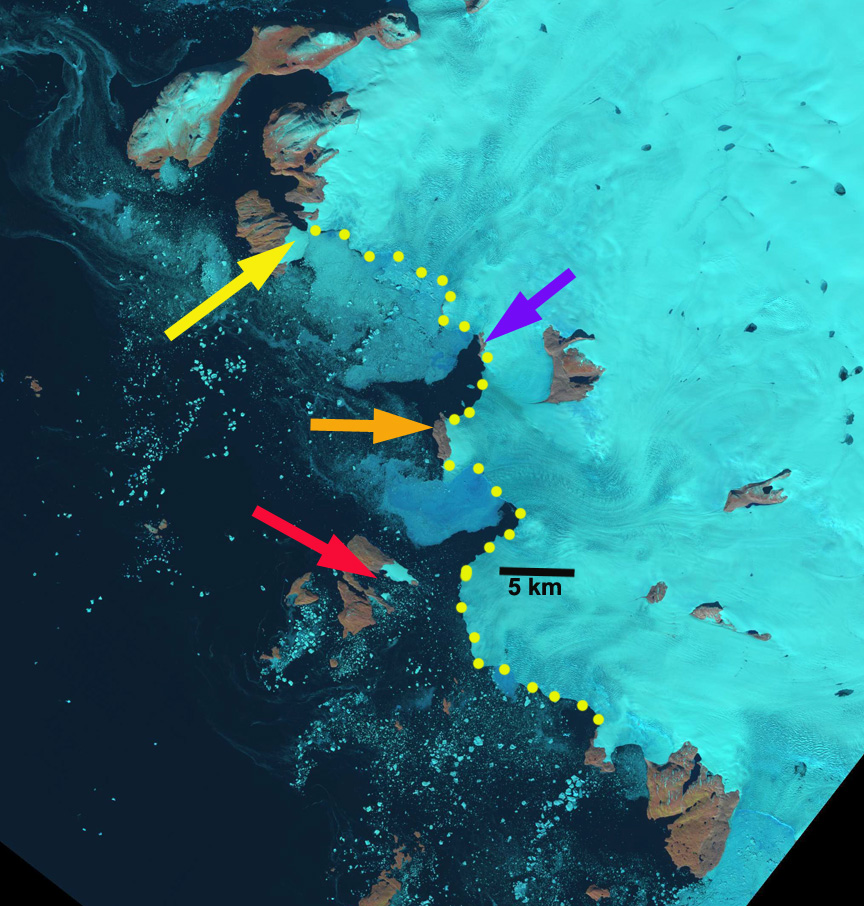
In 2020 the northern arm has retreated 5500 m since 1990 a rate of  ~180 m/year. The southern arm has retreated from the island with an overall retreat of 2300 m, a rate of ~75 m/year.

The front of the terminus in each case remains heavily crevassed indicating  high frontal velocity and ablation.  This indicates the calving retreat will be ongoing. The retreat has the same unfolding story as KrivosheinaNizkiy and Glasova Glacier and Krayniy Glacier.

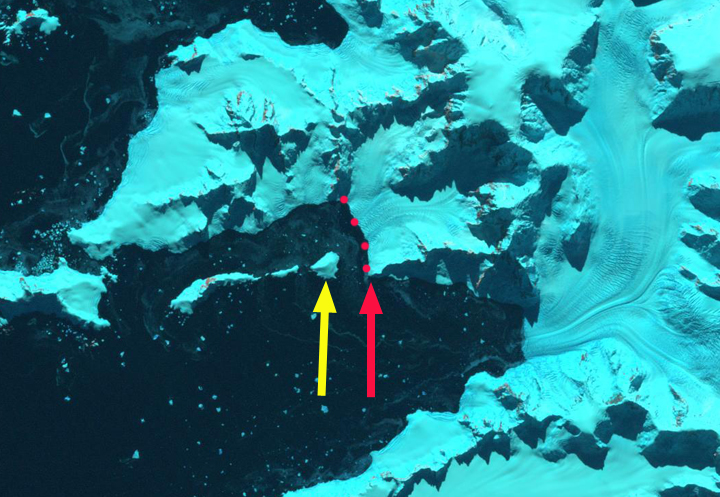
Vilkitskogo Glacier  terminus in  2020 Landsat image showing two new islands. Terminus in 1990 ends on an island forming. Red arrow is 1990 terminus, yellow arrow is the 2020 terminus. 

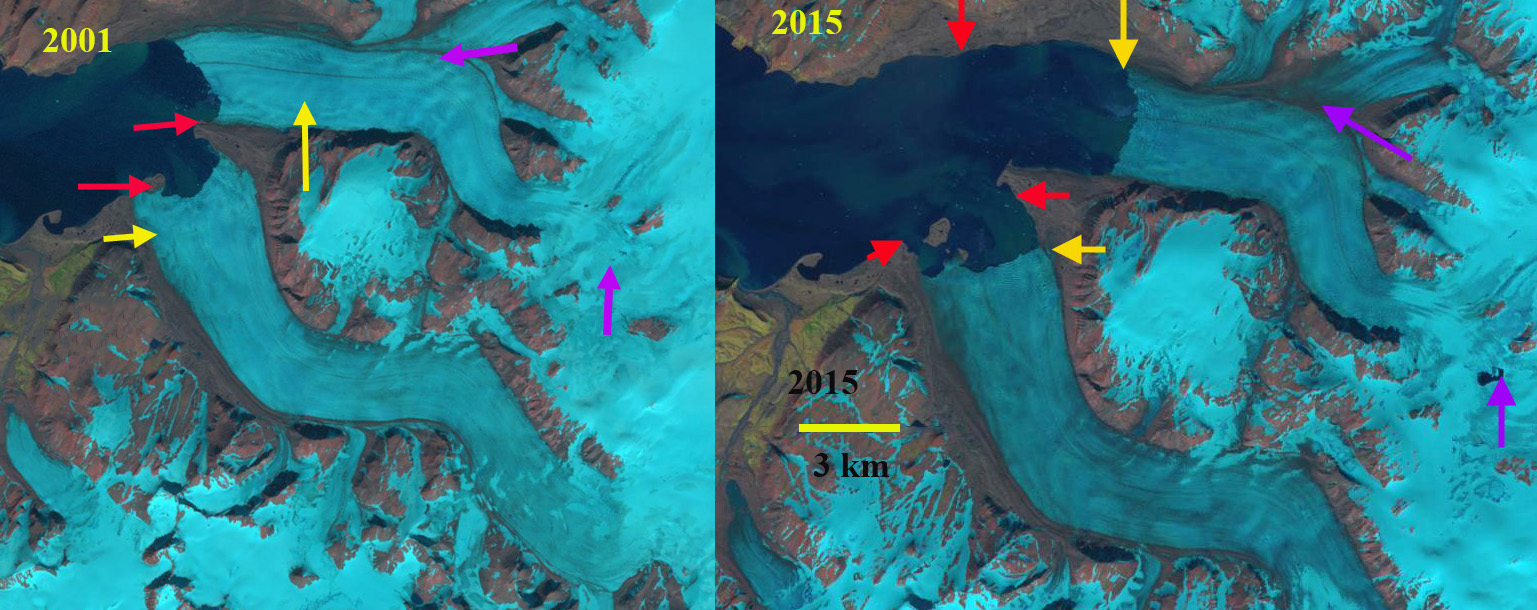
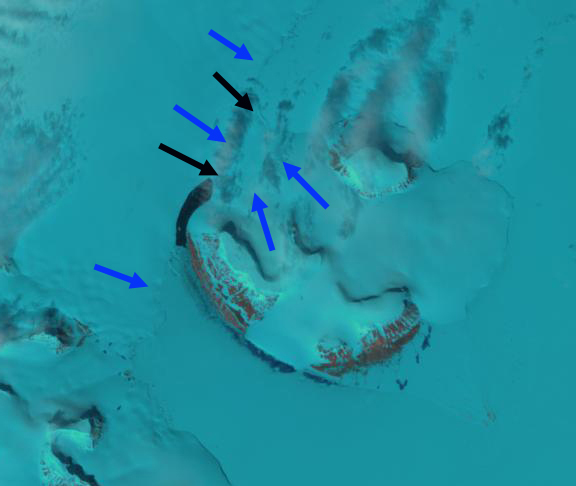
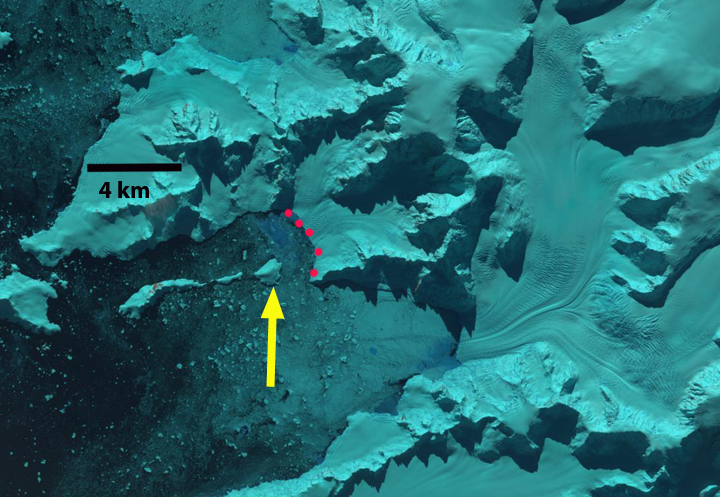
Vilkitskogo Glacier terminus in 2001 and 2015 Landsat images. Terminus in 2001 ends on an island to be. Terminus in 2015 ends on a second island forming. Red arrow is 1990 terminus, yellow arrow is the 2015 terminus. Purple arrows show areas of expanding bedrock.

Franz Josef Islands Separate due to Glacier Retreat

Hall Island (left) and Littrow Island (right) in 2002 and 2017 Landsat images.  The islands are connected by glacier in 2002 between the black arrows.  The blue arrows indicate glacier flow.  In 2017 the glacier connection has failed and Nordenskjold Strait has formed. 

Hall and Littrow Island are two islands in the southern part of Franz Josef Land, Russia that have until 2016 been connected by glacier. Sharov et al (2014) generated a map with the MAIRES Project illustrating the glacier connection was failing, see below. Sharov and Nikolskiy (2017) further report on the failure of this glacier connection.  Here we utilize Landsat imagery from 2000-2017 to illustrate the change.

In 2000 the island are surrounded by considerable sea ice and there is a 3 km wide glacier connection, black arrows.  In 2002 the island are again surrounded by considerable sea ice that is distinguishable from the glacier ice.  The glacier connection between the island remains 3 km wide, black arrows, with blue arrows showing the direction of ice movement.  By 2013 the connection has narrowed to 0.7 km and there is no sea ice.  In 2016 the glacier connection is gone between hall and Littrow Island and Nordenskjold Strait has formed.  There is sea ice on the northern shore of Littrow Island reaching to Hall Island. To the southwest the pink arrow indicates where the Sonklar Glacier connects with an unnamed glacier in 2016.  In 2017 there again is no sea ice and the open water between Littrow Island and Hall Island is more apparent. The inlet averages 800 m in width.  The connection between Sonklar Glacier and the neighboring glacier, at the pink arrow, has failed. The lack of sea ice in the region is exposing the marine margins of the ice caps in Franz Josef Land to enhanced melting.  This has and will lead to more coastal changes and island separations.

Hall Island and Littrow Island in 2013 and 2016 Landsat images.  The black arrow indicates a narrow connection in 2013.  In 2016 the glacier connection has failed and Nordenskjold Strait has formed.

Map from MAIRES (Monitoring Arctic Land and Sea Ice from Russian and European satellites) showing the changing connection between islands. 

2000 Landsat image indicating connection between islands at black arrows.


Leroux Bay Glacier Retreat-Island Formation, Antarctic Peninsula

Leroux Bay is on the west coast of the Antarctic Peninsula in Graham Land.  Numerous glacier drain from the Antarctic Peninsula into the ocean along this coast, and as they retreat the coastline is changing.    Air temperatures rose by 2.5°C in the northern Antarctic Peninsula from 1950 to 2000, which has led to recession of 87% glaciers and ice shelves on the Peninsula in the last two decades (Davies et al.,2012). Most spectacularly has been the collapse of Jones, Larsen A, Larsen B, Prince Gustav and Wordie Ice Shelves since 1995 (Cook and Vaughan, 2010). This has opened up our ability to examine sediments that had accumulated beneath the floating ice shelves.   The LARISSSA Project has been pursuing this option and utilized the Korean icebreaker ARAON to explore and map the bathymetry of Leroux Bay.  Last week Antarctica recorded its highest temperature at  the Argentine Base Esperanza on March 24th, 2015 located near the northern tip of the Antarctic Peninsula reported a temperature of 17.5°C (63.5°F). Here we examine the changes from 1990 to 2015 of glacier on the north side of Leroux Bay. 

LARSEN

Location of Glacier examined from USGS Map.

leroux bay ge

Google Earth image indicating glacier flow directions, blue arrows, island yellow arrow and glacier terminus red arrow.

In 1990 and 1991 the Leroux Bay Glacier extended to the yellow arrow, which is an island connected by the glacier to the mainland and acts as a stabilizing point for the glacier. The ice front is marked with yellow dots in both cases. The terminus region of the glacier is floating, making this a small ice shelf, fed by three tributaries, one from the north, one from the east and one from the northeast.  By 2001 the glacier front has retreated to the red arrow, losing most of the floating area, and the northern tributary now has an independent calving front.  The red arrow also points to the tip of a peninsula, another stabilizing point, the ice front is marked by the red dots for 2001 and 2015. The yellow arrow indicates the new island that is detached from the mainland. The two images from January 2015 and Late February 2015 indicate limited retreat an the north and south sides of the terminus, but retreat in the glacier center has led to a concave shaped calving front. Retreat from 1990 to 2015 averages 2.1 kilometers. The USGS map (Blue Line) indicates the terminus in the 1960’s was 3 km beyond the 1990 terminus location. The calving front remains active with extensive crevassing.  It is not clear simply from Landsat imagery if any of the glacier is afloat, if so it would likely be the southern half of the eastern tributary, There is limited melting in this region, so volume loss can occur via basal melt via ocean water or calving.  Even in a warm summer there is little visible evidence of surface melting in 2015. The widespread loss of mass from ice shelves in Antarctica is mainly via basal melting (Paolo et al, 2015). An examination of the coast in the region illustrates numerous other examples where glacier retreat has led to separation of islands, such as with the loss of the Jones Ice Shelf.

leroux bya 1990
1990 Landsat image

leroux bay 1991
1991 Landsat image
leroux bay 2001
2001 Landsat image
leroux bay 2015 early
January 2015 Landsat image
leroux bay 2015 late
Feb. 2015 Landsat image

Steenstrup Glacier Retreat, New Island Generation NW Greenland

Steenstrup Glacier is located at 75.2 N in Northwest Greeland. The glacier terminates on a series of headlands and islands, the glacier immediatley to the south is Kjer Glacier. The boundary between Steenstrup Gletscher and Kjer Glacier is Red Head, Steenstrup Glacier’s northern margin is at Cape Seddon. Here we examine changes in the terminus position of Steenstrup and Kjer Glacier from 1999 to 2013. The retreat of the glacier during this interval has led to generation of new islands. Steenstrup Glacier has retreated 10 km over the past 60 years (Van As, 2010). Kjer Glacier was noted as relatively stable until loss of connection with Red Head Peninsula in 2005 (Van As, 2010).
steenstrup map
Image from Van As (2010).

McFadden et al (2011) noted several glaciers in Northwest Greenland Sverdrups, Steenstrup (75°16’15.37”N), Upernavik, and Umiamako that had similar thinning patterns. Each experienced rapid thinning of up to ~100 m a-1 since 2000. They further noted that thinning was not synchronous with Steenstrup and Sverdrups thinning fast from 2002 to 2005, Upernavik from 2005 to 2006, and Umiamako from 2007 to 2008. This is not exactly synchronous, but occurring within a few years is essentially synchronous in terms of glacier dynamics. Each glacier also had a coincident speed-up with a 20% acceleration for Steenstrup Glacier (McFadden et al, 2011). This is a familiar pattern with thinning there is less friction at the calving front from the fjord walls and the fjord base, leading to greater flow. The enhanced flow leads to retreat and further thinning, resulting in the thinning and the acceleration spreading inland. The initial thinning comes from a combination of basal and surface melt.

Here we examine Landsat images from 1999, 2001 and 2013 to identify changes. The red arrow indicates Red Head, which the glacier still reaches in 1999, though the connection is less than 2 km wide. The purple arrow indicates a small nunatak where the Automatic Weather Station utilized by Van As (2010) is located. The nunatak is 1.5 km from the ice edge in 1999. The orange arrow is an island at the ice front, South of the island the ice front is even with the island in 1999. The yellow arrow notes the connection of Steenstrup Glacier to Cape Seddon that is about 4 km wide. In 2001 there is little change in the ice front except at the purple arrow, where retreat has almost brought the nunatak to the terminus. By 2013 the connection to Red Head has been lost, it is now an island, this occurred as noted by Van As (2010) in 2005. Retreat from Red Head is 6 km. There is a substantial embayment south of the island at the orange arrow, indicating 4 km of retreat. North of this island that will soon lose it connection to the ice sheet, the embayment has expanded as well. At the purple arrow the ice front has reached the former nunatak now becoming an island. At the yellow arrow the loss in ice area at Cape Sneddon is greater than at Red head, though a connection may still exist, it is too narrow to measure. The last image below is a 2012 Google Earth image indicating the narrow connection to Cape Sneddon at that time and the strange relict crevasse pattern. It is clear that the end of Cape Sneddon will be in island next summer if not already, the MODIS imagery is not clear enough to distinguish this. The connection to the island at the south end of Kjer Glacier, last yellow dot near bottom has become much narrower since 1999 and will follow the route of Red Head and Cape Sneddon. The retreat here is coincident with the thinning and acceleration and follows the pattern of retreat and new island generation seen at Kong Oscar Glacier, Alison Glacier and Upernavik Glacier.

steenstrup 1999
1999 Landsat Image

steenstrup 2001
2001 Landsat image

Steenstrup 2013
2013 Landsat image
cape sneddon crevasses
Google Earth 2012 image Cape Sneddon.