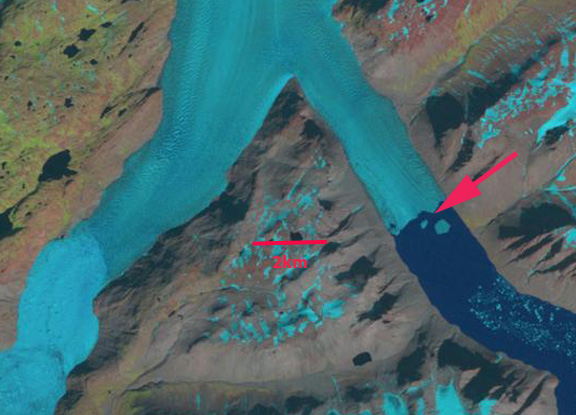
Apostelens Glacier in Norrearm Fjord Landsat comparison from 1999 to 2016. Red arrows are the 1999 terminus location, yellow arrows the 2016 terminus location and purple arrows indicate an expanding bedrock ridge.
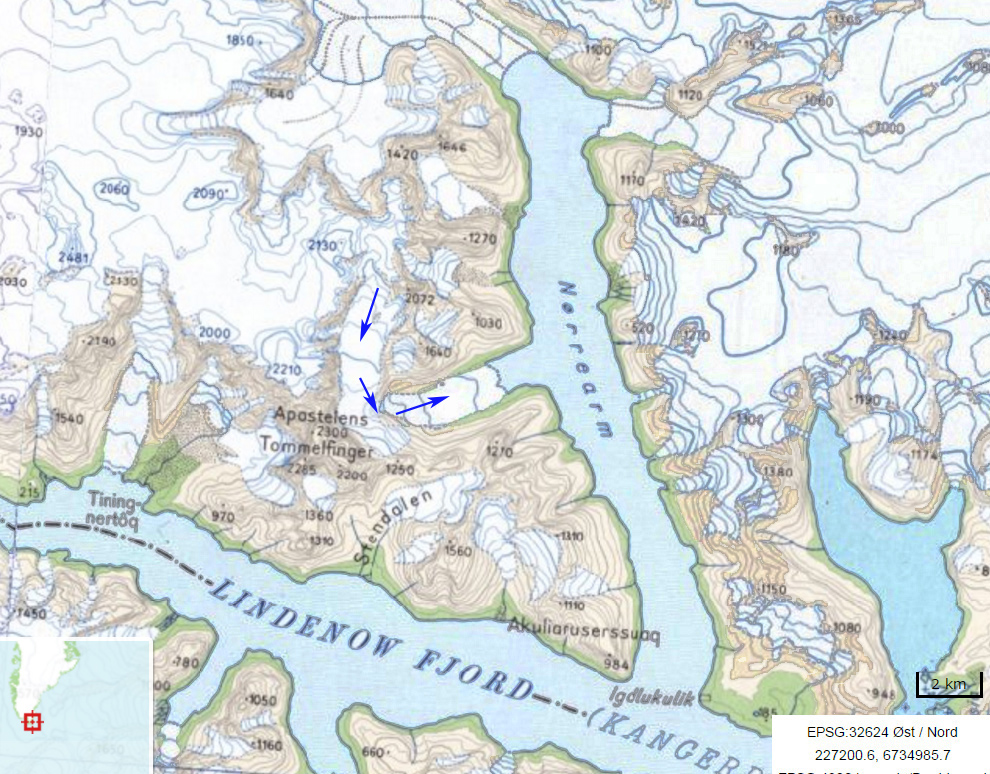
“Apostelens” Glacier drains east from a peak of the same name into an arm of Norrearm Fjord, which in turn is part of Lindenow Fjord in southern Greenland. The glacier is a short distance north of Kangersuneq Qingordleq, where recent retreat has led to glacier separation. The glacier is soon to lose its tidewater connection as has occurred at Tasermiut Fjord to the west. This will result in a decline in iceberg production as well.
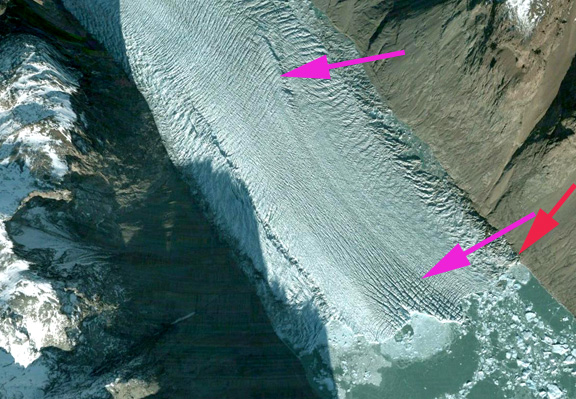
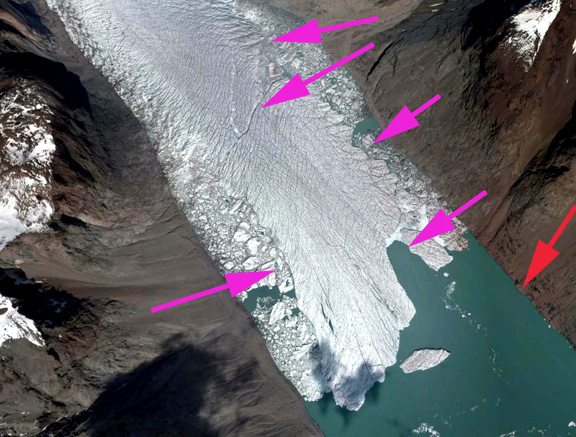
Here we examine Landsat imagery from 1999-2016 to identify glacier change. In 1999 the Apostelens arm of Norrearm Fjord is largely filled by the glacier which extends to within 2.5 km of Norrearm Fjord, red arrow. The tongue contains numerous ogives formed each year due to seasonal velocity changes through an icefall. This is evident in the Google Earth image from 2004, where 24 ogives are evident on the low slope glacier tongue, in 1999 the number is over 30. By 2013 the glacier has retreated nearly 2 km from the 1999 terminus position, red arrow. In 2012 Google Earth imagery indicates increased crevassing near the front and the loss of most ogives. New ogive formation is also hard to distinguish. By 2016 the glacier has retreated 2.6 km and is nearing the headward limit of the fjord arm. The collapse of the fjord tongue and its associated ogives indicates the loss of 30 years worth of volume flux that emerged from the icefall that generated the ogives.
Greenland tidewater outlet glaciers in this region have experienced substantial retreat since 1990, Weidick et al (2012) and Howat and Eddy (2011). Murray et al (2015) examined 199 tidewater glaciers in Greenland and noted significant retreat of 188 of them. Apostelens Glacier was not one of these, and soon will not be a tidewater glacier to be included in the list.
Apostelens Glacier in Norrearm Fjord Google Earth comparison from 2004 and 2012. Red arrows are the 2004 terminus location, and yellow arrows the 2012 terminus location. Note ogives in 2004 and loss of them in 2012.
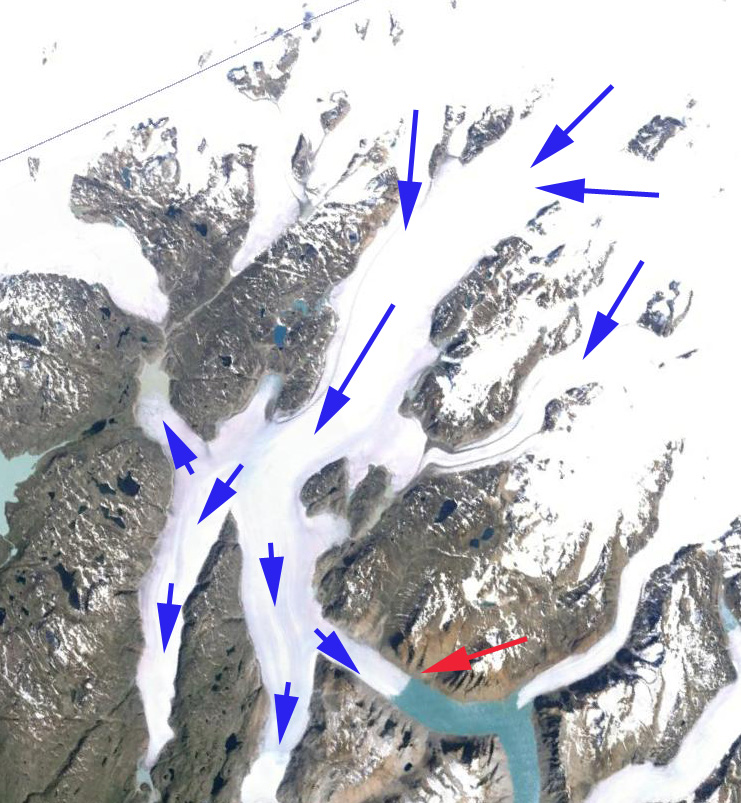
Map of the Norrearm Fjord region and Apostelens Glacier, with blue arrows indicating flow.
Landsat image sequence from 1999-2016. Red arrows mark the 1999 terminus, yellow arrows the 2016 terminus and the purple arrow a tributary that detaches from Semitsiaq (S). Tasermiut Sermeq (T) retreats from the fjord.
Tasermuit Fjord in southern Greenland is noted for its beauty, and until recently the fjord terminated at a glacier front. Currently no glacier reaches to the fjord. The retreat over the last two decades is similar to neighboring glaciers Kangersuneq Qingordleq and Qaleriq. The loss of direct glacier connection is also occurring at Alangordlia. Here we examine Landsat images from 1999-2016 to observe glacier change. At the head of the fjord is Sermeq Tasermiut and on the east side is Sermitsiaq.
In 1999 the Sermitsiaq Glacier terminated at the eastern end of a small lake, red arrow. Tasermiut Sermeq terminated in the fjord, red arrow. By 2002 Sermitsiaq had retreated from the lake, while Tasermiut Sermeq still reached the fjord. In 2013 Tasermiut Sermeq had retreated from the fjord and Sermitsiaq had retreated substantially from the lake and also had a significant tributary from the north detach, purple arrow. In 2016 Sermitsiaq has retreated 700 m since 1999, yellow arrow. Biggs (2011) had noted a 610 m retreat of the glacier from 1987-2009, a slower rate than since 1999. Tasermiut Sermeq has retreated 300 m since 1999,and has a narrow steep tongue that will melt back quickly in the near future.
Murray et al (2015) examined 199 tidewater glaciers in Greenland and noted significant retreat of 188 of them. This is changing fjord dynamics, which will in the case of Tasermiut affect the marine biology, which has not been studied in any detail yet. Students on Ice 2014 Arctic Expedition provides exceptional imagery of this fjord and the Nanotarlik region.
Google Earth imagery of the region. illustrating the loss of fjord connection after 2009.
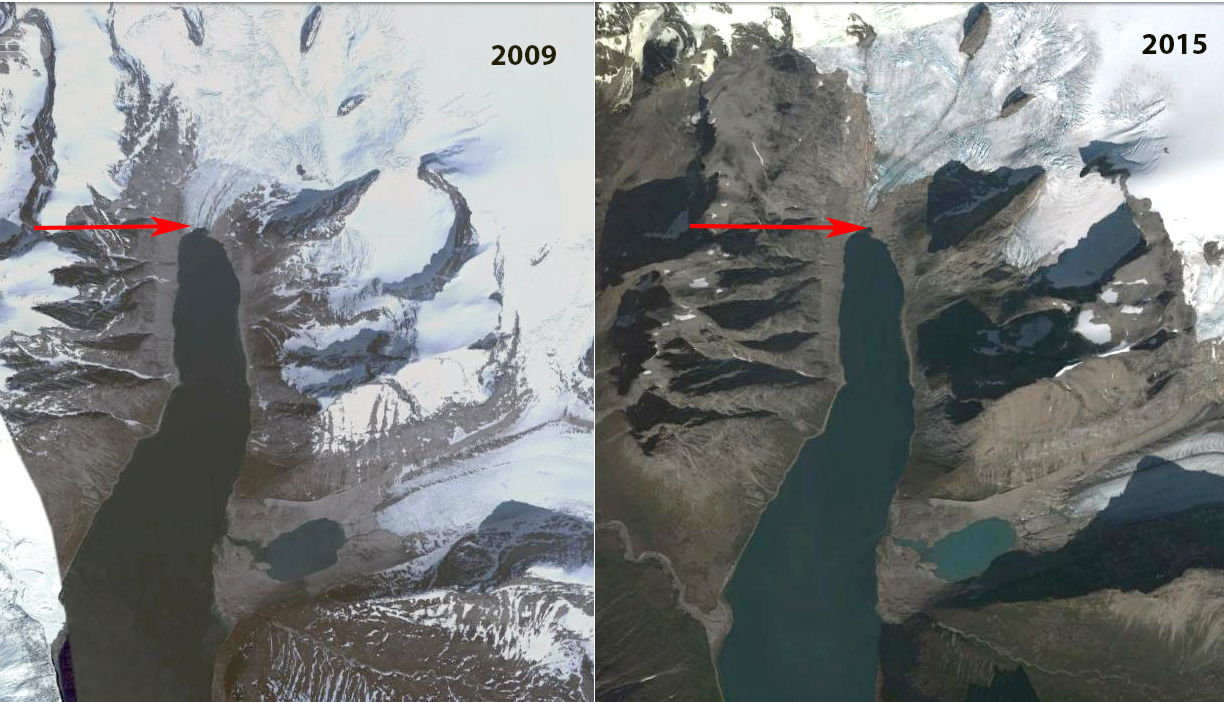
Tingmiarmit Glacier comparison in 1999 and 2015 Landsat images indicating the separation of tributaries at the terminus. The red arrows indicate the 1999 terminus and the yellow arrows the 2015 terminus location. Point A is peninsula where the tributaries joined, and Point B is a nunatak just upglacier from the 2015 terminus.
Tingmiarmit Glacier (Timmiarmiit also) ends in the Tingmiarmit Kangertivat Fjord in southeast Greenland. The glacier is just south of Heimdal Glacier and is noted by Rignot et al (2012) as having a velocity of 1.4 to 3 km/year. Moon et al (2012) note that most glaciers in SE Greenland experienced a significant velocity increase after 2000. In 1999 the glacier terminus was beyond the junction of two main tributaries, with little variation from 1994. Here we examine 1999-2015 imagery to identify the separation and retreat. The retreat is similar to that of nearby Thrym Glacier, which also had a tributary separation and nearby Puisortoq.
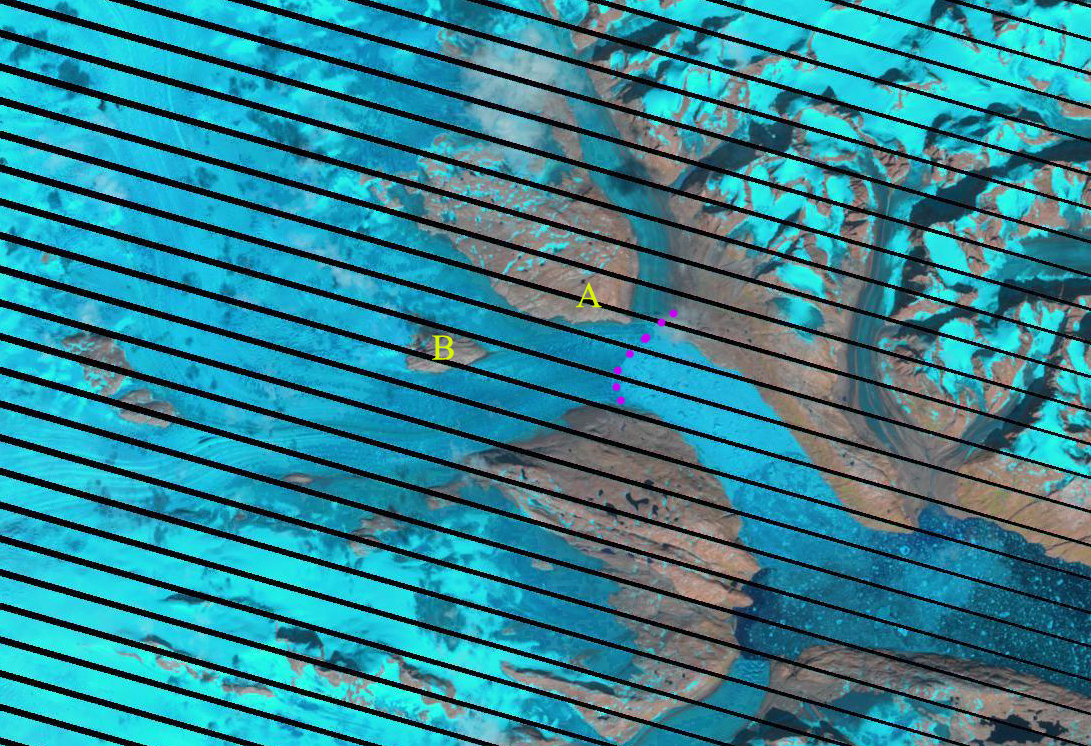
In 1999 the glacier terminates 1 km beyond the junction of the two tributaries, indicated by red arrow on each image. The fjord is 2.2 km wide at this point. The terminus had not changed in 2001 Landsat imagery. By 2010 terminus is now located at the junction of the two glaciers. which still share a single calving front, though the calving front is longer with northern and western facing section. In 2015 retreat has led to complete separation of the western and northern tributary. The western tributary is the main glacier and has retreated 2.4 km and the northern tributary has retreated 2.2 km in the sixteen year period. The retreat of the northern tributary has been slower since 2010. The western tributary now terminates 1.5 km from former junction.The fjord is expanding in width, which suggests the current terminus is not at a stable location. The nunatak marked B is a potential point of stability but not likely as the main arm of the glacier goes south of this location and then the fjord continues to expand. Moon and Joughin (2008) observed an ice sheet tidewater glacier retreat rate increase from 2000-2006, coinciding with an increase here. Howat and Eddy (2010) noted a mean change for this region of -107 m per year. Tingmiarmit Glacier’s rate of retreat was slightly higher at 120 m/year for the 1999-2010 period and . Polar Portal continues to expand the number of glaciers with updated terminus positions from satellite imagery with 20 presently.
Mountain Photographer Jack Brauer captured an excellent image of the terminus area in late August, particularly given it was out a commercial airliner window. This image illustrates the steeper slopes and much smaller contribution of the tributaries to the right (east) of Point A and B. The image also indicates that Point B is likely not a significant pinning point to stabilize the terminus. The map below from the Greenland Geological Data viewer indicates the change with the tributaries now disconnected.
Image from Jack Brauer, looking northwest toward Tingmiarmit.
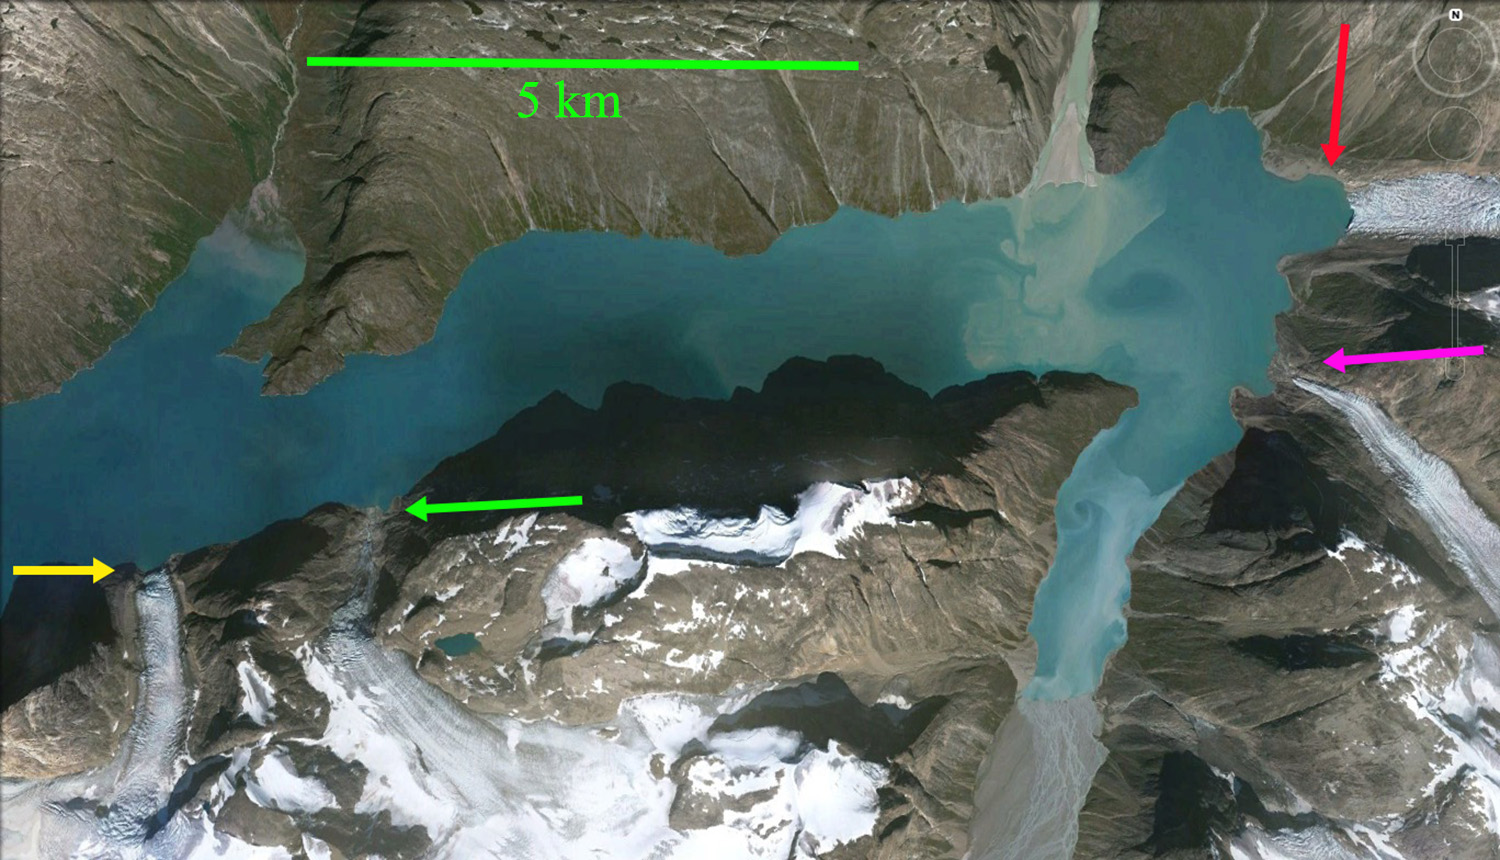
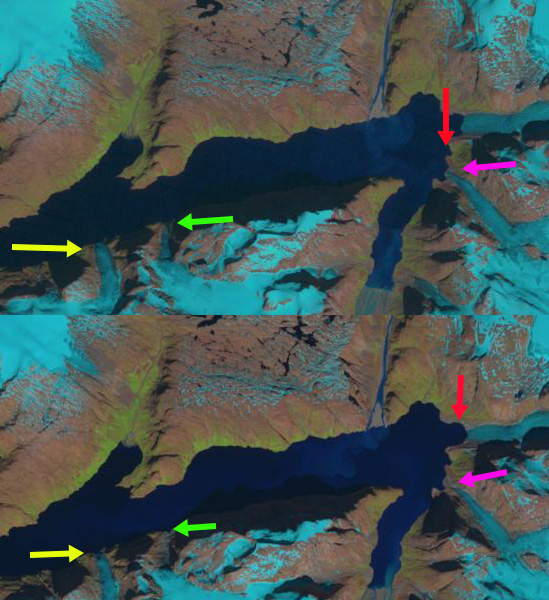
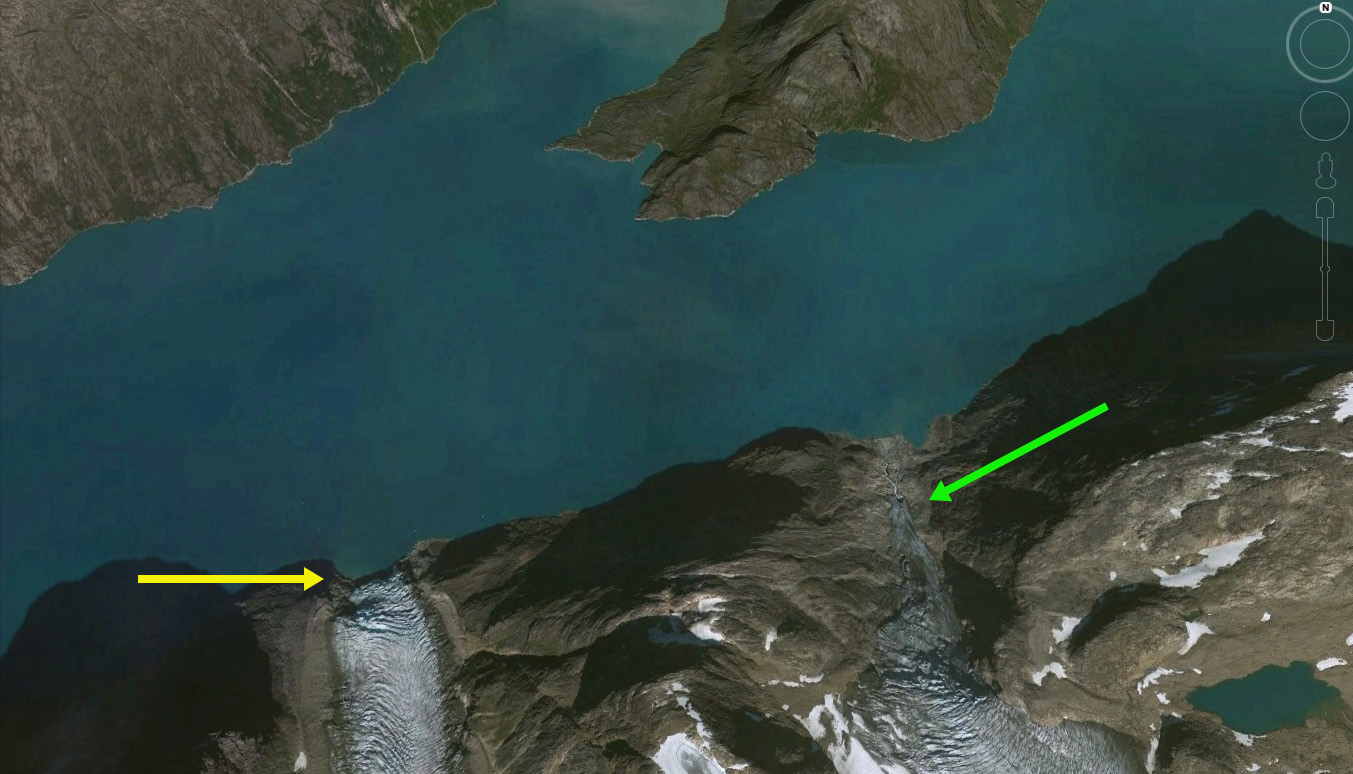
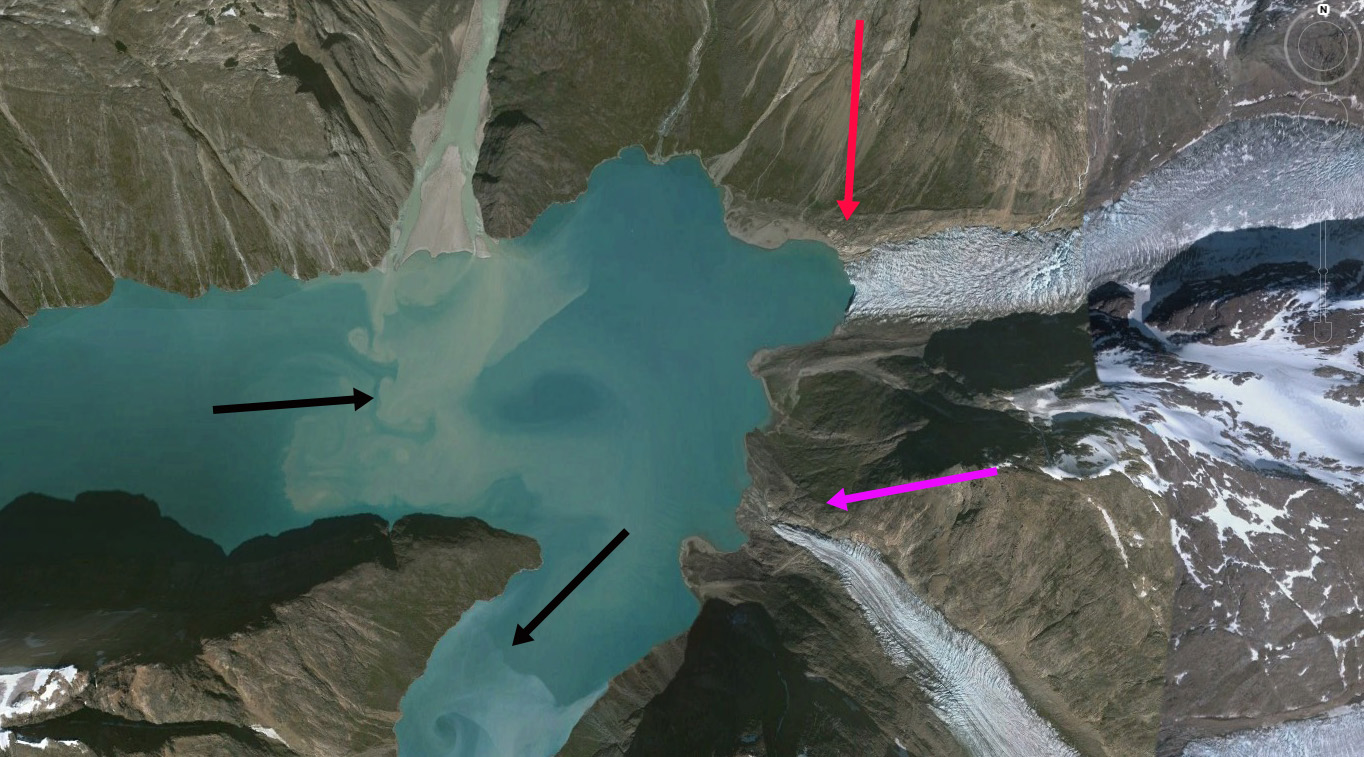
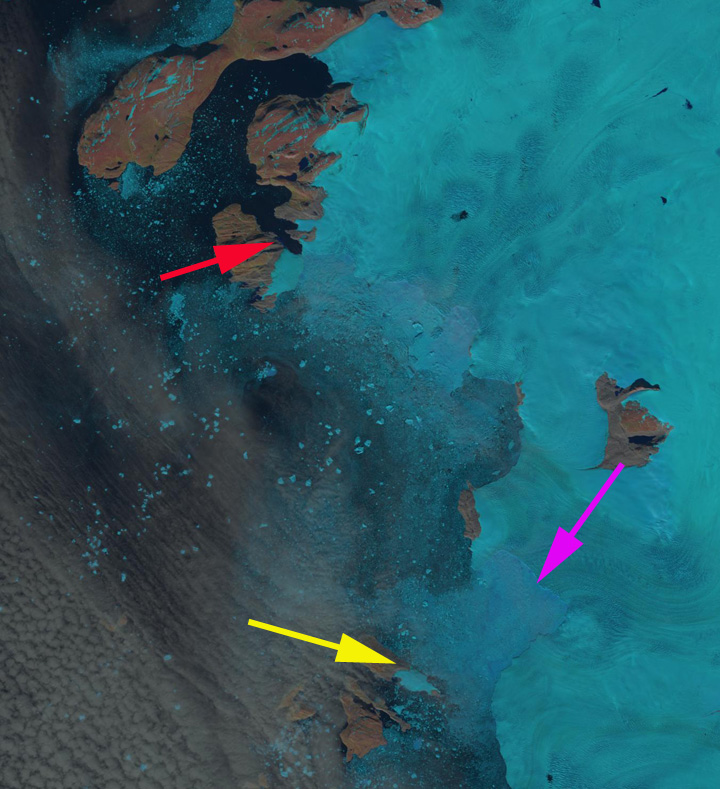
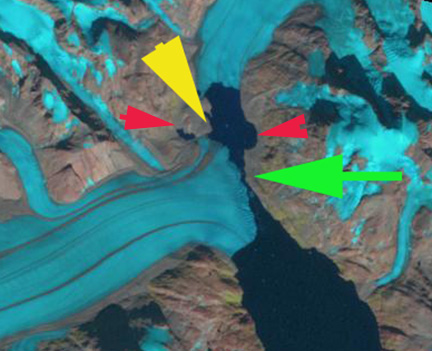
At the AGU 2015 meeting a clear change from 15 years ago is the interdisciplinary nature of most research featured in most sessions. In the glacier sessions there is physical oceanography, biology, climatology etc.to add in. I will examine a SW Greenland Fjord, Alangordlia to illustrate this. In 1987 Landsat image there are four glaciers reaching tidewater in the fjord and two significant glacial fed streams contributing plumes of sediment. By 2015 two of the glaciers, green arrow and pink arrow, have retreated from contact with the fjord. The glacier at the yellow arrow will lose contact with the fjord quite soon, and the glacier at the red arrow has reduced width of contact and will retreat from the fjord in the near future. A closeup using Google Earth from 2010 illustrates the terminus of each glacier, below.
Landsat comparison image from 1987 above and 2015 below.
As glacier melt increased in Greenland after 2000, the glacier runoff would have increased along with the sediment and nutrient flux from these streams (McGrath et al., 2010). These plumes can be seen and even quantified using satellite imagery. The fjord outflow would increase mostly in the near surface layer as the water is fresh. This would increase the deep water inflow of salty water (Straneo et al., 2011). The water entering the fjord would be warmer if there is no shallow sill preventing entry. With greater flow and more nutrients the biology of the system would be altered. Peterson et al (2015) note a summer phytoplankton bloom coinciding with the increase of summer glacier runoff. In Svalbard examination of biology in front of glaciers by (Lydersen et al, 2013) identify that kittiwakes, fulmars, ivory gulls and glaucous gulls are common in large numbers in the so-called “brown zone”, the area in front of tidewater glaciers that is ice-free due to currents and muddy due to suspended sediments, such as in Alangordlia. The further observe that Animals at these sites typically have their stomachs full of large zooplankton or fish and that the brown zones are also foraging hotspots for ringed seals. If these were larger glaciers with deep bottoms, this water would enhance melting (Chauché et al, 2014). In this case the thin glaciers would not be much affected. The glacier retreat of these minor glaciers follows the trend of major glaciers. Murray et al (2015) examined 199 tidewater glaciers and noted significant retreat of 188 of them. This resulted in a major increase in overall mass loss from Greenland, which quadrupled from 1992- 2001 to 2001-2011, yielding a 7.5 mm net contribution to sea-level rise from 1992-2011( Moon , 2014). The updated response is the Arctic Report Card that will be discussed today at the AGU15 Meeting h (Tedesco et al, 2015).
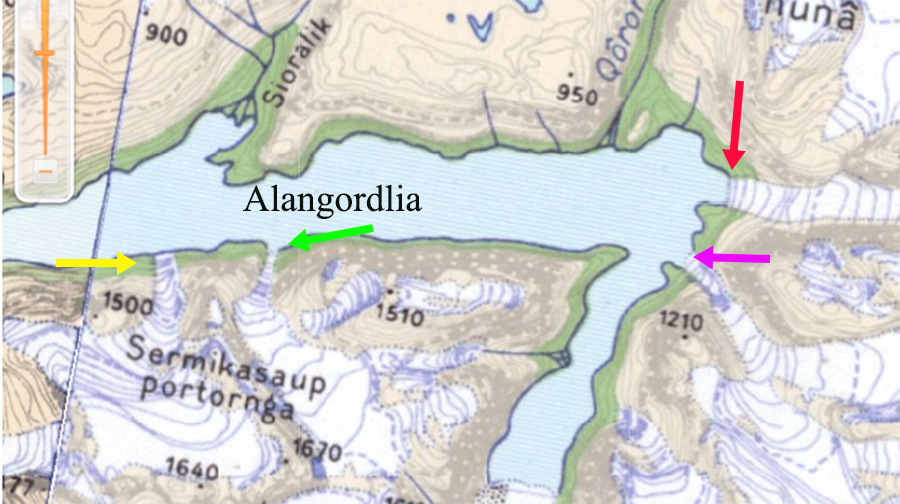
2010 Google Earth of glaciers on the south side of Alangordlia 2010 Google Earth of glaciers at the east end of Alangordlia Topographic map of region from NunaGIS
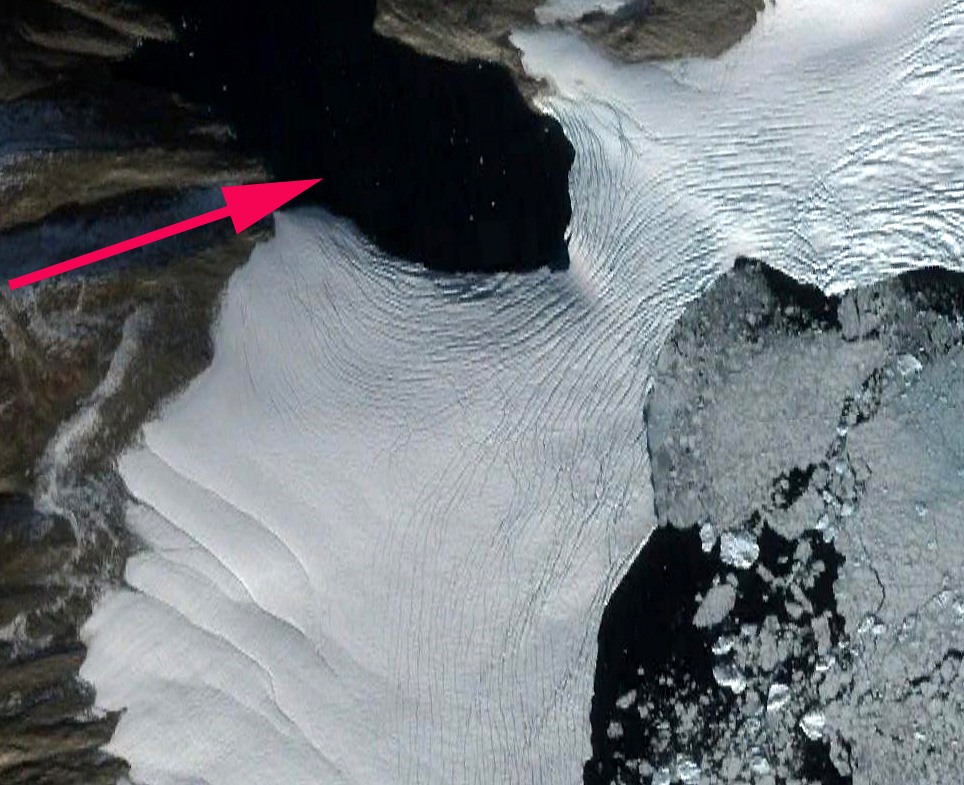
The retreat of outlet glaciers along the Greenland coast continues to change the maps of the region, Steenstrup Glacier located at 75.2 N in Northwest Greenland is an example of this. The glacier terminates on a series of headlands and islands, the glacier immediately to the south is Kjer Glacier. The boundary between Steenstrup Glacier and Kjer Glacier is Red Head, Steenstrup Glacier’s northern margin is near Cape Seddon. Here we examine changes in the terminus position of Steenstrup and Kjer Glacier from 1999 to 2014. The retreat of the glacier during this interval has led to generation of new islands. Steenstrup Glacier has retreated 10 km over the past 60 years (Van As, 2010). A recent example of the retreat is the separation from the glacier of an island in 2014. In 2012 there was a narrow glacier connection, red arrow, with an island Tugtuligssup Sarqardlerssuua that is clearly not stable, based on narrowness and extensive crevassing, the connection remained in 2013 and was in 2014.
Google Earth 2012 image Cape Seddon/Tugtuligssup Sarqardlerssuua, how long will this connection last? Less than two years.
Landsat image comparison of 2013 and 2014 of Cape Seddon/Tugtuligssup Sarqardlerssuua separation from Steenstrup Glacier.
Image from Van As (2010).
McFadden et al (2011) noted several glaciers in Northwest Greenland; Sverdrups, Steenstrup, Upernavik, and Umiamako that had similar rapid thinning patterns of up to ~100 m a-1 since 2000. They further noted that thinning was not synchronous with Steenstrup and Sverdrups thinning fast from 2002 to 2005, Upernavik from 2005 to 2006, and Umiamako from 2007 to 2008. This is not exactly synchronous, but occurring within a few years is essentially synchronous in terms of glacier dynamics. Each glacier also had a coincident speed-up with a 20% acceleration for Steenstrup Glacier (McFadden et al, 2011). Kjer Glacier was noted as relatively stable until loss of connection with Red Head Peninsula in 2005 (Van As, 2010). This is a familiar pattern with thinning there is less friction at the calving front from the fjord walls and the fjord base, leading to greater velcoity. The enhanced flow leads to retreat and further thinning, resulting in the thinning and the acceleration spreading inland. The initial thinning comes from a combination of basal and surface melt. This has been the primary mechanism for increased velocity of outlet glacier of the Greenland Ice Sheet.
Here we examine Landsat images from 1999, 2013 and 2014 to identify changes of Steenstrup and Kjer Glacier. The yellow arrow indicates Red Head, which the glacier still reaches in 1999, though the connection is less than 2 km wide. The purple arrow indicates the ice front just north of Red Head that extends nearly due north to the next island at the icefront. The red arrow indicates the ice front of Steenstrup Glacier at Tugtuligssup Sarqardlerssuua. By 2013 the connection to Red Head has been lost, it is now an island, this occurred as noted by Van As (2010) in 2005. Retreat from Red Head is 6 km by 2013. There is a substantial embayment that develops, purple arrow southwest of an island still embedded in the icefront, indicating 4 km of retreat. North of this island that will soon lose it connection to the ice sheet, the embayment has expanded as well. The connection to the island at the north end of Kjer Glacier, has become much narrower since 1999 and will follow the route of Red Head and Tugtuligssup Sarqardlerssuua. In 2014 Steenstrup Glacier at the red arrow has separated from Tugtuligssup Sarqardlerssuua. The island west of the purple arrow still acts as a pinning point having stabilized the ice front here since 1975, but is now isolated in the same way as Red Head in 1999 and will soon be released from the glacier. From 2013 to 2014 the embayment is spreading inland and north.
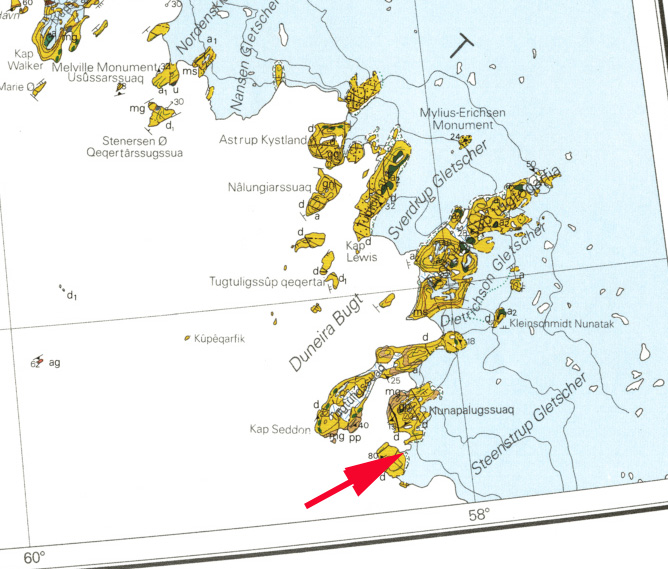
The retreat here is coincident with the thinning and acceleration and follows the pattern of retreat and new island generation seen at Kong Oscar Glacier, Alison Glacier and Upernavik Glacier. The map of Greenland is continues to change at an accelerated rate, bottom image is a geologic Map from the Geological Survey of Denmark and Greenland. Red arrow again indicates Tugtuligssup Sarqardlerssuua.
This is an index of posts on the response of specific Greenland glaciers to climate change. In the 1980’s when I first worked on Jakobshavn Isbrae, Greenland there was not much research occurring on the glaciers. Today in response to the dynamic changes discussed below and glacier by glacier in the index links, Greenland is the focus of numerous extensive, ongoing and important research projects. In 2015 scientists are gearing up for the main field season to better identify and understand the current and future response of this critical ice sheet. At the time of each post I reference the specific research relevant, the posts are from 2009-2014. In the intervening period new research has made some further advances, and I will endeavor to update each post to reflect this. The posts illustrate the significant response of Greenland Glaciers to climate change regardless of what type of glacier they are. The Polar Portal has developed an online viewer of change on selected glaciers. Each year the Arctic Report Card updates annual observations of Greenland Ice Sheet Change. The posts have benefitted from the insights and observations of Espen Olsen. Any questions about a glacier or suggestions on a glacier to look at let me know.
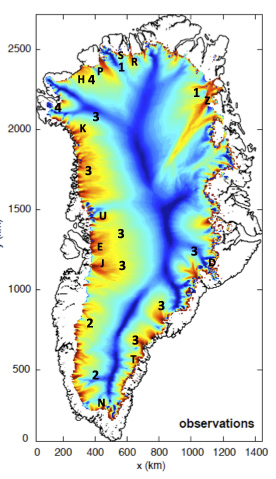
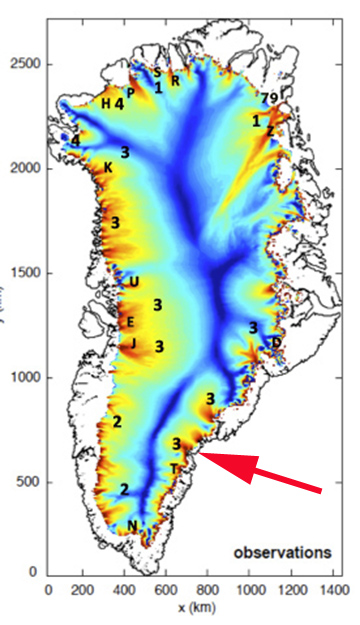
Base Map above right indicates the glacier types 1-4 distribution and key glacier locations with specific posts below. P=Petermann, R=Ryder, S=Steensby, H=Humboldt, Z=Zacharaiae, D=De Reste Bugt, T=Thyrm, N=Narssap Sermia, J=Jakobsan, E=Epiq Sermia, U=Umiamako, K=Kong Oscar.
Variations in Greenland Ice Sheet outlet glacier behavior
The Greenland Ice Sheet has an area of 2.17 million square kilometers (1.28 million square miles) and spans 18 degrees of latitude from north to south. It is not surprising that over this vast area that the geology and climate vary substantially and that this leads to variations in behavior of Greenland glaciers. Our tendency is to lump the Greenland Ice Sheet into one category impacted similarly by each of the dynamic forces that impact flow. This is akin to saying banks, credit unions and savings and loan institutions are impacted similarly by all the economic forces. In the case of a recession there is a shared signal, just as with global warming there is a shared signal among Greenland glaciers. This is a simplification that does not work. In this article we divide the glaciers into four main categories to illustrate the different properties and sensitiveness of each. This is an updated version of an article Dan Bailey and I wrote first for Skeptical Science, updated here with links above to the individual glaciers that emphasize the specific changes and with new references. In recent years the most striking aspect of Greenland Glaciers is that the signal of change is so strong and on so many of the different glaciers. The specific response is different, which if we try to lump the glaciers into one category, makes the data look noisy. Instead if we look at the response of glaciers with similar dynamics than the signal of response is strong indeed. Csatho et al (2014) note the variation in ice thickness across the ice sheet for the 1993-2012 period and that 48% of the thinning is driven by ice dynamics. The net loss is an equivalent contribution of 0.67 mm/year to sea level rise.
Greenland glaciers fall into at least 4 common types, each with its own unique sensitivity to sea surface temperature, surface melting, meltwater lubrication, calving changes, etc.
Type 1: Northern, with Large Floating Termini
Northern glaciers with large floating termini (Petermann, Ryder, Steensby, Zachariae, Academy, etc). Each of these is a marine terminating outlet glacier that has an extensive floating ice shelf. The large ice shelves can exist in part due to the lower surface melt rates and the lower flow rates of the glacier. Petermann Glacier is the fastest with a flow speed of 1000 m/year at the grounding line. This is much less than the average outlet glacier speed along the west coast. The large floating ice shelves are susceptible to bottom melting but, except for Petermann Glacier, we have no observations of the process or that more warm water is penetrating under these ice shelves. Rignot and Steffen (2008) found that at Petermann Glacier 80% of the ice loss into the ocean was from basal melting of the floating tongue. If the ice shelves are removed, the feeding glacier is less buttressed and will accelerate for a period and draw down its surface profile. The recent ice area lost by Petermann, Steensby, Academy and Zachariae Ice Stream indicate these glaciers are being impacted by the increased melting at the surface and likely the base of the ice shelf for Petermann Glacier at least.
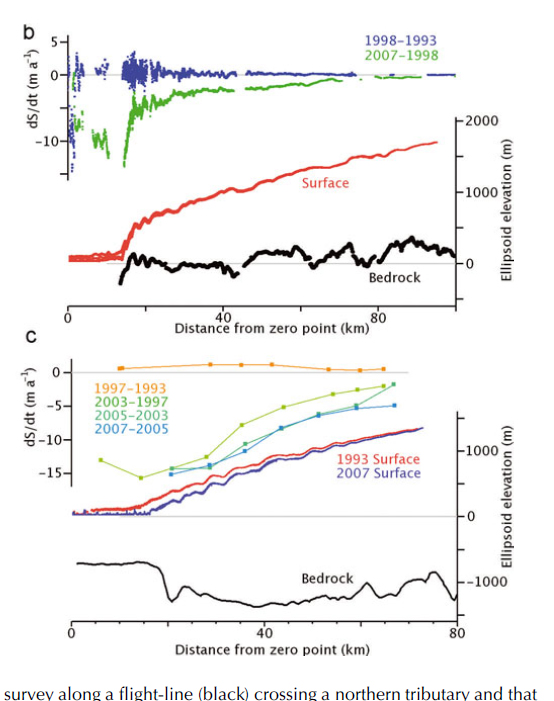
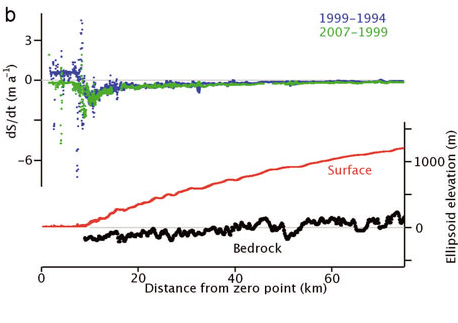
Examination of how far the high velocities extend inland in Figure 2 and 3 indicates that it is only Zachariae and Petermann that tap far into the ice sheet. This northern area has low accumulation rates, and a shorter less intense melt season. The early onset of melting and lack of accumulation in 2010 led to an early exposure of the ablation zone on these glaciers. This is their sensitivity Achilles Heel: relatively little increases in melt can expand the ablation zone appreciably given the low surface slopes and low accumulation rates. Based on the velocity map, it is the Zachariae that is likely the only of this group that would be comparable to a bank that is too big to fail as its increased velocity band extends well into the ice sheet (Joughin et al, 2010).
Figure 1. Velocity of Petermann and Humboldt Glacier, the latter does not have a deep bedrock trough extending to the heart of the GIS.
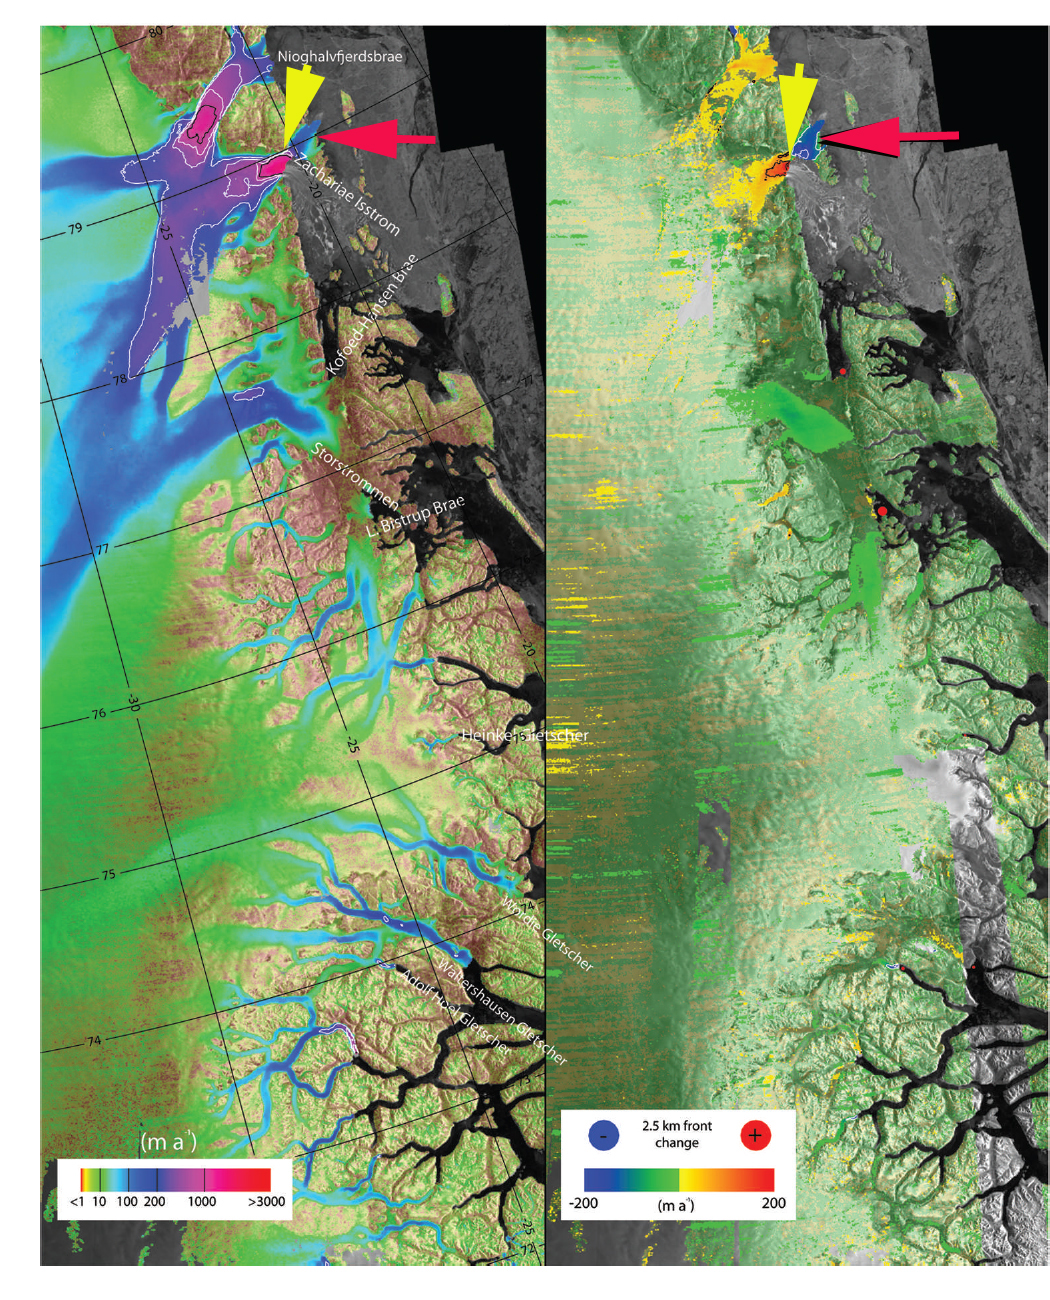
Fig 2. Ice flow speed for Zachariae Glacier (Joughin et al, 2010)
Type 2: Inland-terminating
Glaciers with inland termini lacking any calving (Sukkertoppen, Frederickshaab, Russell, etc). Between the fast flowing marine terminating outlet glaciers, the ice sheet particularly in the southwest quadrant has numerous glaciers that terminate on land or in small lakes. The velocity of these glaciers reaches a maximum of 1-2 meters/day. Each terminates on land because total ablation over the glacier equals total accumulation at the terminus. These glaciers are more like a typical alpine glacier and are susceptible to the forces that tend to cause alpine glaciers to experience peak flow during spring and early summer. Those forces are the delivery of meltwater to the base of the glacier, when a basal conduit system is poorly developed. This leads to high basal water pressure, which enhances sliding. As the conduit system develops the basal water pressure declines as does sliding, even with more water. In the long run it is not clear that more melt will lead to sustained higher velocities as a more efficient drainage system leads to lower basal water pressures. Sundal et al, (2011), best illustrated this.
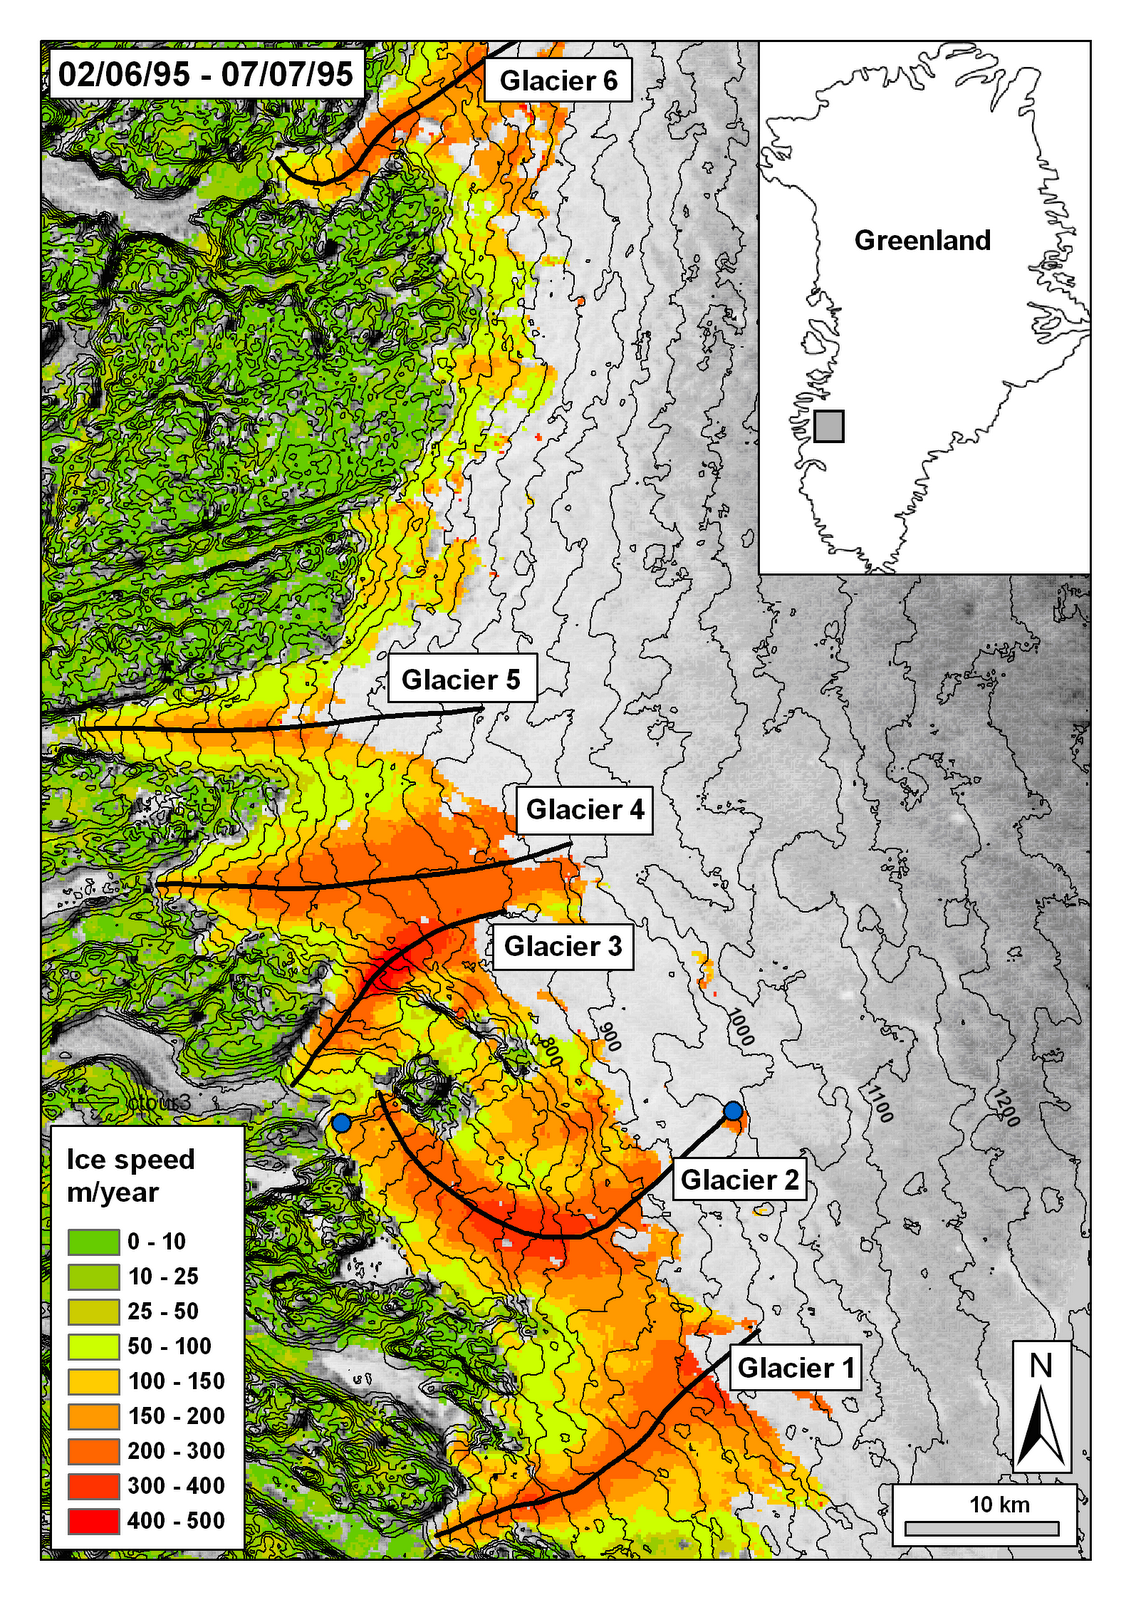
Fig 3. An example of a two-dimensional ice-velocity map of the study area in southwest Greenland Inland terminating glaciers velocities (Sundal et al, 2011).
This is what has been recently reported to be the case by Sundal et al (2011). The meltwater lubrication mechanism is real, but as observed is limited both in time and area impacted. It is likely that, as on alpine glaciers, the seasonal speedup is offset by a greater slowdown late in the melt season. Most observed acceleration due to high meltwater input has been on the order of several weeks, leading to a 10-20% flow increase for that period. The role of supraglacial lakes in this has been a point of emphasis; Luthje et al, (2006) noted that the area covered by supraglacial lakes was independent of the summer melt rate, but controlled by topography. This led Luthje et al (2006) to conclude that the area covered by supraglacial lakes will remain constant even in a warmer climate. This suggests that the enhancement of flow by the drainage of such lakes would be limited.
The land terminating glaciers such as Sukkertoppen, Russell and Mittivakkat are retreating significantly in response to global warming. This is an indication of negative mass balance. The latter glacier in southeast Greenland has retreated 1200 meters since 1931 (Mernild et al, 2011). The Mernild study identified this slow rate compared to the outlet glaciers and, based on mass balance observations, that the current surface mass balance can only support a glacier at most one-third its current size. This indicates the slow but inexorable sensitivity of the non-calving glacier to surface mass balance change. Moon and Joughin (2008) observed that the retreat of the land terminating glaciers was relatively minor from 1992-2007, averaging 5 m/year or less. These glaciers are the equivalent in our banking system to the local banks: there are many and they are sensitive, but the changes in a single one is not important.
Type 3: Marine-terminating
Fast flowing marine terminating outlet glaciers of western and southeast Greenland (Rinks, Umiamako, Helheim, Jakobshavn, Epiq Sermia, etc). These are the glaciers that drain the greatest area of the ice sheet and deliver the greatest volume to the oceans via calving. The flux from many of the larger glaciers is over 10 km3/year (DMI). Each of these glaciers is fast-flowing at the terminus; the fast flow section extends inland into the ice sheet up a sub-glacial trough. The outlet glaciers act like a drain capturing ice from a larger area of the ice sheet than their narrow terminus would suggest.
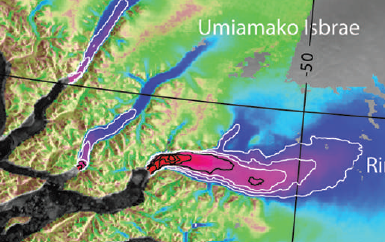
Figure 4. Umiamako Glacier is typical with the highest velocity near the calving front and the high velocity ice stream extending back into the ice sheet.
Figure 5. Jakobshavn Glacier terminus retreat, the recent retreat has been associated with thinning and faster flow.
Pelto et al (1989), a paper on the equilibrium state of the Jakobshavn Glacier, showed that the terminus had not changed significantly in 30 years; its velocity had also been consistent. Furthermore, it was observed that the velocity was consistent throughout the seasons. This indicated that the glacier velocity was not being impacted by the meltwater pulse each summer.
Bob Thomas (NASA, 2004) and Terry Hughes (University of Maine, 1986) developed the basic mechanism of flow for the glacier that has proven to be true. The outlet glaciers have a balance of forces at the calving front. The fjord walls, the fjord base and the water column impede flow. The slope of the glacier, its upglacier velocity and the height of the calving face strive to increase flow. If the glacier thins than there is less friction at the calving front from the fjord walls and the fjord base, leading to greater flow. The enhanced flow leads to retreat and further thinning, resulting in the thinning and the acceleration spreading inland. In 1990 it was not envisioned that acceleration would occur as soon as it has, yet that was the motivation for the research.
Fig 6. Jakobshavn profile (Thomas et al, 2009)
In 2001 acceleration of Helheim, Jakobshavn and Kangerdlussaq Glacier caught the attention of the world. By 2007, acceleration had been noted at all 34 marine terminating outlet glaciers observed.
The acceleration was not significantly seasonal; Howat et al (2010) noted a 15% seasonal component to the acceleration, it had spread inland and had led to retreat and thinning. This demonstrated that the marine terminating glaciers were largely responding to a change in the balance of forces at the glacier front.
Fig 7. Ice flow velocity as color over SAR amplitude imagery of Jakobshavn Isbræ in a) February 1992 b) October 2000. In addition to color, speed is contoured with thin black lines at 1000 m/yr intervals and with thin white lines at 200, 400, 600, and 800 m/yr. Note how the ice front has calved back several kilometers from 1992 to 2000. Further retreat in subsequent years caused the glaciers speed to increase to 12,600 m/yr near the front. (Ian Joughlin, Big Ice)
The recent increases in outlet glacier discharge have always been coincident with partially floating ice tongue losses. This causes reduced back pressure at the glacier front, letting up on the brakes; the resulting glacier thinning leads to less basal friction and further acceleration. If the glacier front retreats into deeper water the process will continue and increase. This is why understanding the basal slope changes inland of the calving fronts is crucial. Moon and Joughin (2008) observed the terminus change of 203 glaciers from 1992-2007 and noted a synchronous ice sheet wide retreat of tidewater outlet glaciers. The thinning could be due to increased surface melt, basal melt or most likely a combination of the two. Certainly the supraglacial lake drainages are not the key as the widespread acceleration in the southeast and southwest Greenland, yet the southeast has less than 10% of the lakes of the southwest , as documented by Selmes et al (2013) in a paper submitted to the Cryosphere.
Moon and Joughin (2008) reported for the 2000-2006 period:In the southeast quadrant 35 glaciers retreated an average of 174 m/year. In the eastern quadrant 21 glacier retreated an average of 106 m/year. In the northwest 64 glaciers retreated an average of 118 m/year. Each quadrant’s retreat increased markedly after 2000. In east central Greenland Walsh et al (2012) noted the retreat of all 37 outlet glaciers examined. Bjork et al (2012) note the terminus change in 134 east Greenland glaciers, idenitifying the last decade as the most rapid for marine terminating glaciers but not land terminating glaciers. The largest of this group are comparable to the banks that are too big for our banking system to allow them to fail: they drain a substantial portion of the entire ice sheet and reach so far into the ice sheet that their behavior can impact that of other adjacent glaciers.
Type 4: Marine-terminating in Shallow Water
Marine terminating glaciers outlet glaciers in shallower water (Humboldt, Cornell, Steenstrup etc). These glaciers do have calving termini, but lack the large fast flowing feeder tongues extending into the glacier. This is because there is not a topographic low under the ice sheet that funnels the flow. Humboldt Glacier is the widest front of any Greenland Glacier, wider even than Petermann Glacier. However, the velocity on average is low at 100 m/year and the base of the glacier is quite high. This makes it difficult for a large calving retreat of the glacier to occur and extend inland. Humboldt Glacier is retreating but as the velocity profile indicates the glacier, despite its size, does not tap dynamically into the center of the ice sheet. These glaciers are substantial, but their failure (though significant for sea level) would not destabilize the ice sheet as a whole. Naarsap Sermia would be another example in southwest Greenland. Dodge and Storm Glacier an example in northwest Greenland.
The amazing aspect of Greenland glaciers is that (despite the specific variation in type, location specific fjord configuration, etc) their response has been as uniform and synchronous to global warming as has been observed. If this warming of the world persists long enough, the ice “banks” of Greenland will begin to fail. Those with the greatest reserves on their asset sheets and the fastest turnover, and thus having the greatest potential contributions to sea level rise over time, are: In the north, Zachariae (and to a lesser extent, Petermann). The fast flowing marine terminating outlet glaciers of western and southeast Greenland (Rinks, Umiamako, Helheim, Jakobshavn, Epiq Sermia and Kangerdlussaq).
The surface mass balance of the glacier is the difference of accumulating snow on the ice sheet (its income) and snow and ice losses from melting and calving (its expenditures). The volume of the ice sheet is its asset. On an ice sheet, the main factor driving flow is simply the mass balance input in the accumulation zone. The higher the accumulation rate the faster the movement; the accumulated snow is inexorably moved downslope towards the ocean and the margin of the ice sheet. Observation of a precipitation map (focused not on the outer margin, but on the accumulation zone of the ice sheet) indicates that highest accumulation rates, over 40 cm per year, extend along the western side of the ice sheet to the southeast quadrant of the ice sheet. The southeast quadrant also has many fewer surface lakes than the southwest quadrant.
Figure 9. Mass balance in Greenland from Van Den Broecke et al, (2009)D denotes change in ice discharge while SMB denotes the net surface mass balance (accumulation minus ablation).)
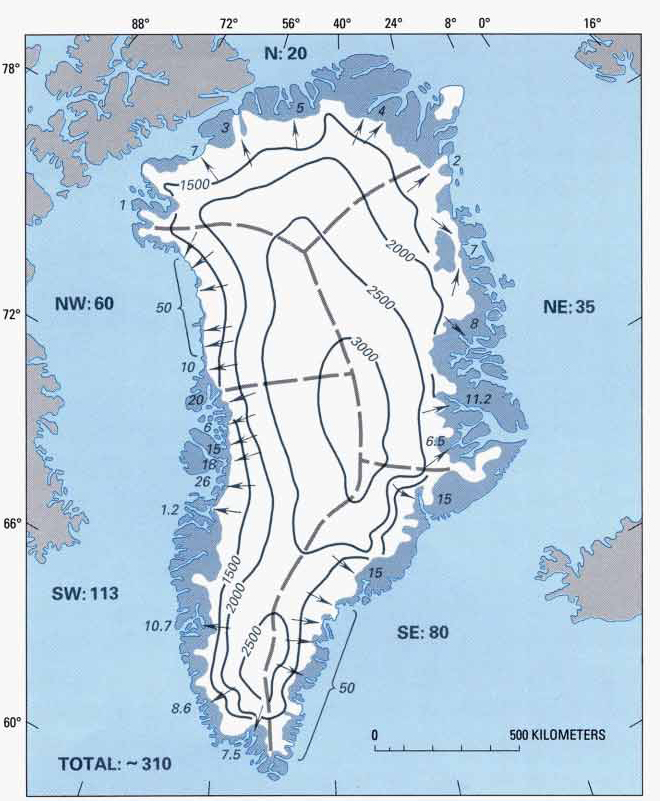
Fig 10. Distribution of precipitation in Greenland (in grams per square centimeter per year). Contours dashed where inferred. Ice-free areas are shown in dark gray. (USGS, Satellite Image Atlas of Greenland)
The overall topography of the ice sheet is controlled both by the basal and peripheral geology and the mass balance distribution of the ice sheet. The higher rates of mass accumulation inland and the greater melting nearer the margin yield a steeper profile for the ice sheet.
Figure 11 shows that the contours have the closest spacing along the west margin and in the southeast, just as the high accumulation rates in those areas would suggest. Thus the combination of the surface slope and the accumulation rate drive faster flow in these regions.
Climate change has led to an observed increase in surface melting, surface accumulation, increased discharge and overall mass balance losses. The very mechanism that establishes the basics of behavior of the GIS mass balance are changing (Zwally et al, 2011). This is leading to most Greenland glaciers retreating, most outlet glaciers accelerating, an increase in the number and elevation of Greenland lake, expanding melt extent on the ice sheet. The 2012 seasons extraordinary ice melt extent is illustrated by the video below of Marco Tedesco’s melt extent data set. .
Qorqup Glacier (Qooqqup) is in southern Greenland near Narsarsuaq. The glacier divides shortly above the terminus into an eastern and western glacier branch. Kuussuup Sermia is a distributary glacier of the Qorqup. Here we examine Landsat imagery from 1993 to 2014 and Google Earth imagery from 2005 and 2013. The eastern branch terminus is indicated by the red arrow.
A series of images from 1993 to 2008 indicate limited terminus change, the red arrow indicates the 1993 terminus position on each image. The main change was the minor retreat on the western side of the terminus between 1993 and 1997, where a 600 m wide and 600 m long area was lost. After 2010 the glacier retreated 750 m by 2014. However, in 2014 it is clear that the lower 3 km of the terminus is disintegrating. The disintegration is evident at the pink arrows, with both rifts and iceberg melange sections evident. The Google Earth imagery from 2005 and 2013 indicate a vast change in the character of this terminus reach. In 2005 the terminus is still at the same location, red arrow. The pink arrows indicate crevassing that indicates rapid glacier flow, there is no significant rifting or melange at that time. By 2013 the glacier has retreated from the red arrow at the 1993-2010 terminus position. More importantly each pink arrow indicates an substantial rift or ice melange. The glacier tongue is no longer in contact with the valley walls in its last two kilometers, three kilometers on the east side. There is also a large rift two kilometers from the ice front, indicating a location where the glacier will separate. This rift does penetrate to the water level. The retreat of this glacier is similar to that of Narssap Sermia and Qaleriq Glacier. The rifting leading to calving is what was observed on Petermann Glacier.
1993 Landsat image
Koge Bugt Glacier is an outlet of the Greenland Ice Sheet on the southeast Coast. The glacier empties into the bay of the same name, and has three main calving fronts. This glacier is the the sweet spot for high snowfall and hence, despite its smaller size is one of the larger outlet glaciers in terms of volume. Koge Bugt Glacier is not an oft mentioned glacier it is not as fast as Helheim or Jakobshavn, does not have as long a calving front as Humboldt Glacier. Does not calve icebergs nearly as large as Petermann Glacier. Does not penetrate into the midst of the ice sheet as far as Zachariae Ice Stream or 79 Glacier. However, according to observations of Enderlin et al (2014), Koge Bugt has the second largest volume flow for the entire ice sheet. They further note that the glacier has had the third greatest volume anomaly since 2000, that is increase in discharge. Murray et al (2010) indicate Koge Bugt had accelerated and thinned in concert with other glaciers in the region. The second image below is Figure 1 from their paper indicating the 27,000 square kilometer drainage area of Koge Bugt.
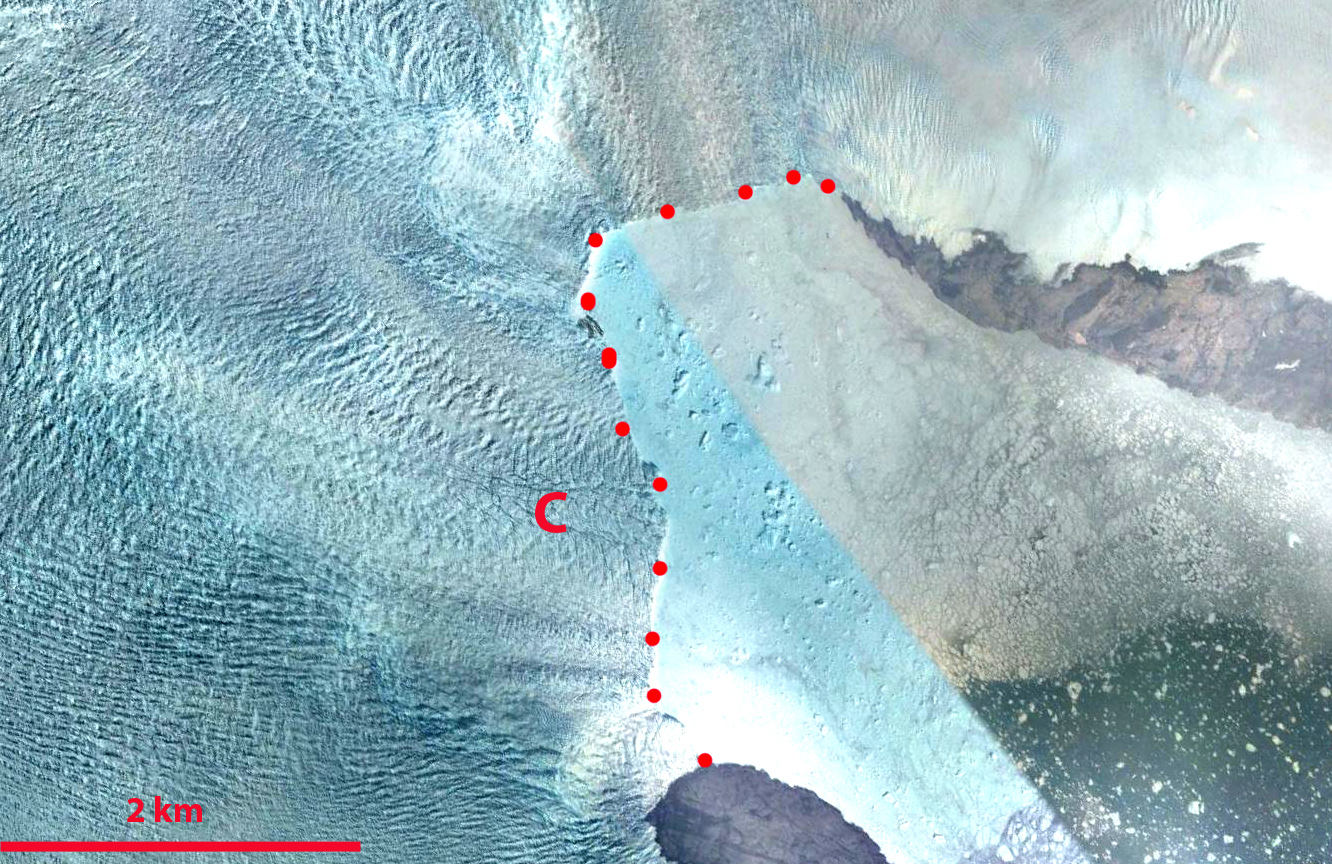
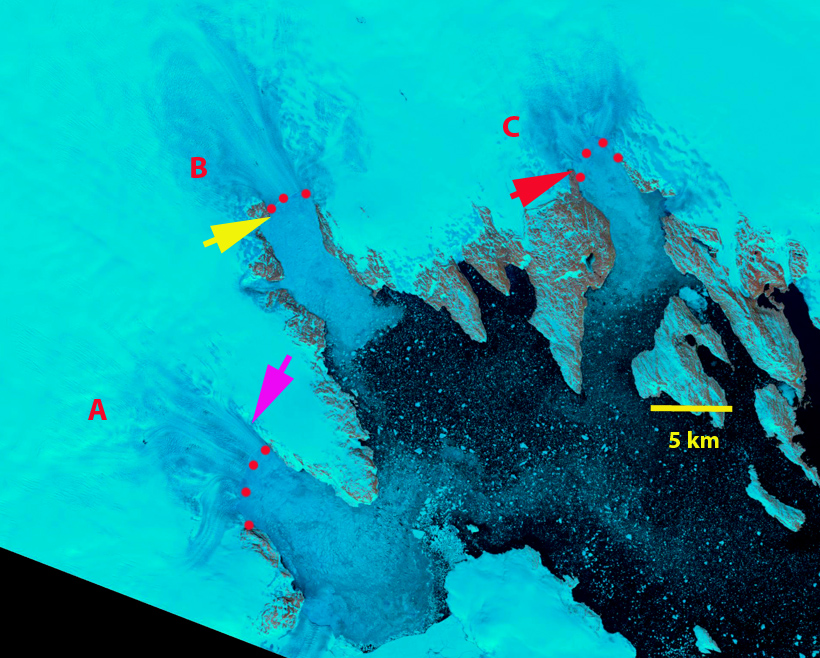
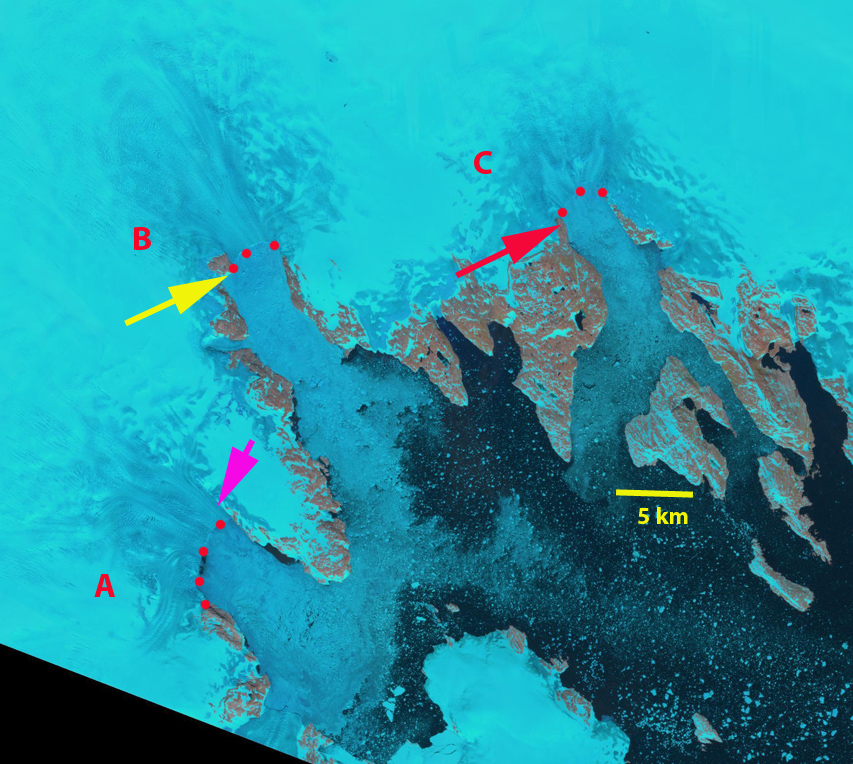
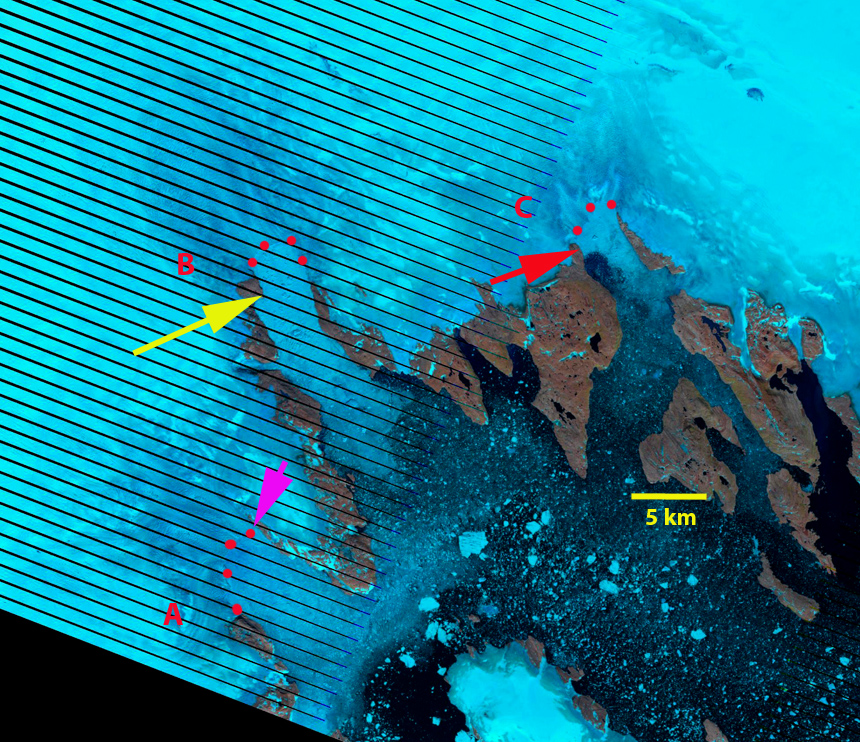
Howat and Eddy (2011) examing 210 outlet glacier in Greenland noted that 191 retreated from 2000-2010 including 89% in SE Greenland. Howat and Eddy (2011) data indicated limited retreat of Koge Bugt Glacier before 2000. From 2000 to 2010 they noted a retreat of 2300 m of outlet C, 1650 m for outlet B and 300 m for outlet A. Each of these outlets has a heavily crevassed active calving front having widths of 5000 m for A, 3500 m for B and 3500 m for C. Outlet B has calved a large iceberg, and there is a substantial rift near the calving front.
Greenland Velocity map with Koge Bugt indicated by red arrow.
Koge Bugt Drainage area from Murray et al (2010)
Below is a sequence of Landsat images from 2001-2013 of the Koge Bugt Glacier three main termini. In each case the red dots indicate the calving front, the purple arrow is at the same spot on the north side of terminus A, the yellow arrow at the same spot on the west side of terminus B and the red arrow at the same spot on the west side of terminus C. From 2001 to 2011 terminus A has retreated little on the south side, but has retreated 1.5 km on the north side. Terminus B has retreated from halfway along the island on the southwest side of the terminus to the north of this island by 2011, a retreat of 2.2 km. Terminus C has retreated beyond the north end of the Peninsula noted by the red arrow, a distance of 600 m. Given the size and velocity of Koge Bugt this is a minor retreat, that can be erased by a year with more limited calving. The melt zone in these July and August images indicates how limited the ablation zone is compared to the west side of the ice sheet, this also limits the occurrence of supraglacial lakes.
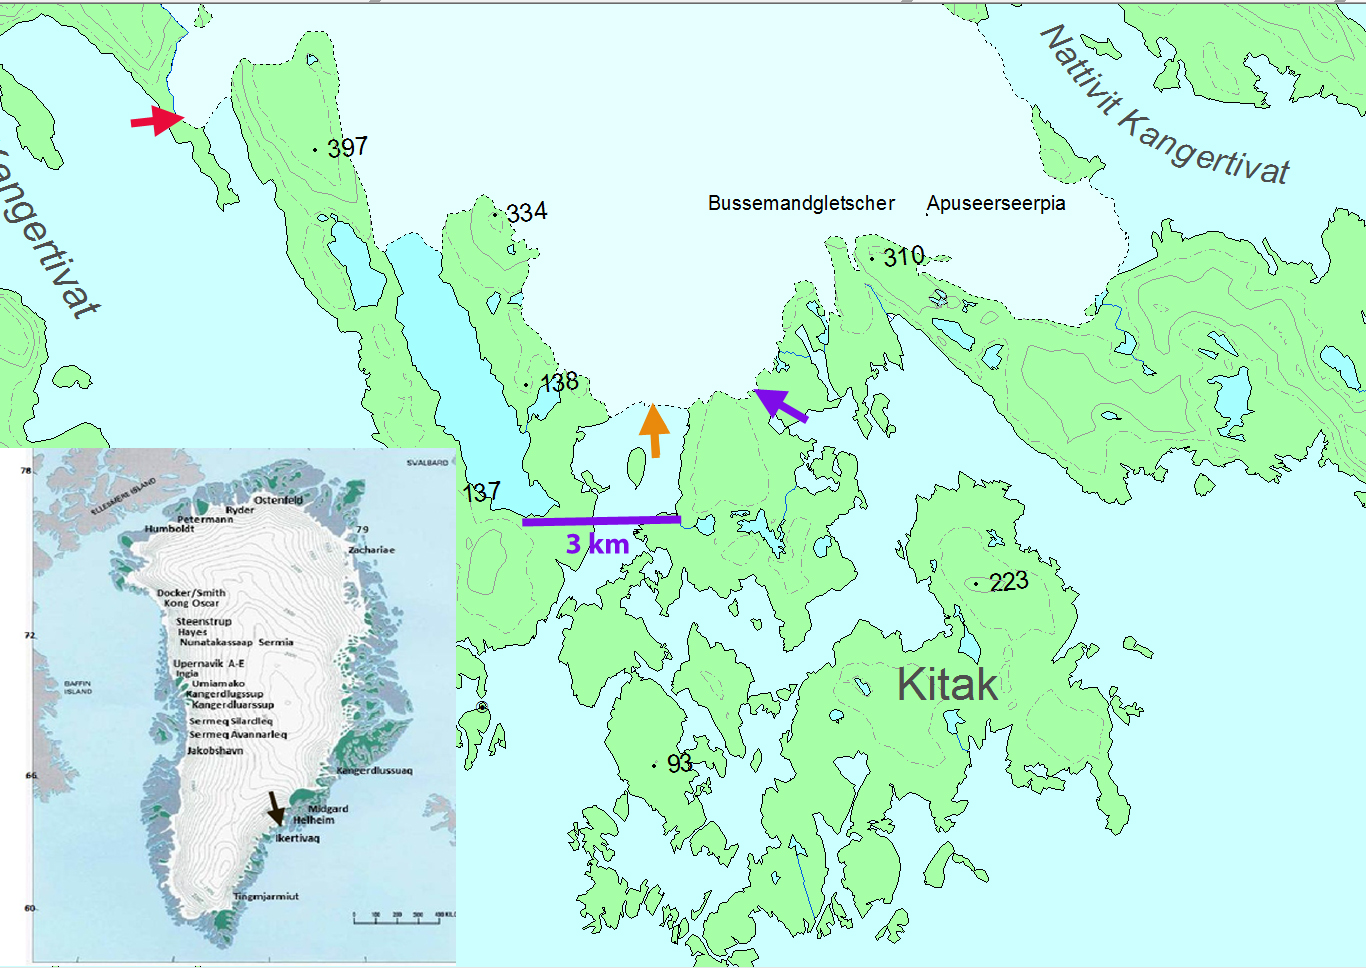
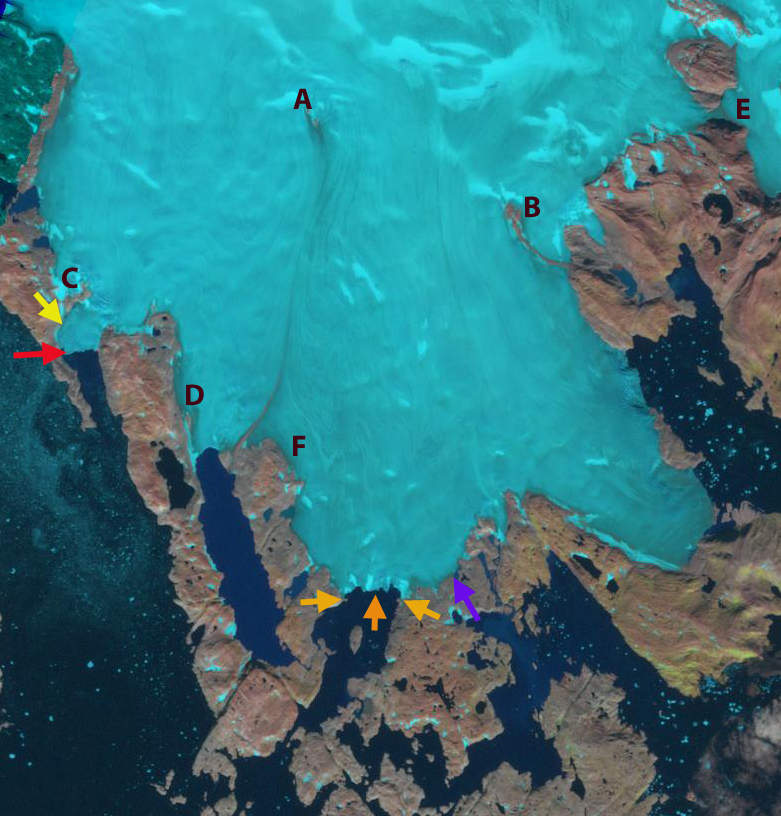
Bussemand Gletscher in East Greenland has a mixed tidewater and land based terminus. This glacier is 50 km west of Tasiilaq and just west of Nattivit Kangertivat Fjord. In this post we compare Landsat imagery from 2000 and 2012 to determine the response of this glacier to recent climate change. Espen Olsen provided the base map below and noted that Bussemand translates to bogey man.. The first two images below are a 2000 and 2012 Landsat image. On these two images the terminus in three locations is noted. The main tidewater terminus at the orange arrows is exposing a new island or peninsula as it retreats. Two orange arrows point to small prominence’s on the side of the inlet that the glacier almost reached in 2000 and has retreated 800 m from on the west side and 400 m on the east side by 2012. At the purple arrow a new proglacial lake has formed and the terminus retreated 400 m from 2000 to 2012. At the secondary tidewater terminus the glacier has retreated 700 m from the red arrow to the yellow arrow. There are also a series of letters A-F at the same location in each image each highlighting changes. Point A denotes the expansion of a nunatak within the ice. Point B indicates the expansion of a nunatak and the lateral moraine extending from the nunatak; Point C is where an area of bedrock at the margin of the western tidewater terminus has doubled in size. Point D was a small outcrop at the edge of the glacier and is now a developing peninsula. Point E was a narrow connection to the neighboring Apuseerseerpia Glacier that is now bedrock. Point F is a location where several new bedrock knobs have emerged at the surface of the glacier. Collectively they indicate the thinning of the glacier across its entire front and several kilometers inland of the front.
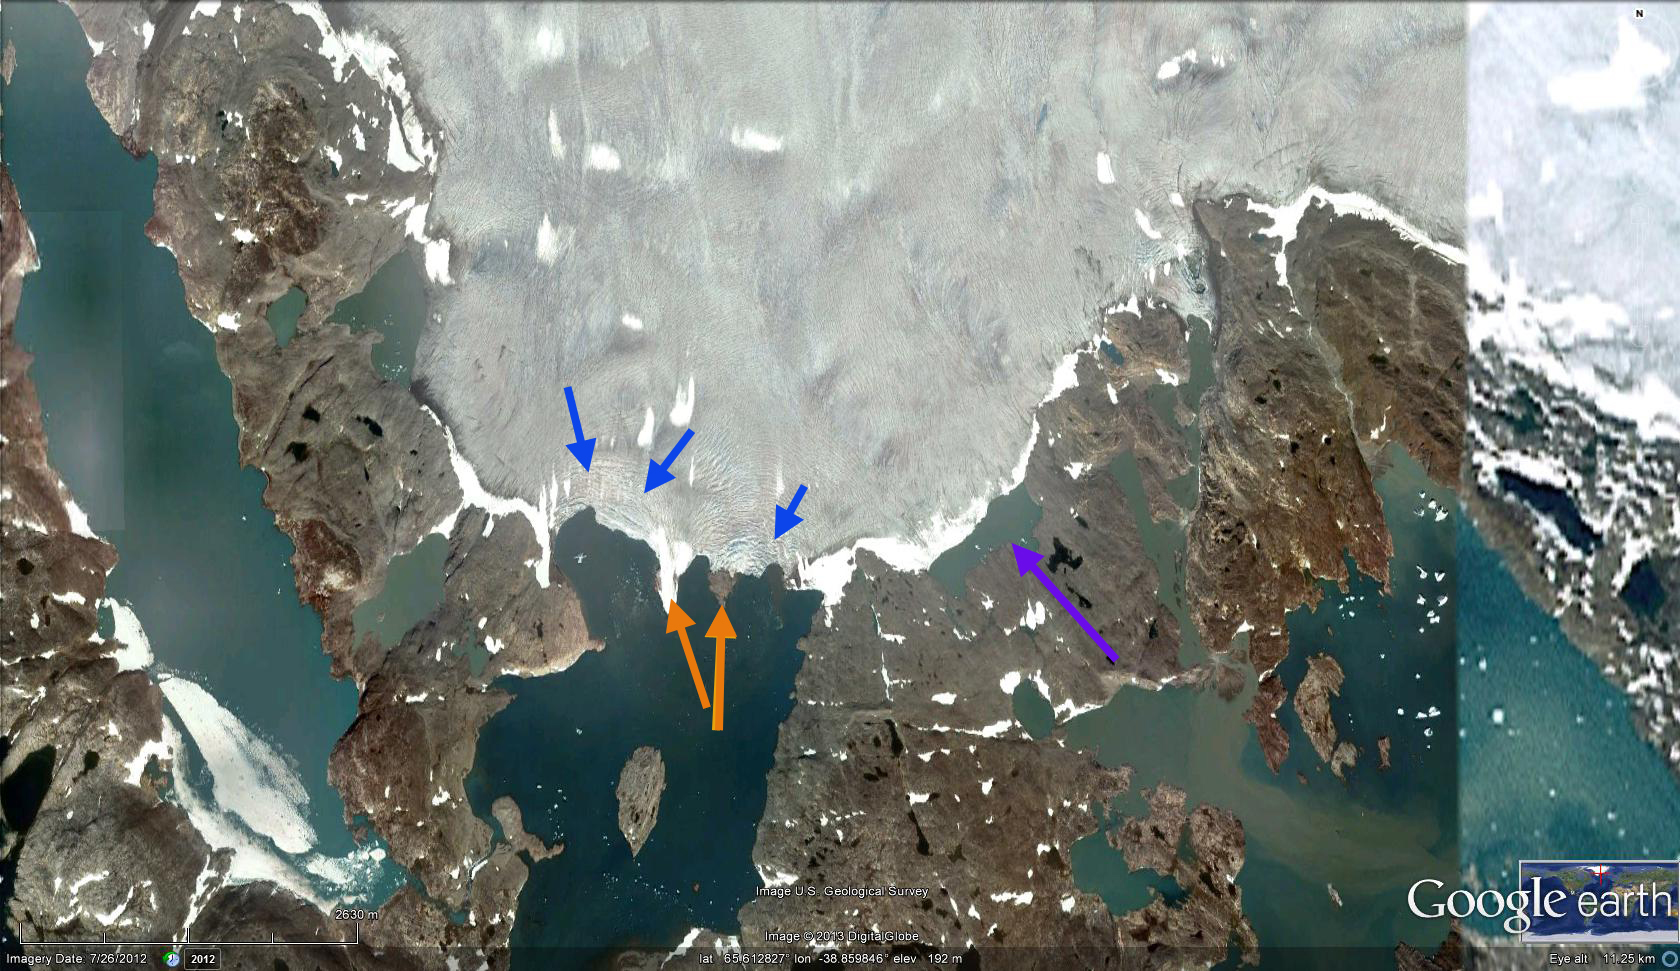
Below is a closeup of the terminus the two active calving embayments are indicated with blue arrows. As these narrow and the water depth drops, calving will be reduced. However, it is not clear that there is not embayment inland of this point where the proglacial lake is developing at the purple arrow. Note the channels for example between Kitak Island and the mainland in the first image. The retreat of this glacier follows that of other glaciers in the region big and small. Mernild et al (2012) noted the widespread retreat of many small glaciers including Mittivakkat. Larger glaciers were detailed by Bjork et al (2012), for example Apuserajik and Thrym.
Epiq Sermia is an outlet glacier of northwest Greenland, 70 km north of Jakobshavn Glacier. Epiq Sermia discharges 2-3% of the ice volume that Jakobshavn discharges. The glacier was observed to have had a small retreat in the first half of the 20th century and a minor advance in the 1960’s. Currently it is undergoing a more rapid retreat. This outlet glacier behaves as other Greenland marine terminating outlet glaciers, thinning at the terminus induced by greater basal and surface melting, triggers thinning which reduces basal friction and allows for acceleration and retreat. The glacier and its neighbor Kangilergnata Sermia have attracted recent research Rignot et al (2010) examined melting beneath the terminus tongue of both glaciers. They found rates of submarine melting 100 times larger than surface melt rates, but comparable to rates of iceberg discharge. Rignot et al (2010-PR) identified melt along the submerged bottom of Kangilergnata and Epiq Sermia where it comes into contact with warm ocean waters, which melts the glacier bottom, thinning the ice, shifting its grounding line, increasing its flotation, which leads to retreat. Figure 1 from Rignot et al (2010) indicates that water depths at the calving front are between 200-300 m deep, not that deep for the ice thickness observed..
A comparison of a 2001 and 2011 Landsat image overlain on Google Earth imagery identifies recent changes. The image comparison indicate average retreat of 1.1 kilometers over the 10 years for Epiq Sermia and 2.5 km for Kangilergnata Sermia, the yellow line is the 2001 margin and red line the 2011 margin. Thinning of Epiq Sermia is also apparent in the retreat upglacier from the terminus with the trimline being exposed and retreat at the secondary terminus into the lake. Retreat of the Epiq Sermia and Kangilergnata Sermia mirror that of other outlet glaciers, Howat and Eddy (2011) found that from 1964-2010 64% were retreating and from 2000-2010 98% of the outlet glaciers in NW Greenland were retreating. The also noted the average retreat rate rose from 20 m/year to 125 m/year, Howat and Eddy (2011). Specific examples of Umiamako Glacier, Upernavik Glacier and Kong Oscar Glacier.
A paper by Mernild and others (2011) focusses on the Mittivakkat Glacier on the east coast of Greenland. The glacier is separate from the Greenland Ice Sheet and its climate response as a result more rapid and more similar to other alpine glaciers. Mernild and others (2011) observe that the glacier has retreated 1300 meters since 1931 and that it has had a considerable negative mass balance since 1995. Sebastian Mernild at the Climate, Ocean, and Sea Ice Modeling Group, Computational Physics and Methods, Los Alamos National Laboratory, Los Alamos, New Mexico has provided the pictures that document the terminus change. The field observations is completed in conjunction with Aarhus University and University of Copenhagen, both in Denmark. Notice the glacier ends just short of the coastline in 1931, but in 2006 is 1500 meters from the coastline. Mittivakkat Glacier has a mass balance record since 1995, that is reported to the World Glacier Monitoring Service. During the 1995-2010 period the glacier’s average balance has been -0.87 meters/year. The cumulative loss is -13 m, with the highest loss being in 2010 at -2.16 m. The 13 m loss in water equivalent snow-ice is equivalent to more than 14 m of ice thickness and 15% of the glaciers entire volume. The problem for the glacier is the loss of essentially all of its snow cover in four of the last ten years, this is not a recipe for long term glacier survival (Pelto, 2010). The image immediately below is a Digital Globe image from July 2005 indicating the snow covered area with six weeks left in the melt season is already limited, the glacier is in the center of the image and is the largest ice mass by far. The middle image from 2006 has areas of firn exposed indicated with blue arrows, this is not the end of the melt season yet. The lower image is from August 26 2010 and is a MODIS image catalogued by the Danish Meteorological Institute.The arrow indicates the glacier which has only 10% snow covered area, with a couple of weeks of melting left in the season. In 2010 air temperatures at Tasiilaq a few kilometers from the glacier were in the range of 1.5 C above average leading to twice the normal melt rate at the terminus, which will generate an even more rapid retreat for 2010 and 2011. The high temperatures in 2010 were not limited to this location as noted by Jason Box of Ohio State. The high melt rates were as a result not limited to the Mittivakkat Glacier as observed by the record melting reported in the Arctic Report Card. The recent large negative balances will generate ongoing retreat. Mernild observes that in 2011 the mass balance was even larger than -2.45 m An image provided by Sebastian Mernild indicates a whole in the glacier near the terminus, indicating rapid retreat in the near future.