Sabbione Glacier, Italy Retreat & Fragmentation

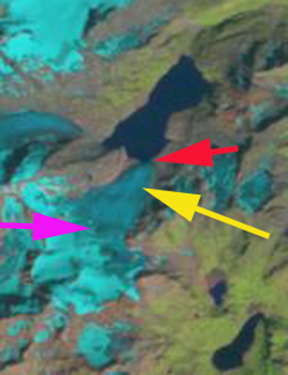
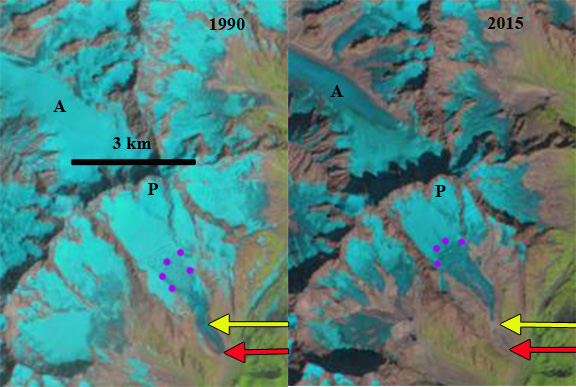
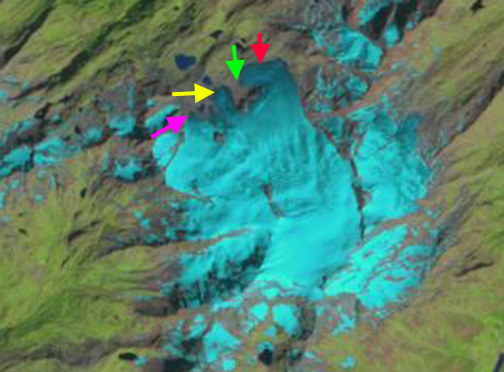
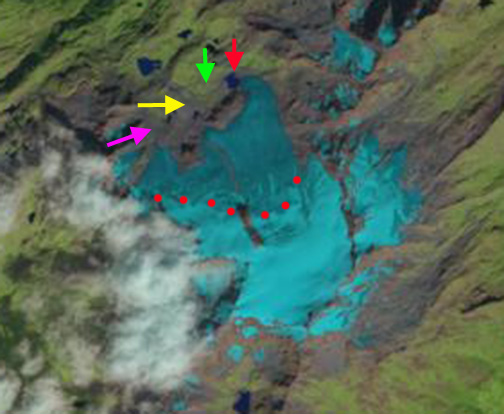
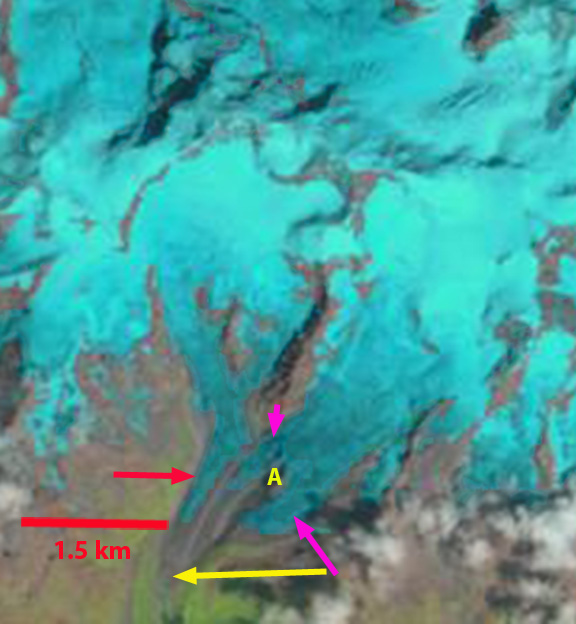
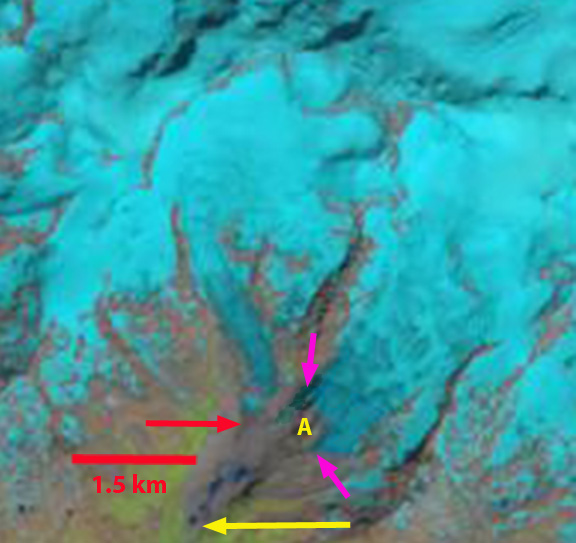
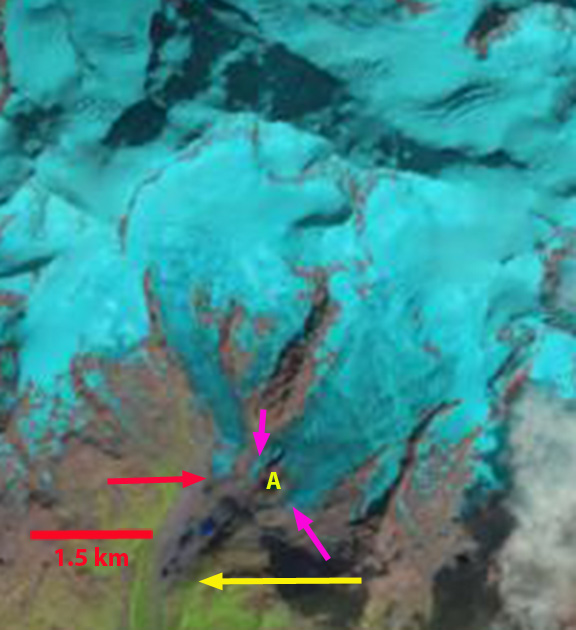
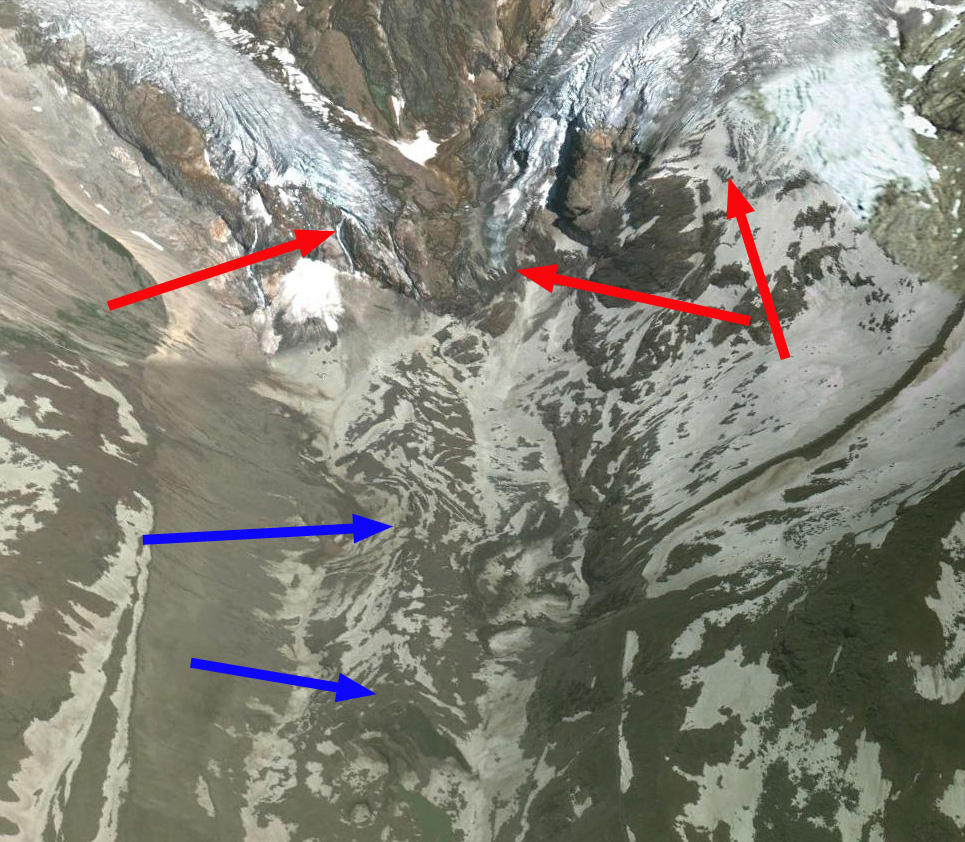
Sabbione Glacier in 1999, 2001 and 2016 Landsat images.  Red arrow is 1999 terminus location, red arrow the 2016 terminus location and the purple area new rock outcrops emerging in the midst of the glacier.

Sabbione Glacier is on the Swiss-Itlaian border.  The glacier drains into Lago Sabbione an artificial lake that in turn drains into Lago Morasco, which is a 29MW hydropower facility. The lake also has good fishing. This glacier in 1988 reached the shore of Lago Sabbione. Today glacier retreat has changed its nature dramatically.  It is not as close to disappearance as nearby Cavagnoli Glacier or Careser Glacier.  Huss and Fischer (2016) indicate that the majority of the small alpine glaciers, less than 0.5 square kilometers will disappear in the next 25 years.
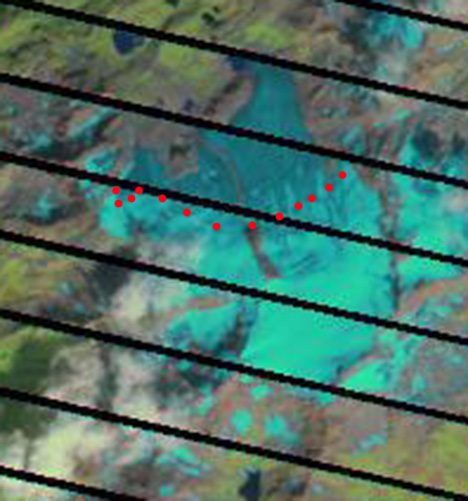
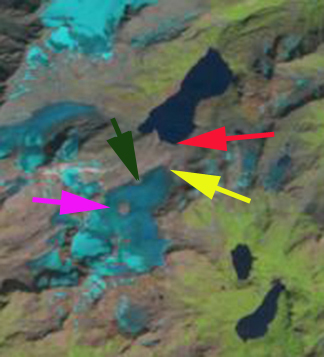
In a series of Landsat images from 1999, 2001 and 2016 and a picture from Lago Sabbione in 2007, the retreat from the lake is evident. The 1988 terminus in an image below is indicated by a red arrow, the 2010 terminus by a yellow arrow, the new outcrop in the midst of the glacier by a magenta arrow. The retreat from 1988 to 1999 is 240 m, there is no rock outcrops emerging in 1999 or 2001. The glacier is 2.5 km long beginning at 3200 m and terminating at 2550 m in 1999. By 2007 image below the rock outcrop has become apparent. By 2016 the glacier has retreated 950 m from the lake and 700 m since 1999 and is now less than 2 km long.  The outcrop in the glacier center is 200 m wide. Of greater concern for the future of the glacier than retreat is the emergence of rock outcrops in the midst of the middle portion of the glacier, and smaller ones on the upper glacier. In 2016 the glacier only has 15% snow cover in this late August image, much less than the 50-60% needed for equilibrium balance. This indicates a glacier that is not in equilibrium lacks a persistent accumulation zone, indicating it will not survive current climate  (Pelto, 2010). In the most recent survey published by the Italian Glacier Commission indicates all glaciers in this region of Italy retreated in 2015.

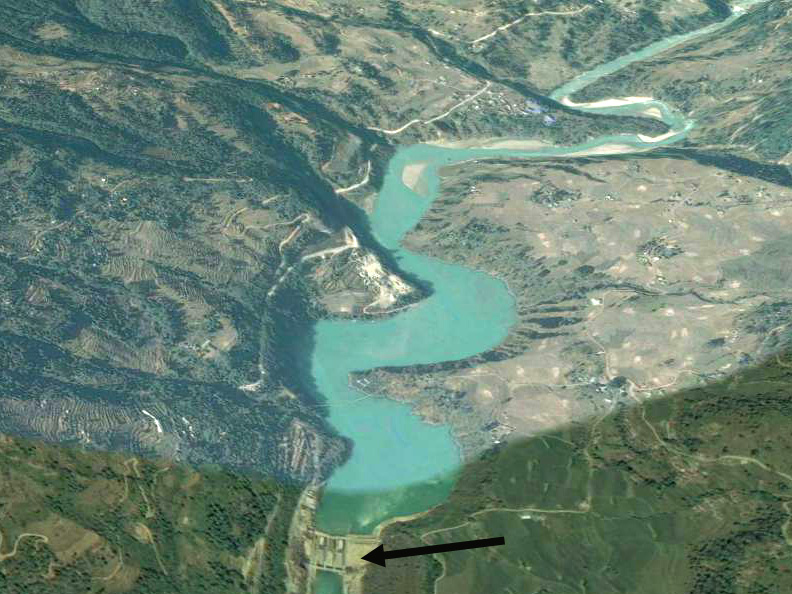
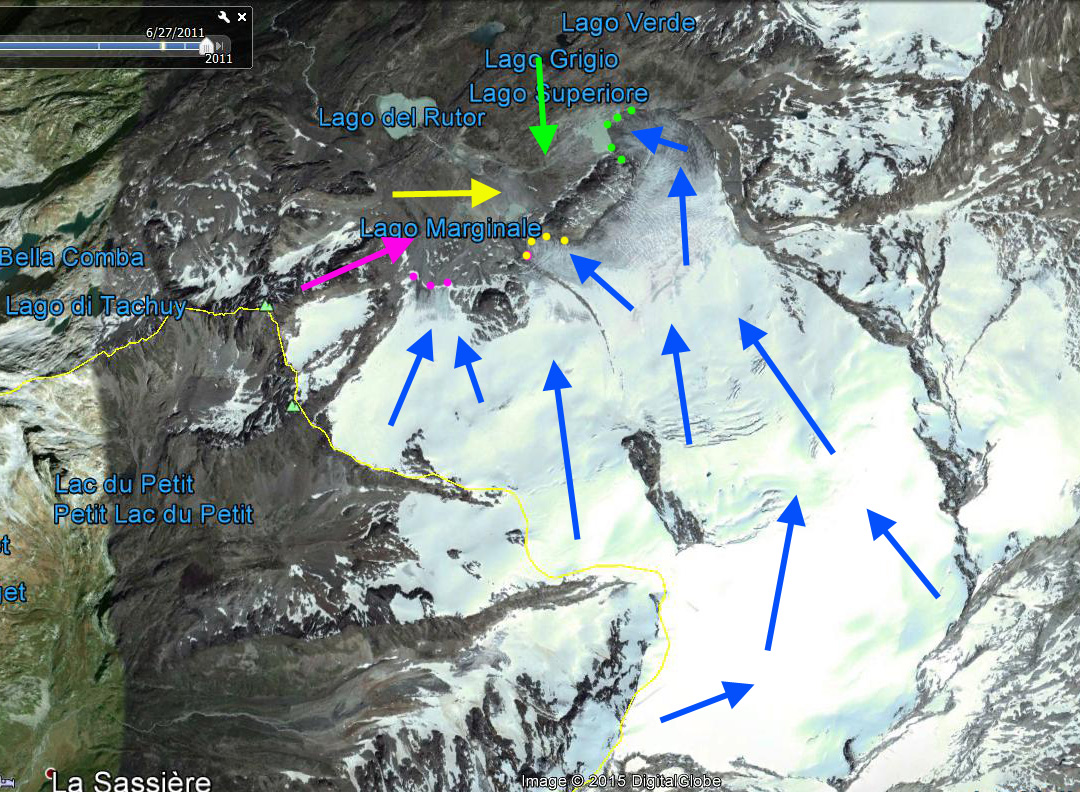
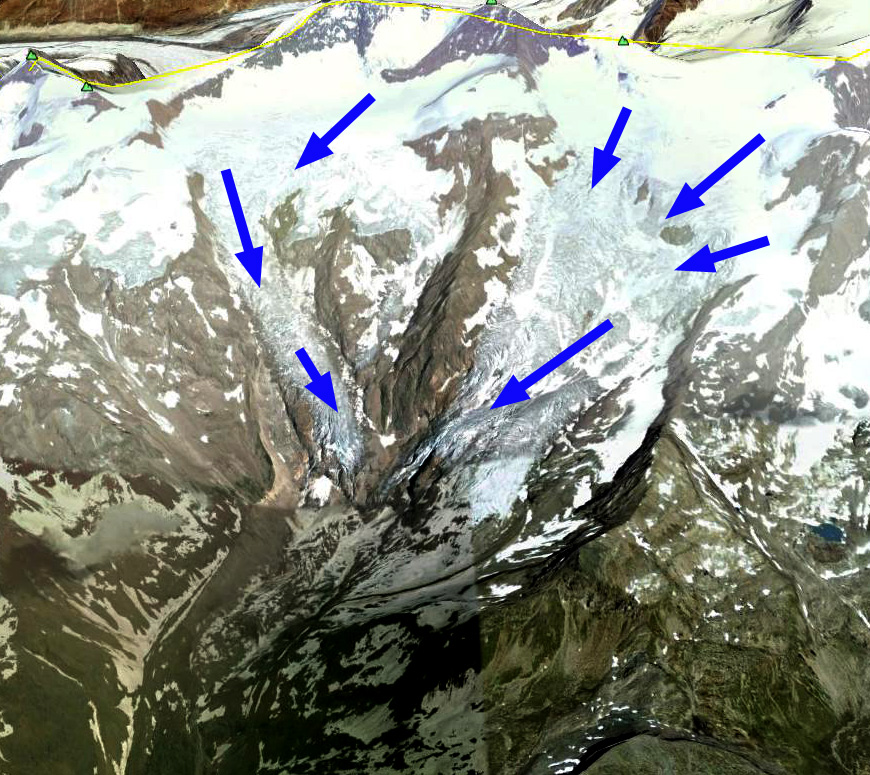
Google Earth image of Sabbione Glacier and Lago Sabbione.


1988 Landsat image of Sabbione Glacier

Thulagi Glacier, Nepal Retreat and GLOF Potential


thulagi-compare

Thulagi Glacier change in Landsat images from 1991 and 2016.  Red arrow is 1991 terminus, yellow arrow 2016 terminus and purple arrow increasingly exposed bedrock rib amidst icefall.

Written With Prajjwal Panday: @prajjwalpanday

Thulagi Glacier terminates in a lake referred to both as Thulagi and Dona Lake. ICIMOD (2011) has identified this as a potential threat for a glacier lake outburst flood (GLOF) and has conducted extensive fieldwork there.  Thulagi Lake is southwest of Mt..Manaslu in western Nepal at an altitude of 4,044 masl. Here we report on the identified threat and use Landsat imagery to identify changes in the glacier. Thulagi Lake has attracted much attention because two hydropower projects have been developed downstream on the Marsyangdi river basin, Marsyangdi Hydropower Project (69MW) and the Middle Marsyangdi Hydropower Project (70MW). Thulagi Lake began to form about 50 years ago and ICIMOD present field investigations showed that from 1995 to 2009, the length of Thulagi Lake had increased from 1.97 to 2.54 km, due to retreat and the lake area increased from 0.76 to 0.94 sq.km. ICIMOD (2011) did a bathymetric survey of Thulagi Lake using an inflatable boat. The volume was calculated to be 35.3 million cu.m in 2009 an increase from 31.75 million cu.m in 1995. The small increase despite significant area increase was because of a surface elevation lowering rate from 2003-2009  of 0.3 to 0.5 m/yr. They found the moraine walls were sinking, but more slowly at a rate of about 0.1 m/yr:  The glacier experienced substantial retreat of 1.65 km from 1958 to 1995.

From 1991 to 2016 the glacier has retreated 750 m a rate of 30 m/year.  The debris cover extends from the terminus 4.25 km upglacier  to 4500 m.  The low slope indicates the lake will continue to expand and the rate retreat should remain high. The bedrock rib is in the icefall that extends from 5600 m to 4600 m, purple arrow. The rock rib at 5000 m in the midst of the icefall is more exposed in Landsat images from 2012 to present than from 1988-2001.  This suggests some thinning.  All images indicate snowcover is persistent above 5800 m. The glacier terminus continues to calve into the lake as seen in the 2012 Google Earth Image, the 40 m high ice front calves only small icebergs that ICIMOD did not deem sufficiently large to trigger a GLOF event by the surge waves. They also noted that temporary blockage of the lake outlet by river ice, snow barriers, or lake ice debris, appears unlike.

Khanal et al (2015) examined the total value at risk under the modeled GLOF scenario of US $406.73 million for Thulagi. The estimated maximum flow was 4736 m3 /second for Thulagi. The majority of this potential damage was to the two hydropower projects.  They noted 125 buildings and  100 acres of irrigated land at risk. A group of Nepali and US scientists carried out stability assessment of Thulagi Lake and its moraine after the April 2015 7.8 magnitude earthquake (USAID, 2015). They noted that the main moraine complex at the end of the lake is relatively stable (black arrow), while the end moraine is less stable (purple arrow). The earthquake caused some slumping of the outlet at the terminal moraine and some deterioration of this moraine. Overall the hazard due to the declining water level would offset some or all of this moraine deterioration in terms of overall risk of a GLOF. Although local people are aware of the deteriorating nature of the terminal moraine at Thulagi, community discussions revealed less concern regarding the possibility of an outburst flood (USAID 2015). However, there is a demand for risk reduction activities such as installation of early warning systems, lowering of lake levels, and development of community-based disaster response plans. There is a general consensus for a science-base community driven approach to address and find solutions for these types of lakes where communities and stakeholders participate starting from research to action.

The retreat of Thulagi Glacier is similar but less rapid than many Himalayan glaciers terminating in lakes; Thong Wuk, West Barun, Lumding and Lhonak

middle-marsyangdi

Middle Marsyangdi Hydropower Station and reservoir in Google Earth

marsyandi

Marsyangdi Hydropower Station and reservoir in Google Earth

thulagi-outlet-copy

Thulagi Lake outlet.  Black arrow points to main moraine complex.  Purple arrow to the less stable terminal moraine.

thulagi-ge

Thulagi Lake in 2012 Google Earth image.  Yellow arrow is recently calved ice and purple arrow indicates bedrock within icefall.

Vallelunga and Barbadorso Glacier Retreat, South Tyrol Italy

vallelunga compare

Vallelunga (above) and Barbadorso di Dentro Glacier (below) retreat from 2003 (orange line) to 2015 yellow dots.  Blue arrows indicate flow path and pink arrow the junction of main two tributaries of Vallelunga Glacier.

Vallelunga Glacier and Barbadorso di Dentro Glacier are at the headwaters of the Vallelunga watershed which feeds the Reschensee.  Reschensee is a reservoir famous for the church tower that emerges above its surface.  This artificial lake was completed after World War II and is the reservoir for the 105 MW Glurns Hydroproject owned by Seledison.  These two glaciers are examined as part of the annual campaign of the Italian Glacier Committee.  The annual reports for 2011-2013 indicate a retreat of 78 m for Vallelunga and 60 m for Barbadorso.  Here we examine Google Earth images from 2003 and 2015 to indicate the change in a twelve year period.

In 2003 Vallelunga Glacier terminus was at an altitude of 2500 m.  The glacier is comprised of two tributaries that join at the pink arrow. The orange line is the 2003 terminus location. By 2015 the smaller western tributary has nearly separated from the main glacier.  the terminus has retreated 460 m in the 12 year period. Barbadorso Glacier terminated at 2690 m in 2003.  By 2015 the terminus has retreated 250 m and terminates 100 m higher in elevation at nearly 2700 m. On July 31, 2015 the snowline on the two glaciers is at 3100-3200 m with 6-8 weeks left in the melt season.  This indicates another year of negative mass balance that will continue to drive retreat.

These glaciers are just across the border from Gespatcherferner one of the fastest retreating Austrian Glacier’s in recent years. Carturan et al (2016) examining long term Italian glacier mass balance series note the 2004-2013 period as particularly negative.  They further observe that this is mainly due to increased ablation and that annual balance is becoming more closely correlated with accumulation season (October-May) temperature suggesting warmer winters extending melt season and leading to an increased ratio of winter rain events. The continued reduction in glacier area reduces late summer water flow to the reservoir, which will either cause reduced power output or the need for more storage early in summer (Pelto, 2014).

reschensee ge

Vallelunga watershed feeding Reschensee (R).  Vallelunga Glacier (V) and Barbadorso Glacier (B).

vallelunga 2015 tsl

July 31, 2015 Landsat indicating a high snowline, purple dots, with nearly half the summer to go. 


Pré de Bar Glacier Retreat, Italy

pre de bar compare

Landsat image comparison from 1990 and 2015 of the Pré de Bar Glacier (P).  The adjacent Argentiere Glacier (A) is shown, the red arrow is the 1990 terminus, the yellow arrow the 2015 terminus and the purple dots the snowline. Retreat from 1990 to 2015 was 

Pré de Bar Glacier is a glacier on the east side of Aiguille de Triolet and south side of Mont Dolent. This is a steep valley glacier that experienced a large retreat during the first half of the 20th century, then advanced from the 1960’s-1980’s, before beginning a retreat again in 1990, that has continued to 2015. In the Landsat images above the 1990 terminus extended approximately 600 m beyond the base of an icefall, forming a substantial low slope terminus lobe.  By 2015 this lobe below the icefall had disappeared and the terminus is now at the base of the icefall, with a net retreat of 550 m since 1990.  With the retreat increasing during each five year increment according to WGMS from 1990-2010 and image analysis here from 2011-2015. The retreat is measured each year by the Italian Glacier Committee  and reported to WGMS.  The New Italian Glacier Inventory that has just been released has reports on each region of glaciers in Italy. For the Glaciers of Aosta Valley it is observed that there are 192 glaciers about 21% of Italy’s total, covering 133.7 square kilometers, 24% less than a half-century ago. This amazing inventory was completed by the Earth Science Department of the University of Milan’s Glaciology staff, led by Claudio Smiraglia and Guglielmina Diolaiuti. On page 91 of the Aosta Chapter is a series of images of Pré de Bar from 1897, 1993 and 2012. The main change from 1993 to 2012 is the loss of the terminus lobe below the narrow icefall.

pre de bar historic

Figure from the New Italian Glacier Inventory of Pré de Bar Glacier in 1897, 1993 and 2012

Berthier et al (2014) mapped ice thickness changes in this region from 2003 to 2012 using the Pléiades satellites. They identify a negative Mont Blanc region wide mass balance of glaciers of -1.04 m/year for the 2003-2012 period.  On Pré de Bar Glacier their figure below indicates at least 5 m thinning across nearly the entire glacier, with more than 25 m of thinning in the terminus region below the icefall.  This dramatic thinning largely driven by increasing summer melting. Bonnano et al (2012) identified a long term retreat rate of 3 m per year for the glacier.  However, retreat from 1990 to 2015 is 22 m/year, the WGMS indicates retreat of 404 m from 1990-2010, a rate of 20 m/year.  The rate of retreat incireased from 16 m/year in the 1990’s to 24 m/year in the 2000’s.  The thinning identified by Berthier et al (2014) up to 2012 high on the glacier suggests this will continue.  Note in the image below  from Bonnano et al., (2012) of Pré de Bar Glacier the amount of firn exposed above the ELA particularly on the two easternmost feeders, and the 2015 Landsat image indicates the annual ELA is closer to the end of the black arrows in that image than the red line from 2000.  The pattern of thinning is similar to that of nearby Lex Blanche Glacier, and Glacier d’Argentiere, but Mer de Glace has a much larger relatively low slope ablation zone section with high thinning.

The meltwater runoff from this glacier feeds the Dora Baltea River and eventually the Po River.  The Aosta Valle region hosts extensive hydropower along this drainage including the Avise, Champagne,Nus, Montjovet, Isollaz, Chatillon, Verras, Hone and Ivrea.

mont blanc thinning

Figure from Berthier et al (2014) indicating thinning of Mont Blanc Glacier 2003-2012, Pre de Bar Glacier noted with blue arrow.

Pre-de-Bar
Pre de Bar Glacier in 2000 showing the ablation zone, accumulation zone, ELA, glacier front this is from Bonnano et al (2012)


Lex Blanche Glacier Recession, Mont Blanc Massif, Italy

lex blanche compare

Lex Blanche Glacier (Lb) comparison in a 1990 and 2015 Landsat image.  Red arrow indicates 1990 terminus, yellow arrow the 2015 terminus and the purple arrow a separated tributary. Debris covered Miage Glacier (M) is adjacent. 

Lex Blanche Glacier descends from 3500 m on the southeast flank the Aiguille de Glaciers of the Mont Blanc Massif into the Vale Veny of Italy. The glacier is adjacent to Miage Glacier (M). The glacier advanced over 700 m from 1970 to 1990. In 1990 the glacier extended to the base of a steep slope and turned north to terminate at 1980 m. By 2001 the glacier has retreated up a steep slope to near where the 1970’s advance had begun.  By 2009 and 2011 further retreat has left the terminus just above a particularly steep bedrock slope.  By 2015 the glacier has retreated 1100 m and terminates at 2450 m remaining on a relatively steep slope. The glacier is heavily crevassed a short distance above the terminus suggesting the period of rapid retreat should be ending. A tributary from the north has detached from the main glacier at the purple arrow. In recent warm summers the glacier has retained snowcover above 3150 m.  The mass balance noted in Figure 8  (see below) of a paper by Berthier et al (2014) indicates the thinning is glacier wide but most prominent on glacier tongue.  Berthier et al (2014) used  the Pléiades satellites to identify a negative region wide mass balances of glaciers in the Mont-Blanc area of -1.04 m/year for the 2003-2012 period. The meltwater runoff from this glacier feeds the Dora Baltea River and then the Po River.  Both rivers feature extensive hydropower including the Champagne and Nus hydropower plant on the Dora Baltea  that produce 41 MW.  The retreat of this glacier mirrors that of other glaciers of Mont Blanc including Taconnaz, Bionnassay, Mer de Glace and Tour Glacier.

berthier mass balance lex blanche

Figure 8 from Berthier et al (2014) on glacier wide mass change with thinning in browns, and darker browns greater thinning.

lex blanche 2001

Google Earth image from 2001 indicating the 1990 terminus at red arrow and 2001 terminus at yellow arrow.

lex blanche 2009

Google Earth image from 2009 indicating the 1990 terminus at red arrow and 2009 terminus at yellow arrow.

lex blanche 2011

Google Earth image from 2011 indicating the 1990 terminus at red arrow and 2011 terminus at yellow arrow.  Blue arrow indicates the lowest heavily crevassed region.


Rutor Glacier, Italy Retreat and Rising Snowline

The Rutor (Ruitor) Glacier is one of the 10 largest in Italy and is on the France-Italy border draining into the Aosta River valley.  The glacier has three termini with the main terminus being the eastern one. The position of the glacier snout has been surveyed though not every year by the Italian Glaciological Committee since 1900. The glacier has a long series of terminus and volume observations compiled by Villa et al (2007) at the University of Milano-Bicocca, that indicate a 27% loss in area from the LIA maximum in the mid 19th century to 1975.  The glacier than increased slightly (1%) to 1988, followed by a loss of 5% from 1988 to 2004 (Villa et al, 2007). They further observe that the equilibrium line altitude (height of snowline at end of summer) was 2775 m during the Little Ice Age and 2850 m during the 1975-1992 period. Here we examine landsat imagery from 1988 to 2014 to identify the current trend in both ELA and terminus change.
ruitor ge 2011
Google Earth image indicating the three terminus of the Rutor glacier, arrows indicate 1988 terminus position, dots the 2011 terminus position of each.

In 1988 the eastern terminus, green arrow, had expanded slightly occupying the same location as it had in 1975, this left a trimline do the lack of retreat from 1975 to 1991, the area down valley had been deglaciated an additional 20 years. All three termini descended below 2600 m in 1988. The eastern and central terminus (yellow arrow) were separated by only 400 m. There was a small nunatak shortly above the terminus between the central and western (pink arrow) terminus. By 2014 a lake, red arrow, has formed due to retreat of the eastern terminus. The retreat is 500 m. Additionally between the eastern and central terminus the glacier margin has pulled back from a series of bedrock knobs. The central terminus, yellow arrow, has receded 400 m, and no longer reaches the lower slope foreland below 2650 m. The nunatak between the central and western terminus is now a substantial bedrock knob beyond the glacier margin. the western terminus has receded the least 300 m, but this is a greater percentage of the full length of the glacier feeding this terminus. Further there is negligible retained snowpack in 2014. The 2011 Google Earth image has stagnant areas evident at the terminus, red arrows, that lack of crevassing or other features of movement.

The snowline in 2014, red dots, extends east and west from a prominent rib, and is at 3000-3050 m. In 2011  the snowline is at 3050 m-3100 m and in 2013 the snowline is at 2950-3000 m.  The average snowline of the last four years is 150 -200 m higher than during the 1975-1991 period and 250 m higher than during the LIA.  This is substantial and will drive further continued rapid retreat.  This is the same climate that is driving retreat throughout the Alps from Verra Grande Glacier to Sabbione Glacier to Presena Glacier, that needed a blanket.

rutor Glacier 1988
1988 Landsat image
rutor Glacier 2014
2014 Landsat image
ruitor terminus
Google Earth image of new lake formed and retreat of eastern terminus
rutor 2011
2011 Landsat image

rutor 2013
2013 Landsat image

Lys Glacier Rapid Retreat, Italy

Lys Glacier drains south from Lyskamm in the Monta Rosa Group of Italy.  This glacier has a long history of observations that have indicated two short term advances in the 20th century 1912-21 and 1973-85 amidst a broader retreat.  The net change for the 1915-2004 interval was a 600 meter retreat (Smiraglia et al, 2006). They also noted a 10% area extent loss from 1975-2003, and since the glacier was advancing up to 1985 this change occurred more rapidly.  The Italian Glacier Commission report on terminus change of this glacier annually in the two latest reports Lys Glacier retreated 10 m in 2012 and 20 m in 2011. The total reported retreat from 2005-2012 was 186 m, more than 20 m per year. Here we examine Landsat images from 1990 to 2014.

lys ge

Google Earth Image

In 1990 two branches of the glacier merged in the valley bottom and extended to the red arrow marking the terminus of the glacier at that time.  The yellow arrow indicates the 2014 terminus position, and the yellow A indicates a prominent bedrock knob that a branch of the glacier encircles, pink arrows.  By 2013 the glacier in the main valley have separated, there are a few small lakes forming amidst the decaying stagnant ice tongue between the yellow and red arrow.  The bedrock knob at Point A has greatly expanded. In 2014 none of the termini reach the floor of the main valley.  As the stagnant ice melts, the lake area is expanding indicating that a new alpine lake will likely form.  The retreat from 1990-2014 is 1300 meters.  A closeup in 2009 from Google Earth indicates the two tongues with bedrock below separating them from the main valley floor, red arrows. There is still some relict ice below on the valley floor detached from the active glacier, blue arrows, that has small lake developing amid the stagnant ice. There is substantial crevassing above both actual termini, but not immediately. The retreat should slow now that the glacier has retreated onto steeper slopes, having lost the low elevation low slope valley tongue.
The retreat of this glacier is similar to that of nearby Verra Grande Glacier. lys glacier 1990
1990 landsat image
lys glacier 2013
2013 Landsat image
lys glacier 2014
2014 Landsat Image
lys glacier terminus
Google Earth Image

Lobbia Glacier Retreat, Italy and World War I relic exposure

The summer of 2012 was a warm one in the Italian Alps. This has led to large losses in glacier volume and exceptional surface melting. One example of this has been the exposure via melting of a considerable amount of World War I relics. One location noted has been the Ago Di Nardis Glacier in the Trentino Mountains, where artillery ammunition is observed Image from Maffei Glauco / Trentino Italian / EPA. In this post we use Landsat imagery from 1999, 2011 and 2012 to examine the retreat of Lobbia Glacier with a small note on the retraction of Ago Di Nardis Glacier. The Lobbia Glacier is adjacent to the Mandrone Glacier that has been examined in detail by the Università di Brescia, Italy (Ranzi et al, 2010), which lost over a meter of ice thickness on average from 1999-2006. The Lobbia Glacier retreat from 1999-2010 has been observed by the Italian Glaciological Survey and found to have retreated 140 meters from 1999-2005, and 45 m from 2006-2009. In the Landsat images the red arrow indicates the retraction in glacier width of Ago Di Nardis Glacier at the 3000 meter level. The Orange dot indicates the 1999 terminus location of Lobbia Glacier. The yellow arrow indicates the expansion of a bare rock area that had been surrounded by ice in 1999 on Lobbia Glacier. The purple arrow indicates the separation of horseshoe shape glacier adjacent to Lobbia Glacier.. The glacier has a low slope and few crevasses. The combination indicates low velocity and even stagnant conditions. The slopes on the west side of the glacier, yellow arrow are not retaining snowcover and no longer feed the glacier tongue. The lack of a consistent and persistent snowcover indicates a glacier that cannot survive (Pelto, 2010), image from TecTask. The current glacier health parallels that of Dosde Glacierand Presena Glacier

Careser Glacier Breaking Up, Italy

The last year with a significant positive balance on the glacier was 1977, in the majority of years since 1980 the glacier has had no accumulation zone, which equates to an accumulation area ratio of zero (Carturan and Seppi, 2007). This translates to a glacier with no income of snow, but still plenty of losses via melting, which means the glacier cannot survive, and of course will drive the retreat (Pelto, 2010). Luca Carturan, University of Padova, provides both a chart of mass balance and a comparison of the glacier from 1967 to 2009, red bars indicate negative mass balance. The glacier has the longest mass balance record of any Italian glacier and the data is submitted annually to the World Glacier Monitoring Service. Carturan et al (2012) examine the mass balance distribution in more detail, in their Figure 2 the glacier is separated from its most western appendage (W), but the center part (C) is still connected to the main section (M) of the glacier, red dots are the around glacier watershed. . The images below are a series of Landsat images from 1999, 2003, 2009 and 2011. The red arrows indicate two narrow ice connections that were intact between the west-center-main part of glacier in 1999 and 2003. By 2009 the west section is not connected, and by 2011 the center connection is also gone. The deeper blue color of the glacier indicates a lack of snowcover, snowcover can be seen on the glaciers north of the ridge above the Careser Glacier. Careser Glacier fits the pattern of thinning, lack of accumulation zone and separation as seen at Presena Glacier, Dosde Glacier and Cavagnoli Glacier

Dosde Glacier, Italy retreat and separation

Dosdè Glacier in the Dosdè-Piazzi Group of the Italian Alps has been the focus of research by the University of Milan Department of Geography in the last decade to both chronicle its retreat, examine the causes, and evaluate the impacts and potential mitigation steps. In 1954 there was a Dosdè Est, Dosdè Centrale and Dosdè Ovest glaciers with respective areas of 1.2 and 0.8 and 0.9 square kilometers. By 2003 the areas had been reduced to 0.8, 0.5 and 0.3 square kilometers. This is evident in the picture from 1932 and 2007 of the Dosdè Glacier group from Guglielmina Diolaiuti, University of Milan. I have added arrows annotating key changes Est is on the left, Centale in the middle and Ovest (labelled Ost) on the right. The purple arrow indicates the separation of two glaciers. The blue arrow indicates the change in glacier size near the top of the peak. The orange arrow notes the thinning of the glacier near the current glacier tongue. The green arrow indicates the retreat at the head of the glacier indicating thinning even in the accumulation zone. This glacier lost all of its snowcover in several recent summers including 2010, in this Google Earth view the summer of 2010 is ongoing and their are a few white patches of snowpack from the previous winter, that were then lost. This inconsistency of the accumulation zone is a sign of a glacier that cannot survive In this region at least 6 glaciers have been observed to disappear in the last 50 years. The continued decline in area and lack of accumulation zone persistence does not suggest that glaciers in this mountain massif will survive. Dosdè Est has retreated over 400 meters in the last 50 year, but of more importance to its survival is the degree of thinning apprarent from the terminus to its head. Dosdè Est has been the focus of study utilizing a covering blanket to examine its efficacy in reducing ablation as was done on Stubai Glacier in Austria. The University of Milan group reported a 43% decline in snow ablation and a 100% decline in ice ablation. The retreat of this glacier follows the trend of increasingly rapid and widespread retreat seen throughout the Italian Alps, as chronicled by the Italian Glacier Commission, which reported more than 95% of the over 100 glaciers examined retreating from 2000-2005. The smaller size and elevation range of the Dosdè Glacier group makes them more vulnerable to complete loss than Forni Glacier.

Forni Glacier, Italy Retreat

Forni Glacier is the largest valley glacier in Italy. It is currently 5 km long and has retreated 2.5 kilometers since its Little Ice Age Maximum. It is in the Cevedale Group, Alps and part of the Parco Nazionale dello Stelvio. In this image the Little Ice Age terminal moraine is the prominent sharp debris ridge in the foreground, twenty years ago the glacier descended beyond the bottom of the image. The Italian Glaciologic Commission has observed and reported its annual terminus change over the last 30 years to the World Glacier Monitoring Service. The glacier began a sustained retreat in 1988, after advancing a small distance in the 1970-1987 period. As reported by the IGC to the WGMS from 1990-1995 Forni Glacier retreated 290 m, between 1995 and 2000 130 m, and from 2000-2005 115 m. Using IKONOS (Bellingeri and Zini, 2006 stereoscopic high resolution imagery linear retreat of the glaciers tongue was established as 520 meters for Forni Glacier in the 1981-2003 period. The glacier was found to have lost an average of 15 m in thickness in this period, 60 m near the terminus. The glacier as seen below above the key icefalls has a substantial consistent accumulation zone. It is the terminus tongue below the icefall that is at risk with current climate. A close up view of the terminus illustrates the region that has been deglaciated in the last 20 years, there is virtually no green vegetation evident in this region. The lower section of the glacier is rapidly downwasting still.