Widespread Retreat Gilkey Glacier System, Alaska

Gilkey Glacier drains the west side of the Juneau Icefield and has experienced widespread significant changes since I first worked on the glacier in 1981.    Here we examine the changes from the August 17, 1984 Landsat 5 image to the August 21, 2014 image from newly launched Landsat 8.  Landsat 5 was launched in 1984, Landsat 8 launched in 2013. The Landsat images have become a key resource in the examination of the mass balance of these glaciers (Pelto, 2011). The August 17th 1984 image is the oldest Landsat image that I consider of top quality. I was on the Llewellyn Glacier with the Juneau Icefield Research Program (JIRP) on the east side of the icefield the day this image was taken. JIRP was directed by Maynard Miller at that time and by Jeff Kavanauagh now. The Gilkey Glacier is fed by the famous Vaughan Lewis Icefall at the top of which JIRP has its Camp 18 and has monitored this area for 60 years. Here I examine changes both in images and text below. The same analysis in a more depth is contained in the screen capture video of the same images.  Choose the format you prefer and let me know which works for you.

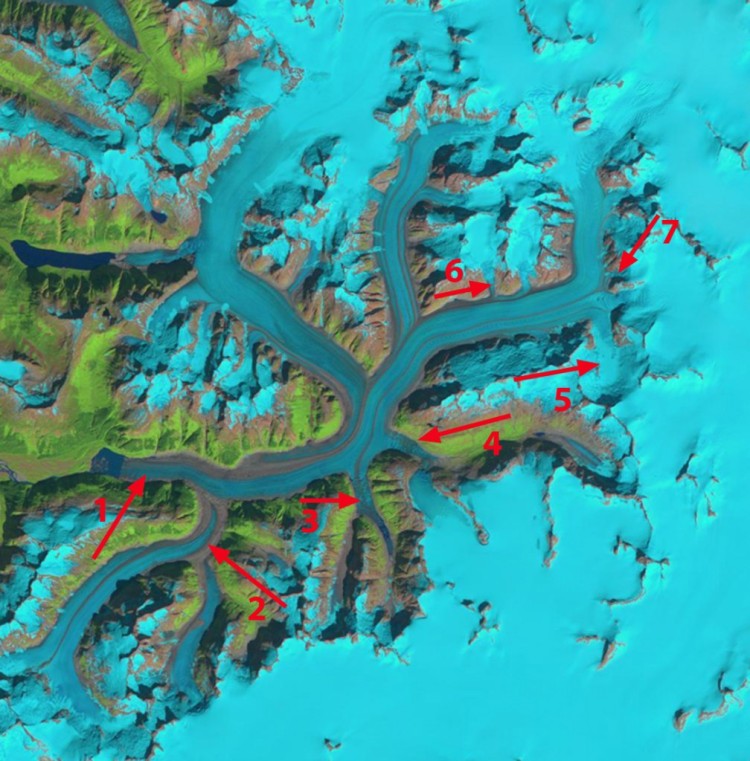
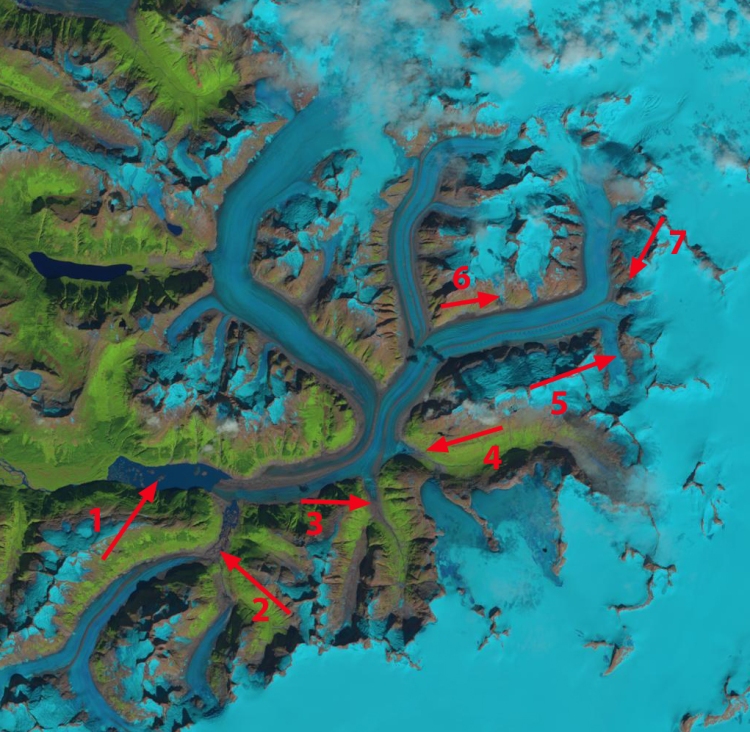
There are seven locations noted in the 1984 and 2014 image that are the focus of more discussion in a set of three more focused images

gILKEY gLACIER 1984 SOURCE

1984 Landsat Image

Gilkey Glacier 2014 source

2014 Landsat image

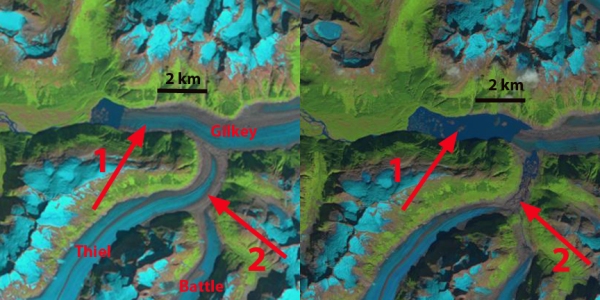
Arrow #1 indicates the Gilkey Glacier terminus  area.  Gilkey Glacier had begun to retreat into a proglacial lake by 1984, the lake was still just 1 km long. A short distance above the terminus the Gilkey was joined by the sizable tributaries of the Thiel and Battle Glacier. By 2014 the main glacier terminus has retreated 3200 m, the lake is now 4 km long.  A lake that did not exist in USGS maps from 1948. Thiel and Battle Glacier have separated from the Gilkey Glacier and from each other. Thiel Glacier retreated 2600 m from its junction with Gilkey Glacier from 1984-2014 and Battle Glacier 1400 m from its junction with Thiel Glacier and 3500 m from the Gilkey Glacier.  Melkonian et al (2013) note the fastest thinning in the Gilkey Glacier system from to is near the terminus and in the lower several kilometers of Thiel Glacier.

Gilkey terminus retreat

Above: 1984-2014 Comparison of Gilkey Glacier terminus area with Landsat imagery

Arrow #3 and #4 indicates valleys which tongues of the Gilkey Glacier flow into.  In 1984 at #3 the glacier extended 1.6 km upvalley ending where the valley split. The portion of the Gilkey flowing into the valley had a medial moraine in its center.  At arrow #4 the glacier extended 1.5 km up Avalanche Canyon.  In 2014 at  #3 the glacier tongue ends 1.2 km from the valley split, and the medial moraine does not enter the valley.  At #4 the glacier has retreated 1.3 km, leaving this valley nearly devoid of a glacier.

avalanche canyon retreat

Above: Comparison of the Avalanche Canyon area 1984-2014.

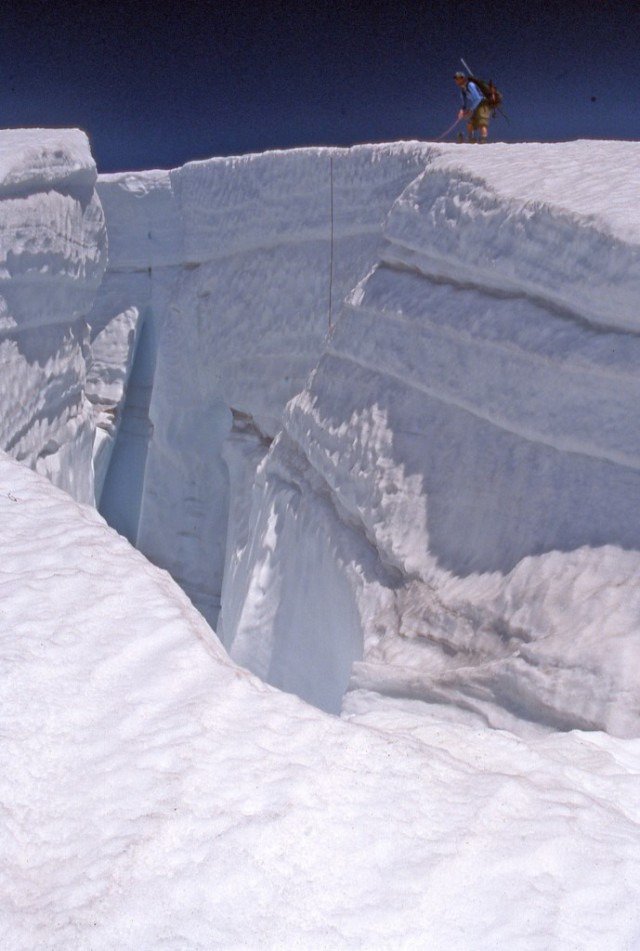
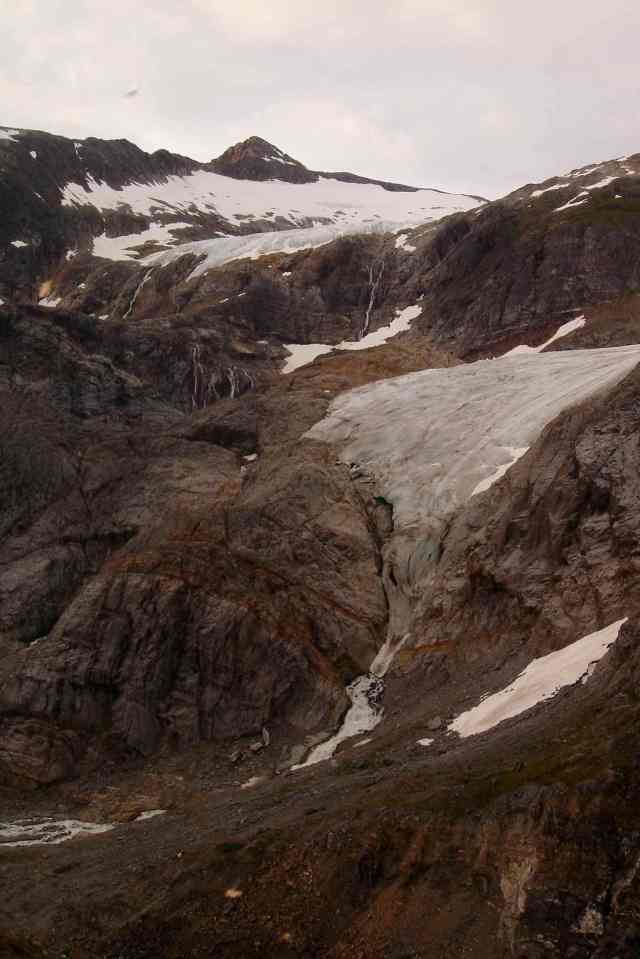
Further upglacier arrow #5 indicates a side glacier that in 1984 featured an unending system of glacier flowing down the steep mountain sides into the valley bottom.  By 2014 two rock ribs extend along most of the east and west valley walls separating the glaciers on mountain side from the main valley glacier, which has as a result been reduced in width and velocity. At arrow #6 a tributary glacier is seen merging with Gilkey Glacier in 1984.  By 2014 this tributary no longer reaches the Gilkey Glacier, ending 300 m up the valley wall.  At arrow #7 the Little Vaughan Lewis Icefall in 1984 is seen merging with the Gilkey Glacier across a 300 m wide front.  This I can attest from seeing the glacier that summer to be an accurate observation.  By 2014 at arrow #7 the Little Vaughan Lewis Icefall no longer feeds ice directly to the Gilkey Glacier.  There is still avalanching but not  a direct flow connection. JIRP has Camp 19 in this area, a spectacular area of ongoing research by JIRP.   The main Vaughan Glacier Icefall is still impressive, just south of the rib beyond arrow #7. Measurements of snowpack are made annually by JIRP above the icefall, and indicate a mean snow depth exceeding 3 m in early August, note image below of measuring annual snow layers in a crevasse at head of the icefall. Pelto et al (2013) summarize the results of this ongoing research that Chris McNeil (USGS) is working to enhance with newer technology.  The terminus change of all Juneau Icefield glaciers from 1984-2013 has been summarized in a previous post. The 2015 season will be of interest, since the area had a remarkably warm yet wet winter.  This will lead to high ablation at lower elevations, likely a higher snowline than usual, but above the Vaughan Lewis Icefall will those warm wet events dumped snow? The 2014 winters season was warm and the snowline seen in the 2014 satellite imagery was at 1500 m, yet snowpack at 1760 m on the Vaughan Lewis Glacier was 3.3 m deep in late July.  This has been the case in the past with warm wet winters featuring heavy snow above 1600 meters on the icefield. JIRP will be in the field answering this question in 2015.

little vaughan

Above: Comparison 1984-2014 of the Vaughan Lewis Glacier area

Untitled-24

Crevasse stratigraphy Vaughan Lewis Glacier.

Juneau Icefield Glacier Terminus Change from Landsat 5 1984 to Landsat 8 2013

The Juneau Icefield Research Program (JIRP) has been examining the glaciers of the Juneau Icefield since 1946. Until the NASA Landsat program began field measurements and aerial observations were the only means to observe the glaciers of the icefield. For more than 40 years it was Maynard Miller, U of Idaho, who led this expedition that has trained so many of today’s glaciologists, today it is Jeff Kavanaugh, U of Alberta. Given the difficult weather conditions that produce the 4000+ square kilometers of glaciers, this was not a task that could be done comprehensively. Here we examine the changes from the August 17, 1984 Landsat 5 image to the June 21, 2013 image from newly launched Landsat 8. Landsat 5 was launched in 1984, Landsat 8 launched in 2013. The Landsat images have become a key resource in the examination of the mass balance of these glaciers (Pelto, 2011). The August 17th 1984 image is the oldest Landsat image that I consider of top quality. I was on the Llewellyn Glacier with JIRP on the east side of the icefield the day this image was taken. On June 21, 2013 JIRP’s annual program had not begun, but the field season is now underway once again observing fin and reporting from the field across this icefield.
Post reblogged at NASA

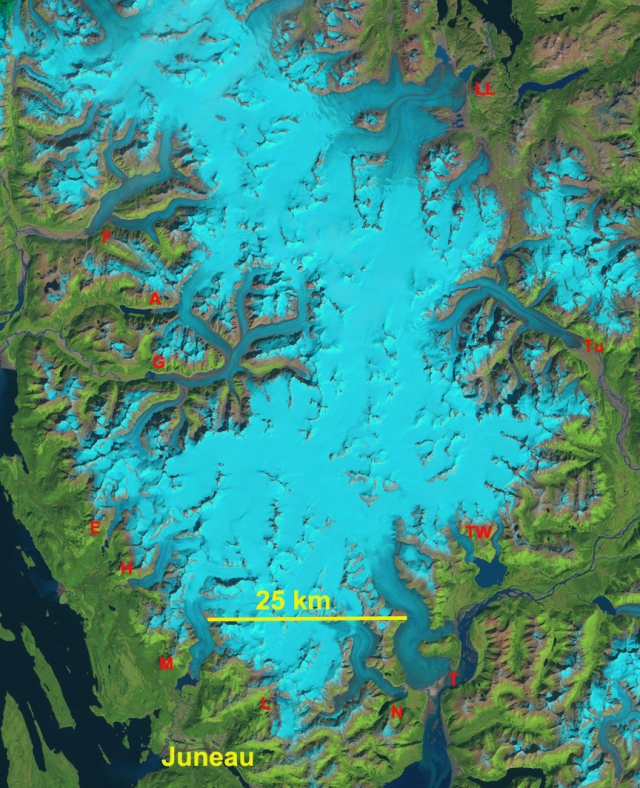
First we have the two reference images of the entire icefield that indicate the location of the 12 main glaciers we focus on here. Followed by a chart indicating the amount of terminus change, 14 glaciers have retreated and one has advanced.
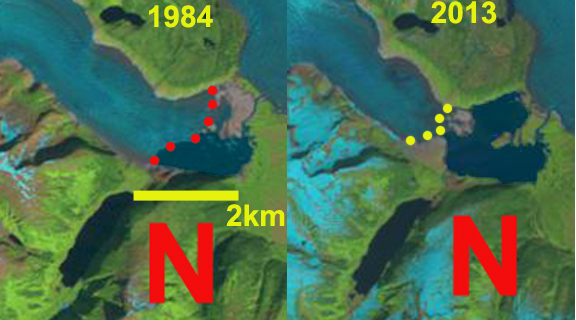
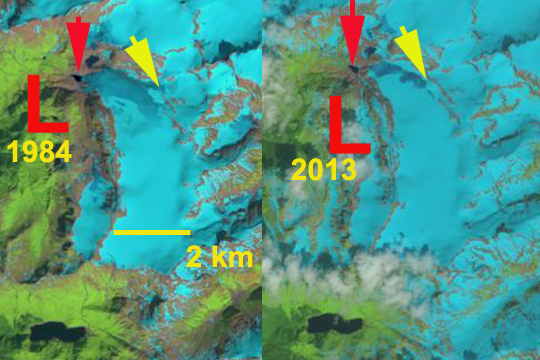
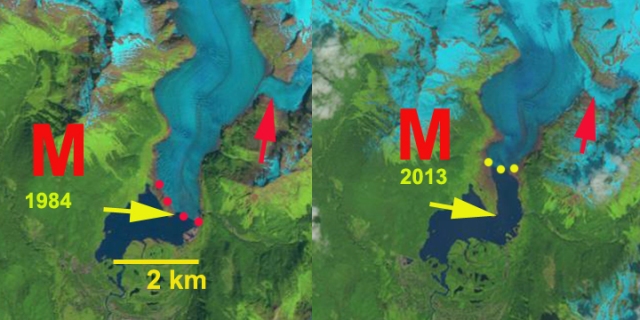
This is followed by 12 closeup glacier by glacier comparisons of the terminus, with the 1984 image always on the left and 2013 on the right, the 1984 margin is marked with red dots and the 2013 with yellow dots. This is an update to an examination of the Juneau Icefield terminus changes from 1948 to 2005. There are also links to more detailed discussions for each glacier, as the focus here is on the 1984 to 2013 changes visible in the images here. The images were first overlain in ArcGIS and the terminus change based on three measurements one at the glacier terminus midpoint, one each halfway to the margin from the mid-point. The exception is the Taku Glacier which is based on the JIRP field measurement mean and the Llewellyn where three measurements are made on each of the two termini, the average is then rounded to the nearest 100 m. The ongoing retreats reflects the long term negative mass balance of the glaciers with the exception of the Taku Glacier. The ongoing warming of our globe will continue to lead to retreat. The glaciers are all fed from the central portion of the icefield that always has a large snow covered area even at the end of recent warm summers.
juneau icefield 1984
August 17, 1984 Landsat 5 image: N=Norris, L=Lemon Creek, M=Mendenall, H=Herbert, E=Eagle, G=Gilkey, A=Antler, F=Field, LL=Llewellyn, Tu=Tulsequah, TW=Twin and T=Taku.

Juneau icefield 2013
June 21, 2013 Landsat 8 image

JIF terminus
1984-2013 chart of terminus change of individual glaciers from 1984 to 2013, see individual images below for the observed changes.

norris glacier change
From 1984 to 2011 Norris Glacier has retreated 1100 m. The glacier terminus that has been ending in a proglacial lake for the last 40 years is now mostly grounded. Since 1984 the northern half of this lake has formed and the long term lake development is discussed in a more detailed discussion on Norris Glacier.
lemon glacier change
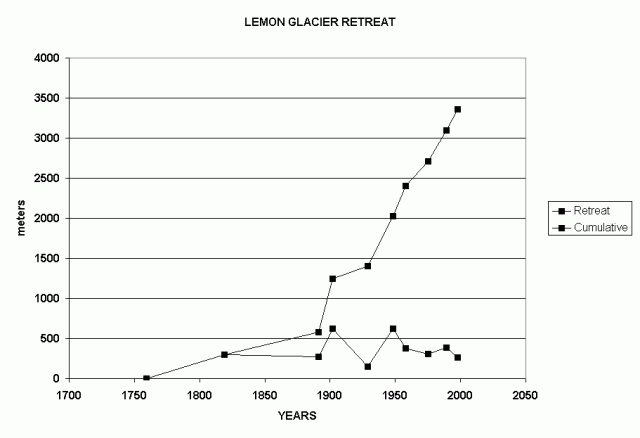
In 1984 Lemon Creek Glacier (L) has pulled back 300 m from a small lake it reached in 1984. Lemon Creek Glacier has a long term mass balance record that indicates more than 15 m of thinning from 1984 to 2012. This thinning is more dramatic than the 300 m retreat that has occurred. The yellow arrow indicates a tributary that no longer connects to the glacier.

mendenhall glacier change Mendenhall Glacier is the most visited and photographed terminus in the region. The glacier in 1984 ended at the tip of a prominent peninsula in Mendenhall Lake. By 2013 the terminus has retreated 1200 m, with an equal expansion of the lake. The red arrows indicate a tributary that decreased dramatically in width and contribution to the main glacier. This is the location of Suicide Basin, where a lake has formed the last two summers and then rapidly drained. A nice set of images of the glacier are provided by Matt Beedle.

herbert glacier change
Herbert Glacier has retreated 600 m since 1984. The width of the terminus has also declined. The red arrow indicates a tributary that no longer feeds the main glacier.

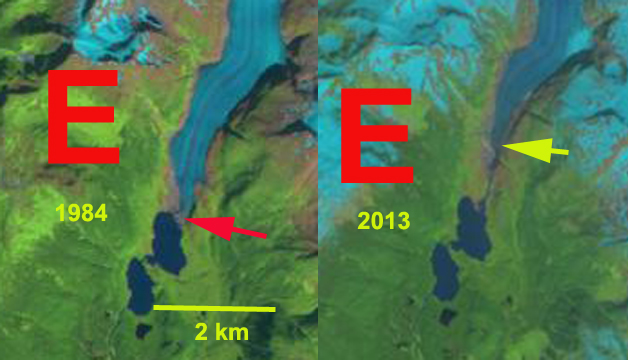
eagle glacier change Eagle Glacier has retreated from the edge of a lake in 1984. The retreat of 1100 m is rivaled by the width reduction of the glacier in the lower 3 km. Eagle Glacier‘s ongoing retreat is examined in more detail.

gilkey glacier change Gilkey Glacier had begun to retreat into a proglacial lake by 1984, the lake was still just 1 km long. A short distance above the terminus the Gilkey was joined by the sizable tributaries of the Thiel and Battle Glacier. By 2013 the glacier has retreated 3200 m, the lake is now 4 km long. Thiel and Battle Glacier have separated from the Gilkey Glacier and from each other. Thiel Glacier retreated 2600 m from its junction with Gilkey Glacier from 1984-2013 and Battle Glacier 1400 m from its junction with Thiel Glacier
antler glacier 2013 Antler Glacier is actually a distributary glacier of the Bucher Glacier, which in turns joins the Gilkey Glacier. As this glacier has thinned, less ice has overtopped the lip of the valley that Antler occupies. In 1984 Antler Glacier was 3 km long descending the valley to end near a proglacial lake, that it had recently occupied. By 2013 the glacier was just 400 m long, having lost 2600 m of its length.
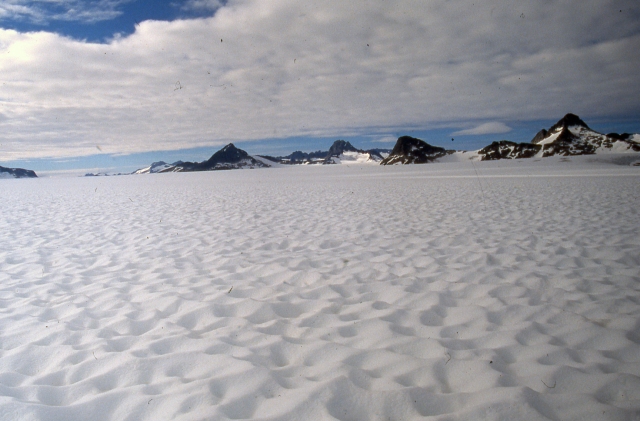
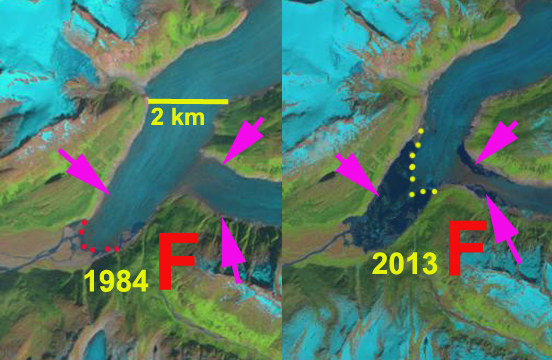
field glacier change Field Glacier in 1984 ended at the edge of an outwash plain with a few glimpses of a lake developing near its margin. By 2013 a substantial lake has formed at the terminus and the glacier has retreated 2300 m. A lake has also developed at the first terminus joining from the east, most of the width of this glacier has been lost. It is clear that the two lakes will merge as the retreat continues.

lewellyn glacier change The second largest glacier of the icefield is the Llewellyn Glacier which is in British Columbia. The glacier has several termini, here we examine two of them that have retreated 900 m from 1984-2013. Hoboe Glacier is another terminus that has been examined, but not in this post. This has led to formation of new lakes, and water level changes in existing lakes. Matt Beedle has examined the recent changes at the terminus.

tulsequah glacier change Tulsequah Glacier in 1984 ended at an outwash plain with a small marginal lake beginning to develop, red arrow. By 2013 a large proglacial lake has developed due to the 2500 m retreat. A side valley down which a distributary tongue of the glacier flowed in 1984 has retreated out of the valley by 2013, pink arrow.

twin glacier change The East and West Twin Glacier are receding up separate fjords, though they are fed from a joint accumulation zone. The East Twin is a narrower glacier and has retreated 900 m. The West Twin has retreated 600 m, at an elbow in the fjord. Elbows like this are often good pinning points that are a more stable setting, once the glacier retreats out of the Elbow retreat should speed up.

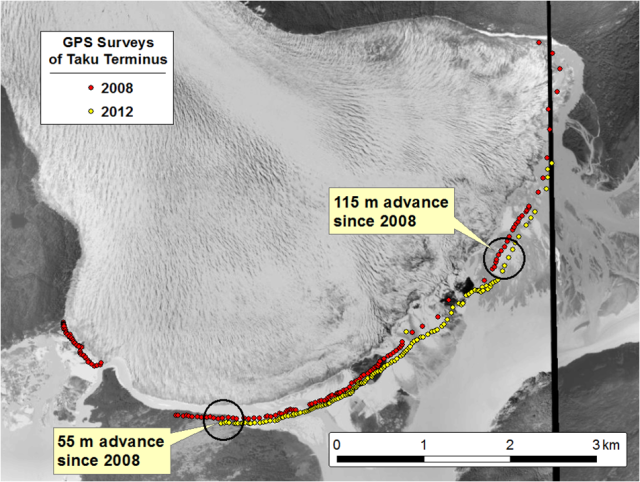
taku Glacier change Taku Glacier is the largest glacier of the icefield and unlike all the others it has been advancing non-stop over the last century. The sustained positive mass balance from 1946-2012 has driven this advance (Pelto, 2011), this led to the glacier thickenning along its entire length. Since 1950 observations of velocity near the snowline of the glacier by JIRP indicates that the glacier has had a remarkably steady flow over the past 50 years (Pelto et al, 2008). Since 1988 the glacier has not been thickening near the snowline as mass balance has declined. We have been able to observe the snowline movement in satellite images to help determine the mass balance. The changes at the glacier front are quite variable as the glacier advances. JIRP measurements of the terminus indicate this from 2001-2008 with an interactive map from Scott McGee, indicating advances in some area, minor retreat in others and back and forth in others. In 2012 JIRP was back at the terminus creating the map below. There is no change at the east and west side of the margin since 2008 and 55 to 115 m of advance closer to the center.

TakuTerminusSurvey2012

Norris Glacier Retreat, Juneau Icefield Alaska

norris glacier changeAbove is a paired Landsat image from 1984 left and 2013 right indicating the 1100 m retreat during this period.
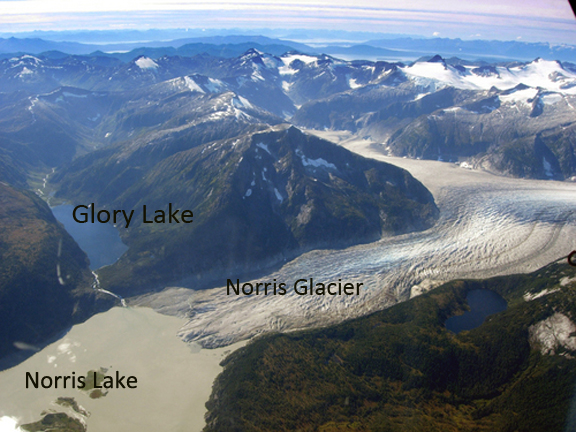
Norris Glacier began retreating before 1890 and has continuously retreated 2050 m from its 19th-20th maximum achieved around 1915. The glacier ended in a lake referred to here as Norris Lake from 1948 until 2007. By 2010 the glacier had retreated from this lake. Here we examine images from fieldwork conducted by the Juneau Icefield Research Program and overflights as part of the program from 1975 to 2010 and Google Earth imagery. I have had the chance to cross this glacier on ski a half dozen times as part of JIRP, and is was seldom an easy traverse, hence the names death valley and dead branch for portions of the glacier. Norris Glacier does not receive much attention as the program is focused on the Lemon Creek Glacier and the more famous and largerTaku Glacier, and does not garner much of our attention.
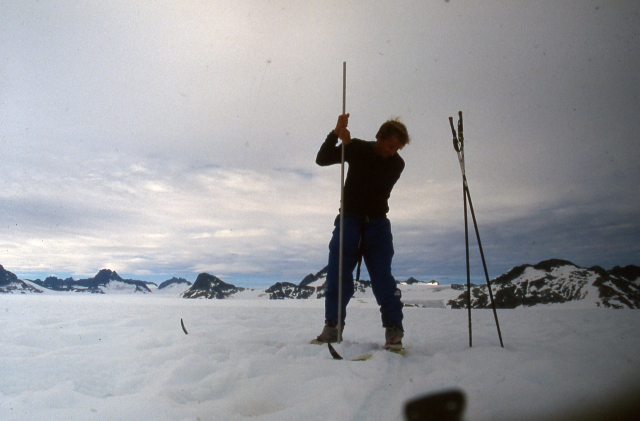
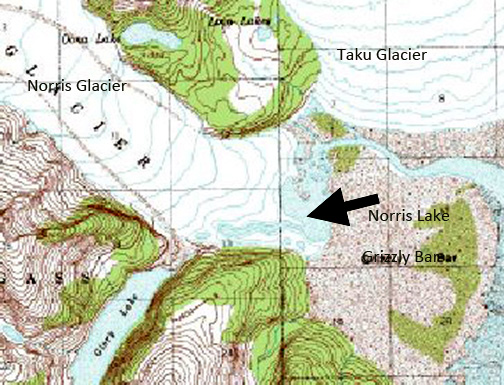
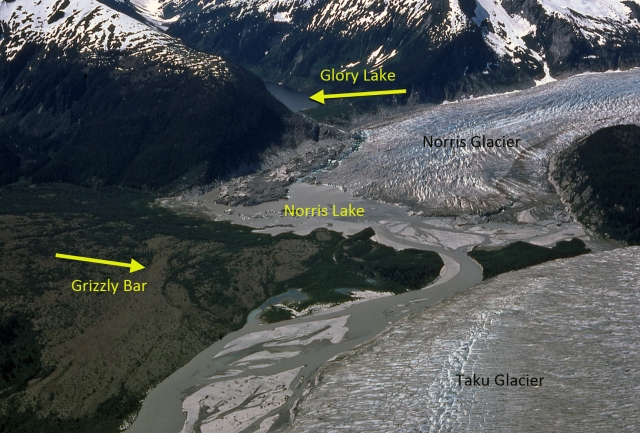
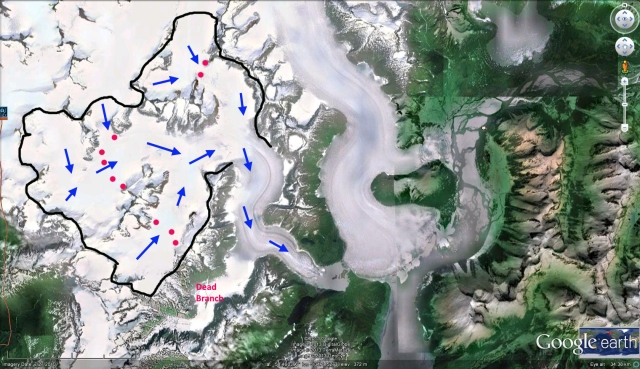
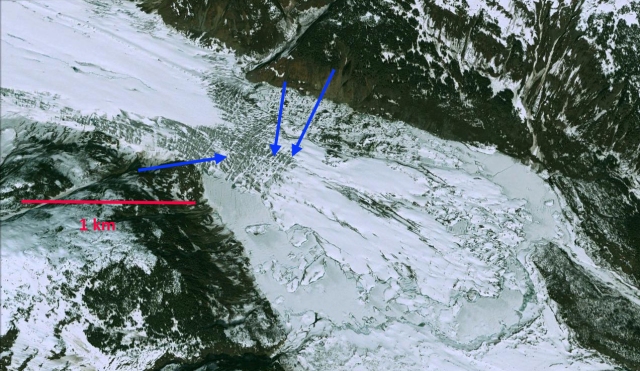
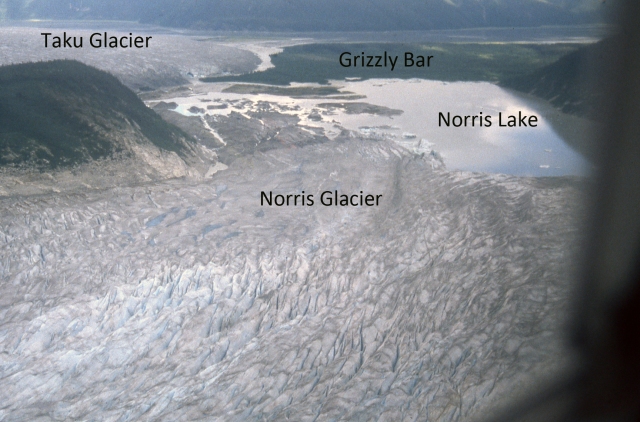
In 1948 the USGS map (top image) indicates Norris Lake was a narrow 200-500 meters wide lake and the glacier terminus was only 200 to 700 meters from Grizzly Bar, increasing with distance south along margin, an outwash plain built by the glacier beyond its advanced terminus position. By 1975 (second image; taken by Maynard Miller JIRP director for fifty years) the glacier had retreated an additional 250 meters, Norris Lake had expanded, but still had considerable ice along its western margin. The terminus was still extending a kilometer downvalley of the outlet of Glory Lake. The view of the entire glacier in Google Earth illustrates the direction of flow and accumulation sources blue arrows, typical snowline red dots and glacier boundary black line. norris_Glacier

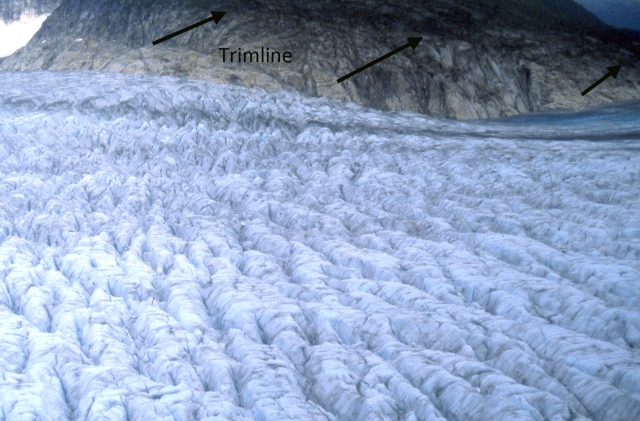
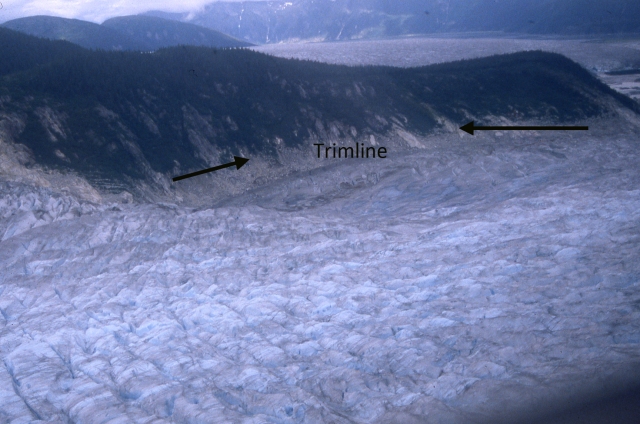
norris glacier terminus 1975<norris full glacierIn 1998 I had the opportunity to fly over the glacier at the end of the field season. A series of images indicates the trimline that had developed with the recent glacier thinning of the last 50 years. Norris Lake had expanded to a length of 1.2 km on the north shore and 1.9 km on the south shore from Grizzly Bar. norris icefall

norris glacier terminus east 1998

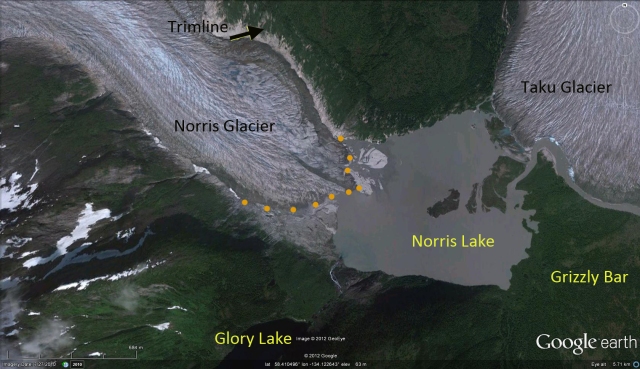
norris terminus 1998 In 2010, images below, the glacier barely reached the edge of Norris Lake and the terminus was well up valley from the Glory Lake outlet, Grizzly Bar was 2.1 km from the terminus. By 2011 the glacier no longer reached the shore of Norris Lake. An examination of the icefall feeding the glacier terminus area indicates considerable melt out of crevasse features, indicating that flow is not that vigorous through the icefall above the terminus at 300 m, suggesting retreat will continue. The trimline hear has increased from 20 m to 50 m above the ice surface since 1975. norris aERIAL

norris glacier 2010 In the summer of 1998 we conducted extensive probing in the accumulation zone of the glacier, last two images in sequence below. This combined with annual identification of the snowline since 1994 indicates insufficient snowpack and continued thinning. This glacier has the majority of its area between 800 and 1200 m, with the average snowline since 1994 being 1000 m. Maximum accumulation is 1.5 m, whereas maximum ablation at the terminus exceeds 12 meters, hence you need a much larger accumulation zone to offset the higher terminus ablation. This glaciers retreat and lake expansion of the terminus follows the same pattern as all other glaciers of the Juneau Icefield except the Taku Glacier: Gilkey Glacier, Field Glacier, Eagle Glacier and Antler Glacier. norris accumulation
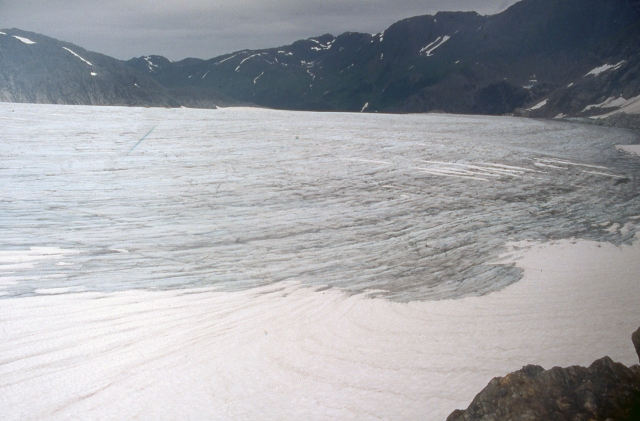
pelto probingsnowline

Lemon Creek Glacier Retreat Juneau Icefield Alaska

lemon glacier changeAbove is a paired Landsat image with 1984 left and 2013 right, indicating a 300 m retreat in this interval.

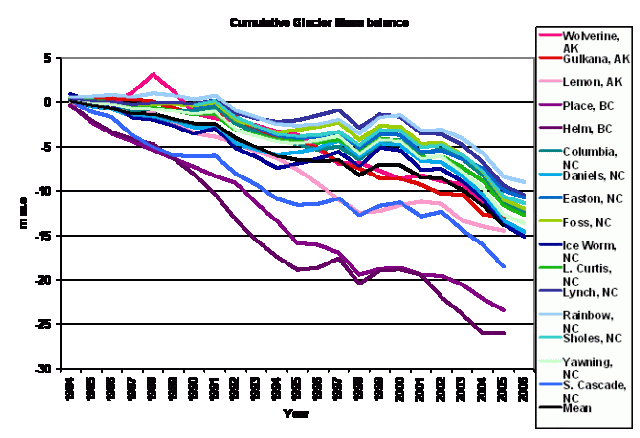
Annual balance measurements on the Lemon Creek Glacier, Alaska conducted by the Juneau Icefield Research Program from 1953 to 2013 provide a continuous 61 year record. This is one of the nine American glaciers selected in a global monitoring network during the IGY, 1957-58 and one of only two were measurements have continued. These show cumulative ice losses of –13.9 m (12.7 m we) from 1957-1989, of –19.0 m (-17.1 m we) from 1957-1995 and –24.4 m (–22.0 m we) from 1957-1998. The mean annual balance of the 61 year record is -0.43 m/a and a loss of at least 30 m of ice thickness for the full 61 year period from 1953-2013. In the second graph the similarity with other North American glaciers is evident (Pelto et al, 2013).

This negative mass balance has fueled a terminal retreat of 800 m during the 1953-1998 period, and an additional 200 meters of retreat by 2013. Below is a picture of the terminus enroute to Camp 17 in 1982, and below that from 2005. The annual balance trend indicates that despite a higher mean elevation and a higher elevation terminus, from thinning and retreat, mean annual balance has been strongly negative since 1977 (-0.60 meters per year). Dramatically negative mass balances have occurred since the 1990’s, with 1996, 1997 and 2003 being the only years with no retained accumulation since field observations began in 1948.

These data have been acquired primarily by employing consistent field methods, conducted on similar annual dates and calculated using a consistent methodology. The research is conducted from Camp 17 on a ridge above the glacier. This is a wet and windy place with three out of four summer days featuring mostly wet, windy and cool conditions in the summer. The camp was initially built for the IGY in 1957, and Maynard Miller and Robert Asher saw to its continued improvements through the 1980’s. The mass balance record have been were until 1998 precise, but of uncertain accuracy. Then two independent verifications indicated the accuracy (Miller and Pelto, 1999). Comparison of geodetic surface maps of the glacier from 1957 and 1989 allowed determination of glacier surface elevation changes. Airborne surface profiling in 1995, and comparative GPS leveling transects in 1996-1998 further update surface elevation changes resulting from cumulative mass balance changes. Glacier mean thickness changes from 1957-1989, 1957-1995 and 1957-1998 were -13.2 m, -16.4 m, and –21.7 m respectively. It is of interest that the geodetic interpretations agree fairly well with the trend of sequential balances from ground level stratigraphic measurements. The snowline of the glacier lies a short distance above a tributary glacier from the north that has separated from the main glacier since 1982. The snowline on the glacier was just below this juncture in the 1950’s and 1960’s but now has typically been above this former juncture. The two images below are looking down and upglacier from this former tributary in 2005.

At the head of the glacier is a supraglacial Lake Linda, which now drains under the ice. Robert Asher in the late 1970’s and 1980’s mapped this lake system when it drained under the head of the glacier not down under the terminus of the glacier.

Tulsequah Glacier, British Columbia Jokuhlaups and Retreat

tulsequah glacier changeAbove is a paired Landsat image from 1984 left and 2013 right indicating the 2500 m retreat during this period of Tulsequah Glacier and formation of a new lake at the terminus. Tulsequah Glacier, British Columbia is a remote glacier draining from the Alaska-Canada boundary mountains of the Juneau Icefield. It is best known for its Jökulhlaups from lakes dammed by Tulsequah Glacier in northwestern British Columbia, Canada (Geertsema, 2000). This Tulsequah Glacier has retreated 1100 m since the Little Ice Age maximum in the 19th century. The continued retreat of the main glacier at a faster rate than its subsidiary glaciers raises the potential for an additional glacier dammed lake to form. The main terminus is disintegrating in a proglacial lake at present. This is not unlike the situation at the Gilkey Glacier just delayed. The images below are from Google earth in 2003 and 2007 and indicate the stagnant nature of the tongue in the lake, and lateral rifting that will be points of instability for a calving disintegration.
tulsequah terminus 2003

tulsequah terminus tongue 2007
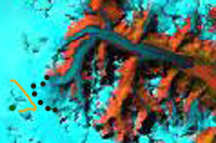
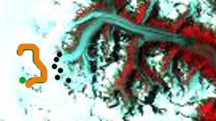
As part of the Juneau Icefield Research Program We completed extensive snow pack measurements in the upper reach of the glacier in 1981-1984 and found that snow depths by summers end between 1800-2000 meters averaged 4-6 meters. These observations completed along a transect across the glacier noted in the image below, provide a good example of the different sensitivities of the glacier to global warming. In 1981 a warm winter led to minimal snowpack at lower elevations in the Juneau Region, however, the upper regions of the icefield had above average snowpack. Jabe Blumenthal and I observed snowpack of over 5 meters on the upper Tulsequah Glacier. The areas above 1500 m are not very sensitive to winter temperatures as most as precipitation will fall as snow. In 1982 Juneau had good snowpack and the upper portion of the icefield was gripped by extended cold, the minimum thermometer at Camp 8 registered -44 F. In the images below the ELA for 1984 (right) and 2006 is indicated by a black dotted line, our Camp * a green dot and our accumulation profile is an orange line. In 2006 (left) the ELA is quite high and the accumulation are not large enough for an equilibrium balance. In 1984 the ELA was lower and mass balance was positive.
Such cold conditions indicate continental dry climate conditions persisting. The result good snowpack low on the glacier and below normal snowpack high on the glacier. From Camp 8 Brian Hakala and I surveyed the upper Tulsequah and found 4 meters of snowpack. In 1984 the highest snowpack of 6 m was noted as Wilson Clayton and I again measured the upper Tulsequah. The glacier still had healthy accumulation. The issue driving the retreat is that the equilibrium line where melting equals accumulation and bare glacier ice is exposed has risen and is now typically at 1400 meters.
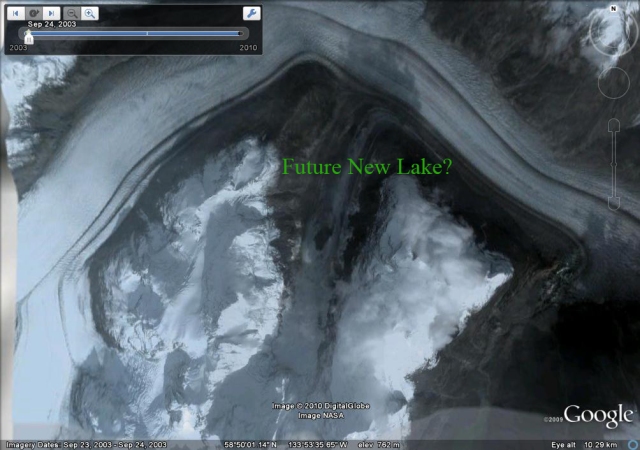
When water stored behind, on or under a glacier is released rapidly this outburst is referred to as a jökulhlaup. These outburst floods can pose a serious threat to life and property, but not from the modest floods of the Tulsequah system along this relatively undeveloped watershed. Tulsequah Glacier has a long history of often annual jökulhlaups since the early twentieth century documented by the USGS. The floods resulted after decades of downwasting and retreat of Tulsequah Glacier. In particular a tributary glacier feeding the Tulsdequah retreated and downwasted faster than the main glacier. This valley then was dammed by the main stem of the glacier. There is no surface drainage evident from either Lake No Lake or Tulsequah Lake (labelled TL and NN in image above), indicating all discharge is through a subglacial tunnel.the main stem of the glacier emerging at the terminus and causing modest downstream flooding. Each summer as the lake filled with meltwater, its area, level and volume would increase to the extent that the hydrostatic pressure would float the glacier enough to begin flowing, this water then would further melt the ice enlarging its conduit. Most of the release occurs within several days. Hydrologic data are used to reconstruct the times and peak discharges of floods from the glacier-dammed lakes The first jökulhlaups from Tulsequah Lake were the largest. The history of this these jökulhlaups has been declining peak and total discharges as the lake became smaller. Today, Tulsequah Lake is small, and it will disappear completely if Tulsequah Glacier retreats any further. From 1941-1971 Tulsequah Lake discharged annually. Since 1990 a Lake No Lake has been discharging annually. Lake No Lake), has formed and grown in size as Tulsequah Lake has diminished. Lake No Lake developed from a subglacial water body in a tributary valley, 7 km upglacier from Tulsequah Lake. Like Tulsequah Lake, Lake No Lake rapidly grew in area and volume during its youth, and in the 1970s it began to generate its own jökulhlaups. Lake No Lake appears to be following the same evolutionary path as Tulsequah Lake – its volume is now decreasing due to downwasting of Tulsequah Glacier, and its jökulhlaups are beginning to diminish. As Tulsequah Glacier continues to shrink in response to climatic warming, additional glacier-dammed lakes may form, renewing the cycle of outburst flood activity, the tributary where this is most likely is labeled Future New Lake in the final image.