Tebenkof Glacier, Alaska Snowcover Loss Exposes Century of Annual Layers

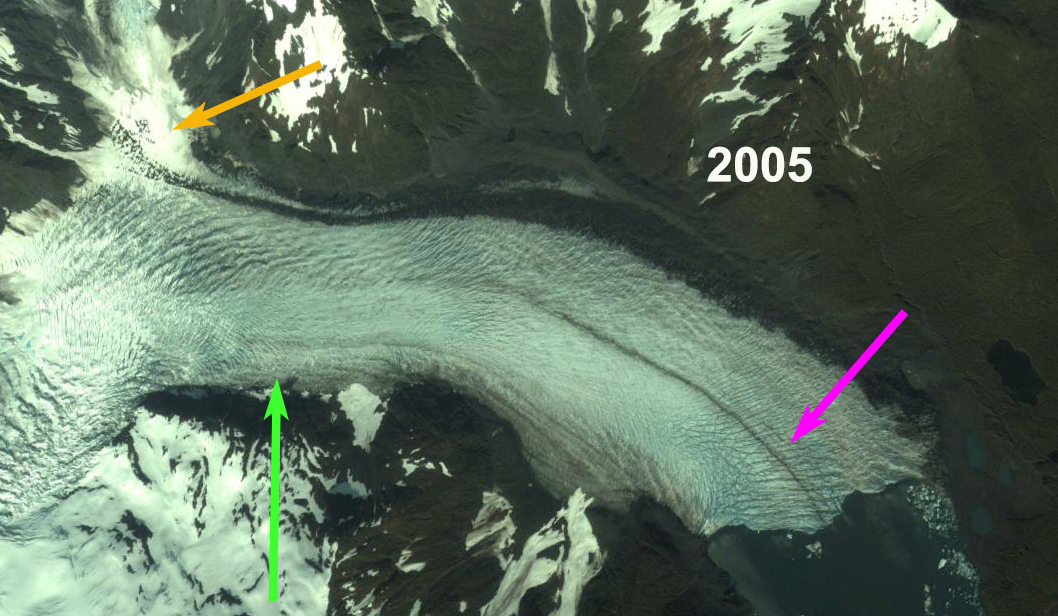
Tebenkof Glacier in 2018 ESRI World Image with annual layers numbered. from near the divide to near the terminus. A couple of layers of layers buried near top of glacier by snowcover. This indicates 90-100 annual layers exposed at the surface as they emerge at the surface.

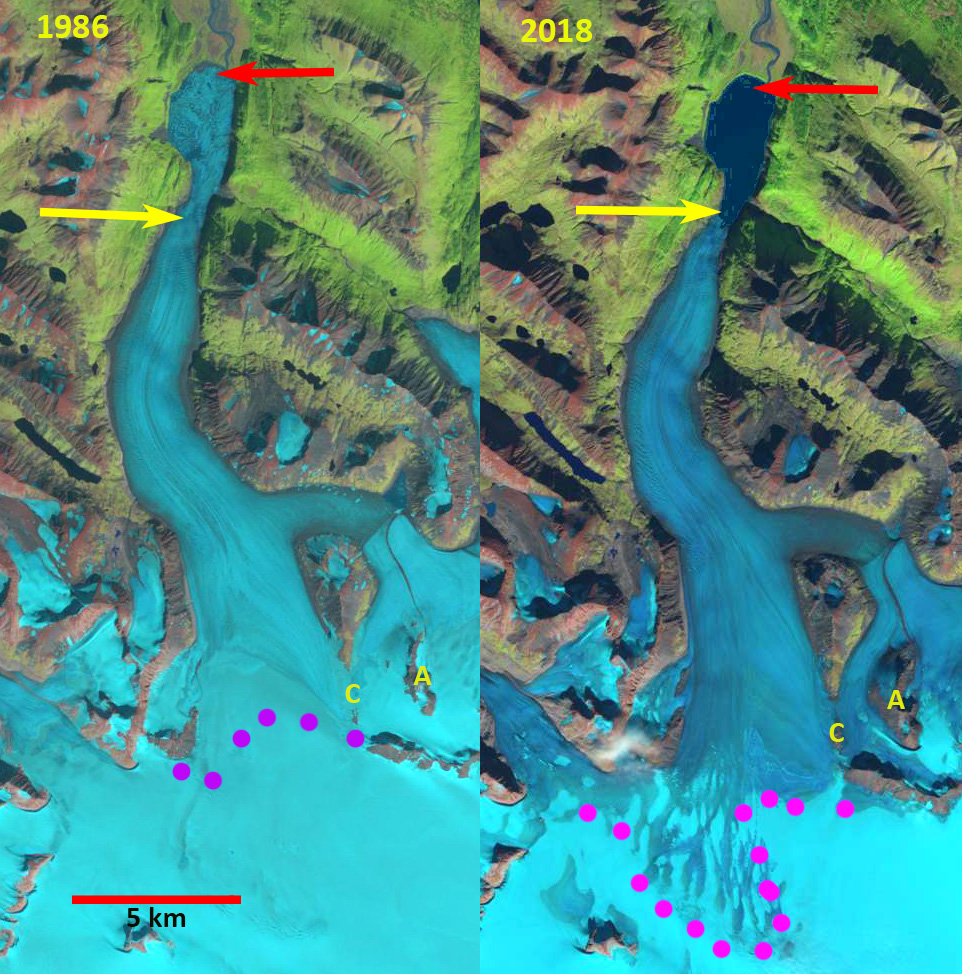
Tebenkof Glacier is a land terminating glacier on the Kenai Peninsula just west of Blackstone Bay. WGMS (2021) documented the retreat rate from 1910-2009 as ~20 m/year. Black and Kurtis (2022) examined 19 tidewater glaciers on the Kenia Peninsula identifying a 42 km² area loss from 1984-2021.  From 1986-2022 Landsat imagery indicates a retreat of 1100 m. During the summers of 2018-2020 the glacier lost all or nearly all snowpack, this allowed atellite imagery to reveal ~90-100 annual layers exposed from divide to near the terminus during years when the glacier was stripped of snowpack such as in 2018-2020.

Tebenkof Glacier retreat from 1986-2022 generating proglacial lake as it retreated 1100 m.

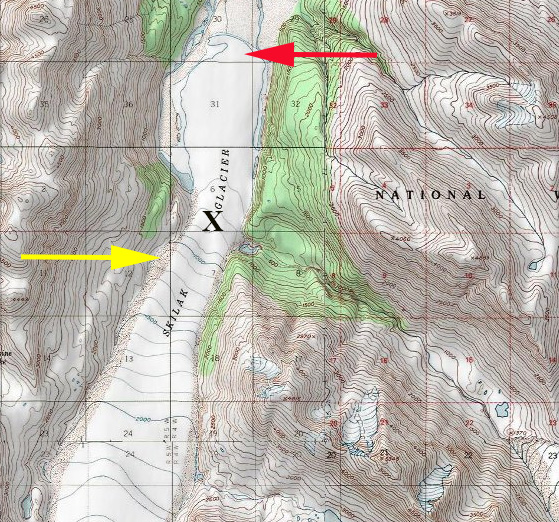
Tebenkof Glacier has an unsually low elevation and consistent gentle slope with the main glacier divide at 650 m and terminus at 200 m, with a length of 9 km. From 650 m where the first annual line layer is visible to 275 m where the last annual layer is visible is a distance of 6.5 km, with an average slope of 3.3 degrees. Above the equilbrium annual layers are submergent and below this line annual layers are emergent.The observed velocity at the blue and orange X show a remarkable consistency just as the slope with the 2017-2021 average fron the NASA ITS_LIVE of 60.72 at the orange point and 60.68 m/year at the blue x. This translates to travel time of 100 years from the divide to the end of the annual layer area. This is slightly more than the number of visible annual layers, however a few years have had no retained accumulation and hence no layer would form.

Tebenkof Glacier in Landsat images in 2018 and 2020 with less than 2% retained snowcover exposing annual layers.

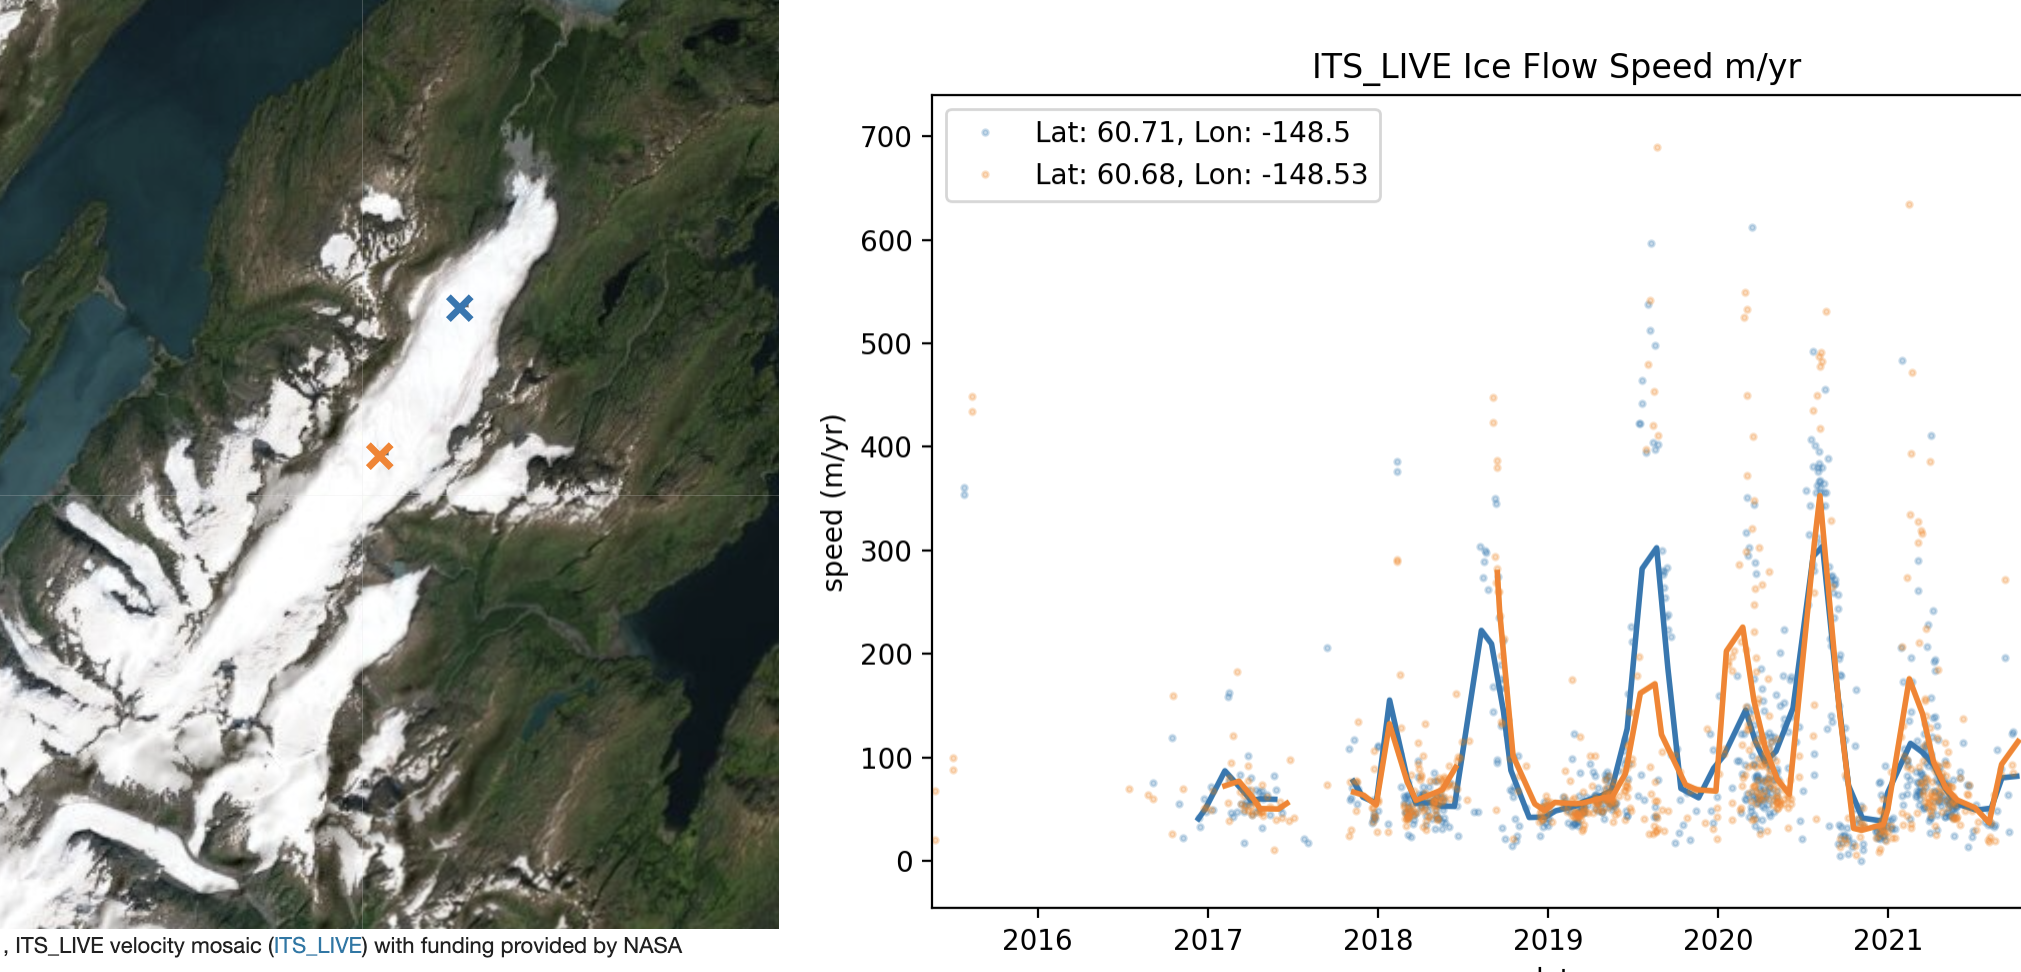
Tebenkof Glacier velocity data at two locations, both averaging 60 m/year, velocity from NASA ITS_LIVE

Skilak Glacier, Alaska Retreat and Salmon Connection

Skilak Glacier in 1986 and Sept. 2018 Landsat images.  In 1986 icebergs and remnant glacier fill nearly the entire lake.  The snowline in 1986 is at 1200 m and is at 1300 m in 2018. Red arrow is the 1982 terminus location and yellow arrow is the 2018 terminus location. Point A and C are bedrock outcrops at around 1200 m that have expanded.

Skilak Glacier is an outlet glacier on the northwest side  of the Harding Icefield, Kenai Peninsula, Alaska. From 1952-1982 Skilak glacier terminated on a proglacial plain with a broad nearly flat terminal lobe, see map below. The glaciers that drain eastward are in the Kenai Fjords National Park, which has a monitoring program.  From 1950-2005 all 27 glaciers in the Kenai Icefield region examined  retreated (Giffen et al 2014).  Giffen et al (2014) observed that retreated 1,800 m from from 1986-2000, with no retreat from 2000-2005. Here we examine Landsat imagery from 1986-2018 to illustrate the retreat of this glacier, recent snowline elevation and other upglacier changes. The glacier supplies meltwater to Skilak Lake which is a critical salmon habitat for the Kenai.  Chinook Salmon spawn on a section of the Kenai River between Kenai Lake and Skilak Lake. With Skilak Lake being the resulting home for ninety percent of the salmon fry for the Kenai River, and with the most of any nursery in the Cook Inlet area.  Escapements of chinook in the Kenai River exceed 50,000 annually in two runs (Heard et al 2007). Sockeye salmon is the largest run in the river with over 1,000,000 annual in the Kenai River run (Schoen et al, 2017).

In the 1958 USGS map from there is no lake evident at the terminus of the glacier.  The lower 2 km of the glacier is nearly flat.  By 1986 the flat terminus was breaking up with icebergs filling the lake. By 2002 the glacier had retreated 4 km generating a lake with an area of 6.2 square kilometers. The snowline in 2002 was at 1200 m.  The glacier retreated 300 m from 2002 to 2018.  From July 2018 to Sept. 2018 the snowline rose from 1050 m to 1300 m.  Though retreat has been slow since 2002 upglacier thinning has been substantial At Point A and C from 1986 to 2018 and at Point A and B from 2002-2018. This will drive additional retreat.  The retreat rate should be more in line with that of the neighboring Harris Glacier. 

Skilak Glacier  1958 Map prior to lake formation.

Skilak Glacier in 2002 and July 2018 Landsat images.  In 2002 is at 1100 m and is at 1150 m in July 2018. Red arrow is the 1982 terminus location and yellow arrow is the 2018 terminus location. The orange arrow indicates indicated banded snow formation.  Point A and B are bedrock outcrops at around 1200 m that have expanded.


Pedersen Glacier, Alaska Rapid Retreat 1994-2015

Pedersen Glacier Kenia Peninsula, Alaska retreat from Landsat images in 1994 and 2016. The red arrow indicates 1994 terminus, yellow arrow is 2016 terminus, orange arrow indicates northern tributary and purple dots indicates snowline. 

Pedersen Glacier is an outlet glacier of the Harding Icefield in Kenai Fjords National Park near Seward, Alaska. The glacier drops quickly from the plateau of the icefield through a pair of icefalls terminating in a lake at 25 meters above sea level.  The Harding Icefield glaciers that drain east are in the Kenai Fjords National Park, which has a monitoring program.  Giffen et al (2014) observed that from 1950-2005 all 27 glaciers in the Kenai Icefield region examined retreated.  Giffen et al (2014) observed that Pedersen Glacier retreated slow but steady from 1951-1986 at 706 m (20 m/a) and 434 m (23 m/year) from 1986-2005. Here we compare a 1994, 2013, 2015 and 2016 Landsat imagery illustrating a rapid increase in retreat rate from the previous periods.

In 1994 the terminus proglacial lake at the terminus is small and much of the terminus is on land.  The snowline in 1994 is at 550 m.  The tributary entering from the north, orange arrow, is 400 m wide as it reaches Pedersen Glacier.  In 2005 the Google Earth image below indicates extensive terminus crevassing, indicating substantial terminus velocity, and that the retreat is driven by calving.  In 2005 the lake is now 1.1 km long on its center axis.  By 2015 the glacier has retreated 2600 m since 1994, a rate of 125 m/year, much faster than before.  The snowline is average 800 m.  The northern tributary is now barely reaching the main glacier and has a width of 150 m. Note there was a medial moraine separating the tributary from the main glacier in 1994 and now this is merely a lateral moraine. This tributary is not particularly impacted by calving losses and indicates a rising snowline is also a source of mass loss for the glacier. A comparison of the 2013, 2015 and 2016 terminus indicates the recession has remained rapid.  The glacier is approaching the base of an icefall that would represent the inland limit of the lake and the end of rapid retreat.  The snowline in 2013 averages 850 m and is at 800 m on Sept. 30 2016. The glacier follows the pattern of nearby Bear GlacierYakutat GlacierHarris Glacier and the inital phase of retreat on Brady Glacier.

Pedersen Glacier Kenia Peninsula, Alaska retreat from Landsat images in 2013 and 2015. The red arrow indicates 1994 terminus, yellow arrow is 2015 terminus, green arrow indicates 2016 terminus and purple dots indicates snowline. 

Pedersen Glacier in 2005, note crevassing at the terminus, pink arrow. The northern tributary is indicated by orange arrow and green arrow indicates 2016 terminus position.