The retreat of outlet glaciers along the Greenland coast continues to change the maps of the region, Steenstrup Glacier located at 75.2 N in Northwest Greenland is an example of this. The glacier terminates on a series of headlands and islands, the glacier immediately to the south is Kjer Glacier. The boundary between Steenstrup Glacier and Kjer Glacier is Red Head, Steenstrup Glacier’s northern margin is near Cape Seddon. Here we examine changes in the terminus position of Steenstrup and Kjer Glacier from 1999 to 2014. The retreat of the glacier during this interval has led to generation of new islands. Steenstrup Glacier has retreated 10 km over the past 60 years (Van As, 2010). A recent example of the retreat is the separation from the glacier of an island in 2014. In 2012 there was a narrow glacier connection, red arrow, with an island Tugtuligssup Sarqardlerssuua that is clearly not stable, based on narrowness and extensive crevassing, the connection remained in 2013 and was in 2014.
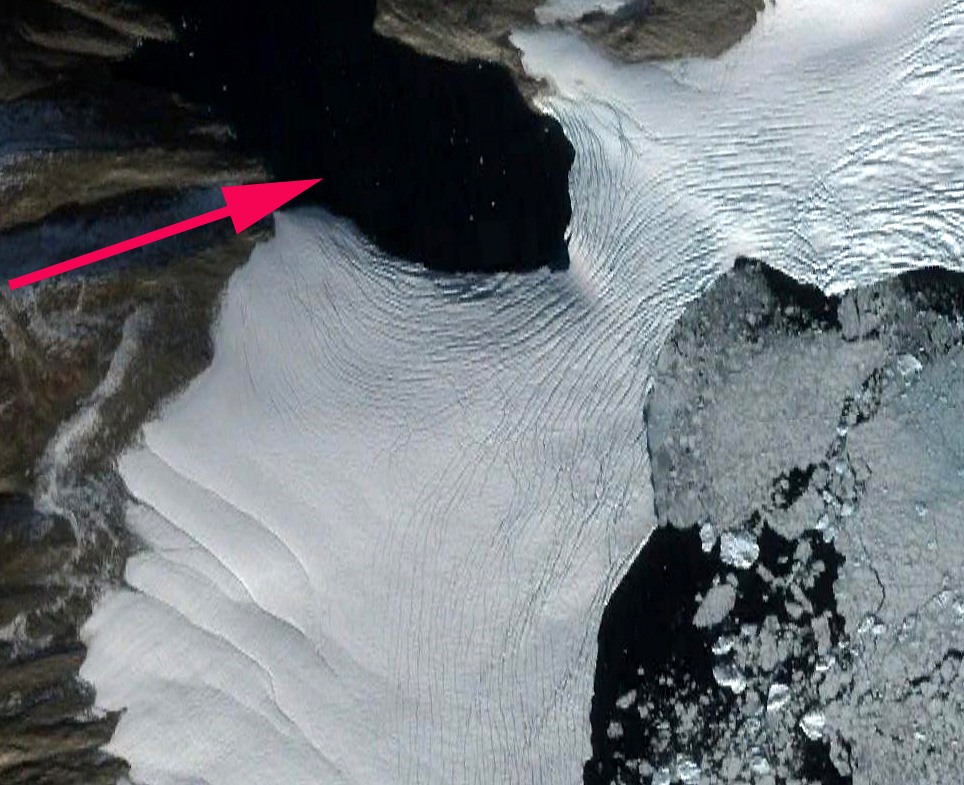
Google Earth 2012 image Cape Seddon/Tugtuligssup Sarqardlerssuua, how long will this connection last? Less than two years.

Landsat image comparison of 2013 and 2014 of Cape Seddon/Tugtuligssup Sarqardlerssuua separation from Steenstrup Glacier.

Image from Van As (2010).
McFadden et al (2011) noted several glaciers in Northwest Greenland; Sverdrups, Steenstrup, Upernavik, and Umiamako that had similar rapid thinning patterns of up to ~100 m a-1 since 2000. They further noted that thinning was not synchronous with Steenstrup and Sverdrups thinning fast from 2002 to 2005, Upernavik from 2005 to 2006, and Umiamako from 2007 to 2008. This is not exactly synchronous, but occurring within a few years is essentially synchronous in terms of glacier dynamics. Each glacier also had a coincident speed-up with a 20% acceleration for Steenstrup Glacier (McFadden et al, 2011). Kjer Glacier was noted as relatively stable until loss of connection with Red Head Peninsula in 2005 (Van As, 2010). This is a familiar pattern with thinning there is less friction at the calving front from the fjord walls and the fjord base, leading to greater velcoity. The enhanced flow leads to retreat and further thinning, resulting in the thinning and the acceleration spreading inland. The initial thinning comes from a combination of basal and surface melt. This has been the primary mechanism for increased velocity of outlet glacier of the Greenland Ice Sheet.
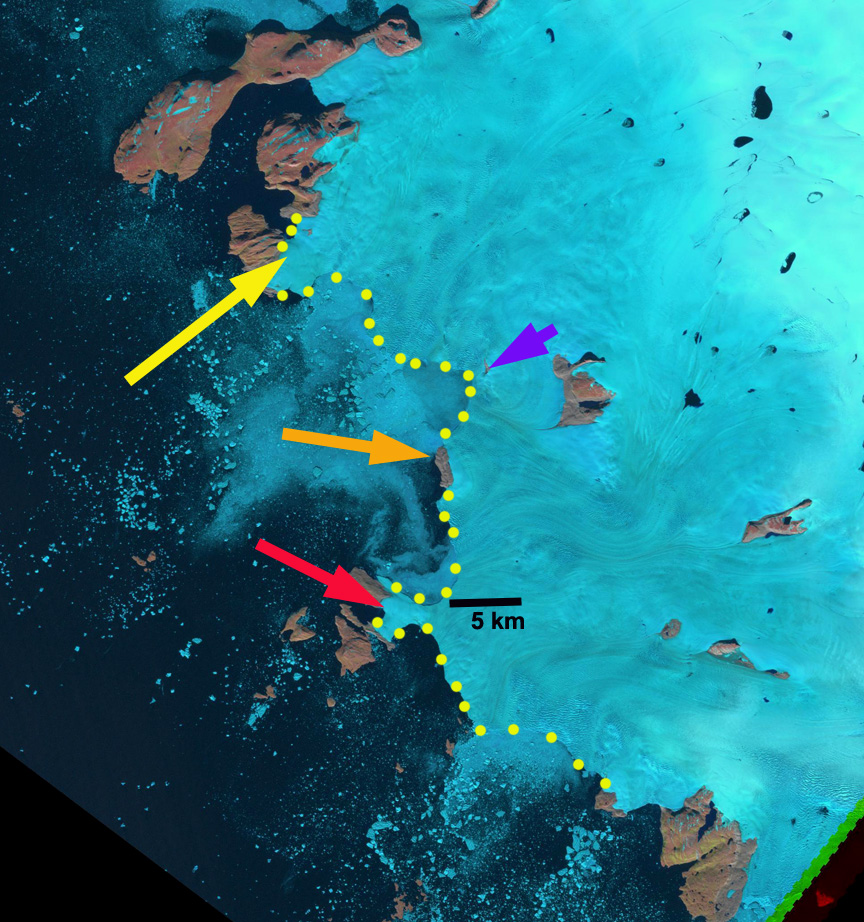
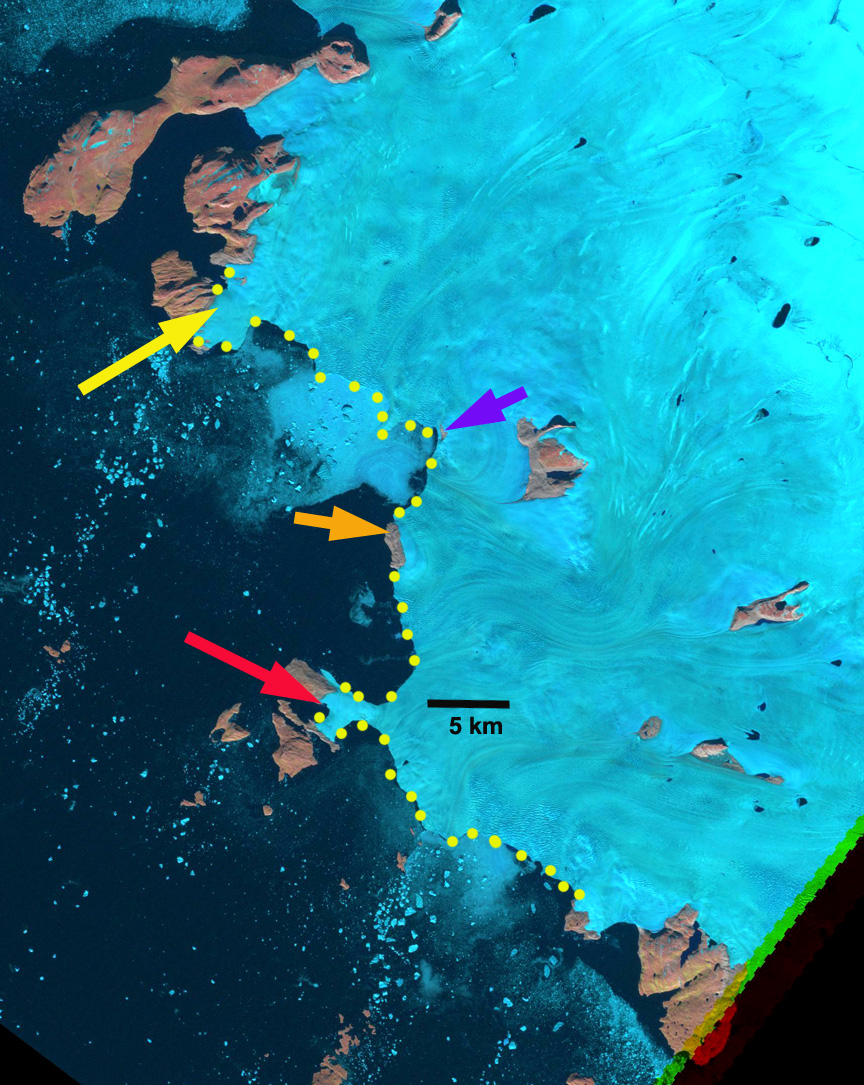
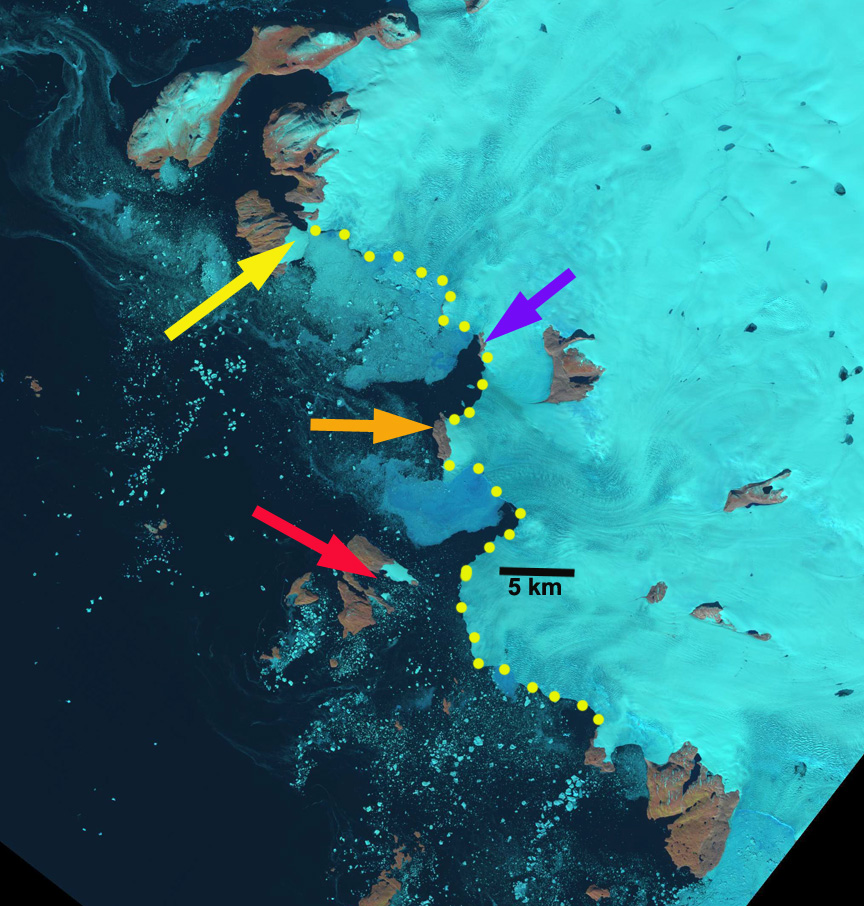
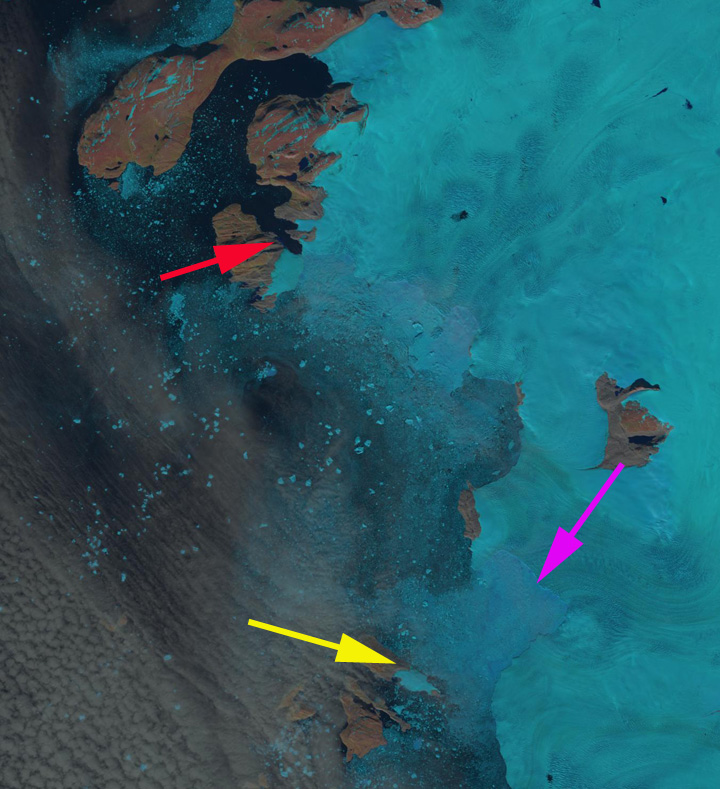
Here we examine Landsat images from 1999, 2013 and 2014 to identify changes of Steenstrup and Kjer Glacier. The yellow arrow indicates Red Head, which the glacier still reaches in 1999, though the connection is less than 2 km wide. The purple arrow indicates the ice front just north of Red Head that extends nearly due north to the next island at the icefront. The red arrow indicates the ice front of Steenstrup Glacier at Tugtuligssup Sarqardlerssuua. By 2013 the connection to Red Head has been lost, it is now an island, this occurred as noted by Van As (2010) in 2005. Retreat from Red Head is 6 km by 2013. There is a substantial embayment that develops, purple arrow southwest of an island still embedded in the icefront, indicating 4 km of retreat. North of this island that will soon lose it connection to the ice sheet, the embayment has expanded as well. The connection to the island at the north end of Kjer Glacier, has become much narrower since 1999 and will follow the route of Red Head and Tugtuligssup Sarqardlerssuua. In 2014 Steenstrup Glacier at the red arrow has separated from Tugtuligssup Sarqardlerssuua. The island west of the purple arrow still acts as a pinning point having stabilized the ice front here since 1975, but is now isolated in the same way as Red Head in 1999 and will soon be released from the glacier. From 2013 to 2014 the embayment is spreading inland and north.
The retreat here is coincident with the thinning and acceleration and follows the pattern of retreat and new island generation seen at Kong Oscar Glacier, Alison Glacier and Upernavik Glacier. The map of Greenland is continues to change at an accelerated rate, bottom image is a geologic Map from the Geological Survey of Denmark and Greenland. Red arrow again indicates Tugtuligssup Sarqardlerssuua.

1999 Landsat Image
2013 Landsat image

2014 Landsat image
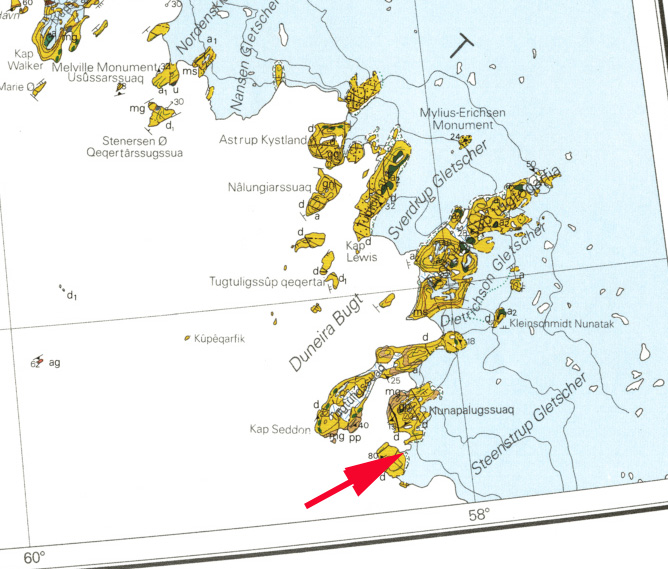
GEUS map of the region