Major Late July Meltdown on Lowell Glacier, Yukon

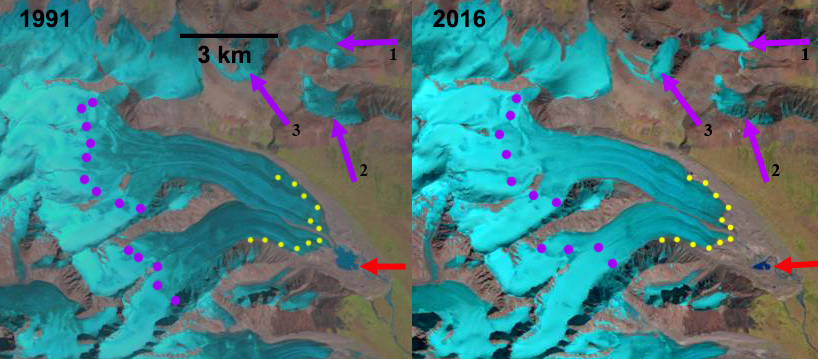
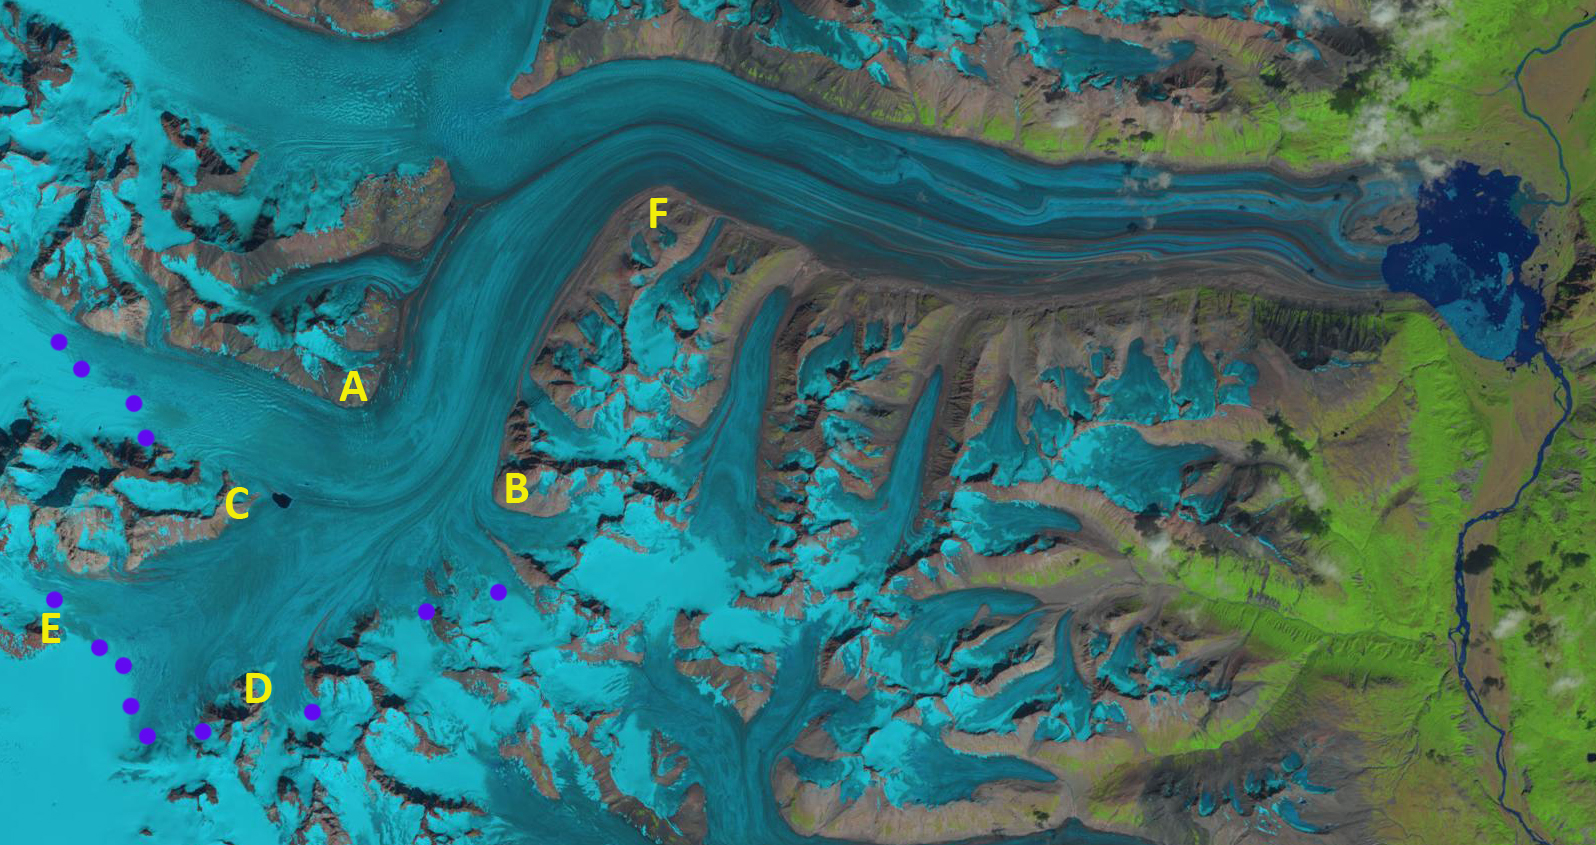
Lowell Glacier in Landsat images from 7/4, 7/26 and 8/11 with Sentinel images from 7/22 .  The snowline is shown with purple dots. Point A-F are fixed reference locations.  The snowline migrated upglacier 20 km and 300 m in elevation.  A significant snow swamp is between the yellow and purple dots on 7/26, that was not present on 7/22. 

The Lowell Glacier drains east from the St.Elias Range on the Yukon-Alaska border.  A sequence of images from July 4-Aug. 11 indicate the rapid snowline rise, with a particularly rapid transition from July 22-July 26.  During this period weather records from Haines Junction, Yukon indicate daily high temperatures of:  7/22=29.5 C, 7/23= 28.1, 7/24=26.8, 7/25=25.5, 7/26=25.1. This equates to project freezing levels above 4200 m each day.

(NASA Post follow up to this research)

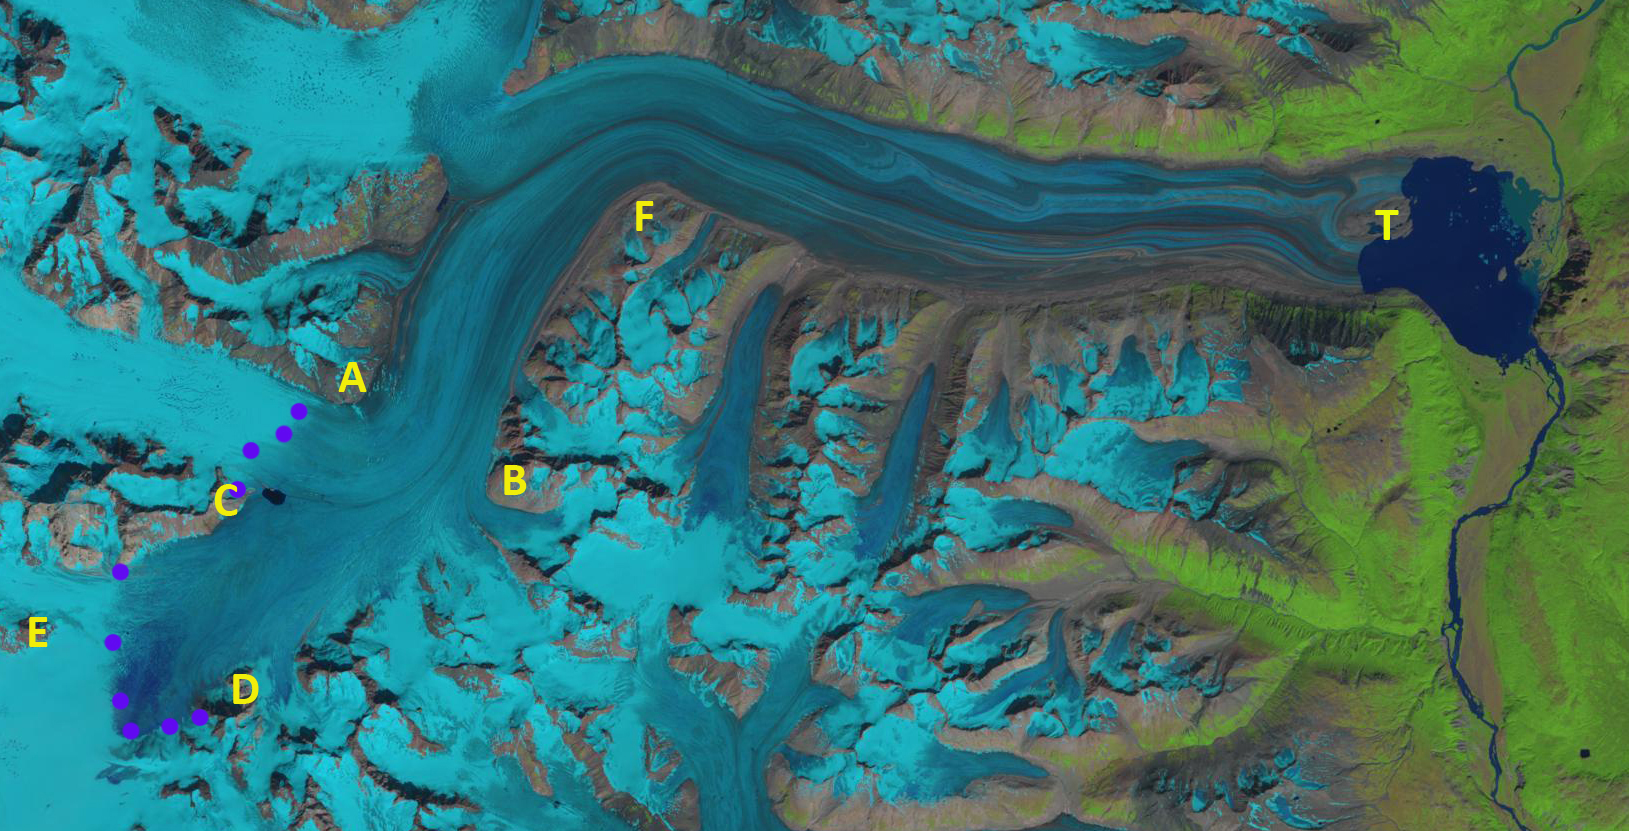
On July 4th the transient snowline on Lowell Glacier was near Point F at 1240 m.  By July 22 the transient snowline had moved 9 km upglacier to 1400 m between Point A and B. Just two days later the region from 1400-1560 m an area of 40+square kilometers was under rapid transition with the snowline rising and an area of slush developing, saturated snowpack, really a “snow swamp”.  By July 26th the slush line was at 1520 to 1560 m, with the slush indicated by a royal blue color distinguishing it from the graying blue bare ice or old firn, and the white blue snow from the previous winter than was not fully saturated with water.  It is unusual to develop such a large “snow swamp” so quickly, this was accomplished by the rapid ablation due to the high temperatures. By Aug. 11th the transient snowline had shifted above this slush zone, with all of the saturated snow having ablated away, to Point E at 1560-1600 m.  The snowline in late summer of 2010, 2015 and 2017 also reached near Point E at an elevation of 1520-1600 m.  In 2015 and 2017 a supraglacial lake developed just east of Point C.  Another good example of a large snow swamp is in Svalbard on Hinlopenbreen. Taku Glacier, AK had the highest snowline in over 70 years of observation in 2018.

If a good image is acquired in September I will add to this post.  The consistently high late summer snowline, above 1500 m cannot sustain the Lowell Glacier, which will drive further retreat.  The retreat of this glacier be both enhanced and mitigated by surges, during the surge cylcle.  The glacier has surged five times since 1948 (Bevington and Copland, 2014).  The surge cycle has been getting shorter and will not offset the overall mass loss that will drive retreat, just as has occurred on Svalbard glaciers.

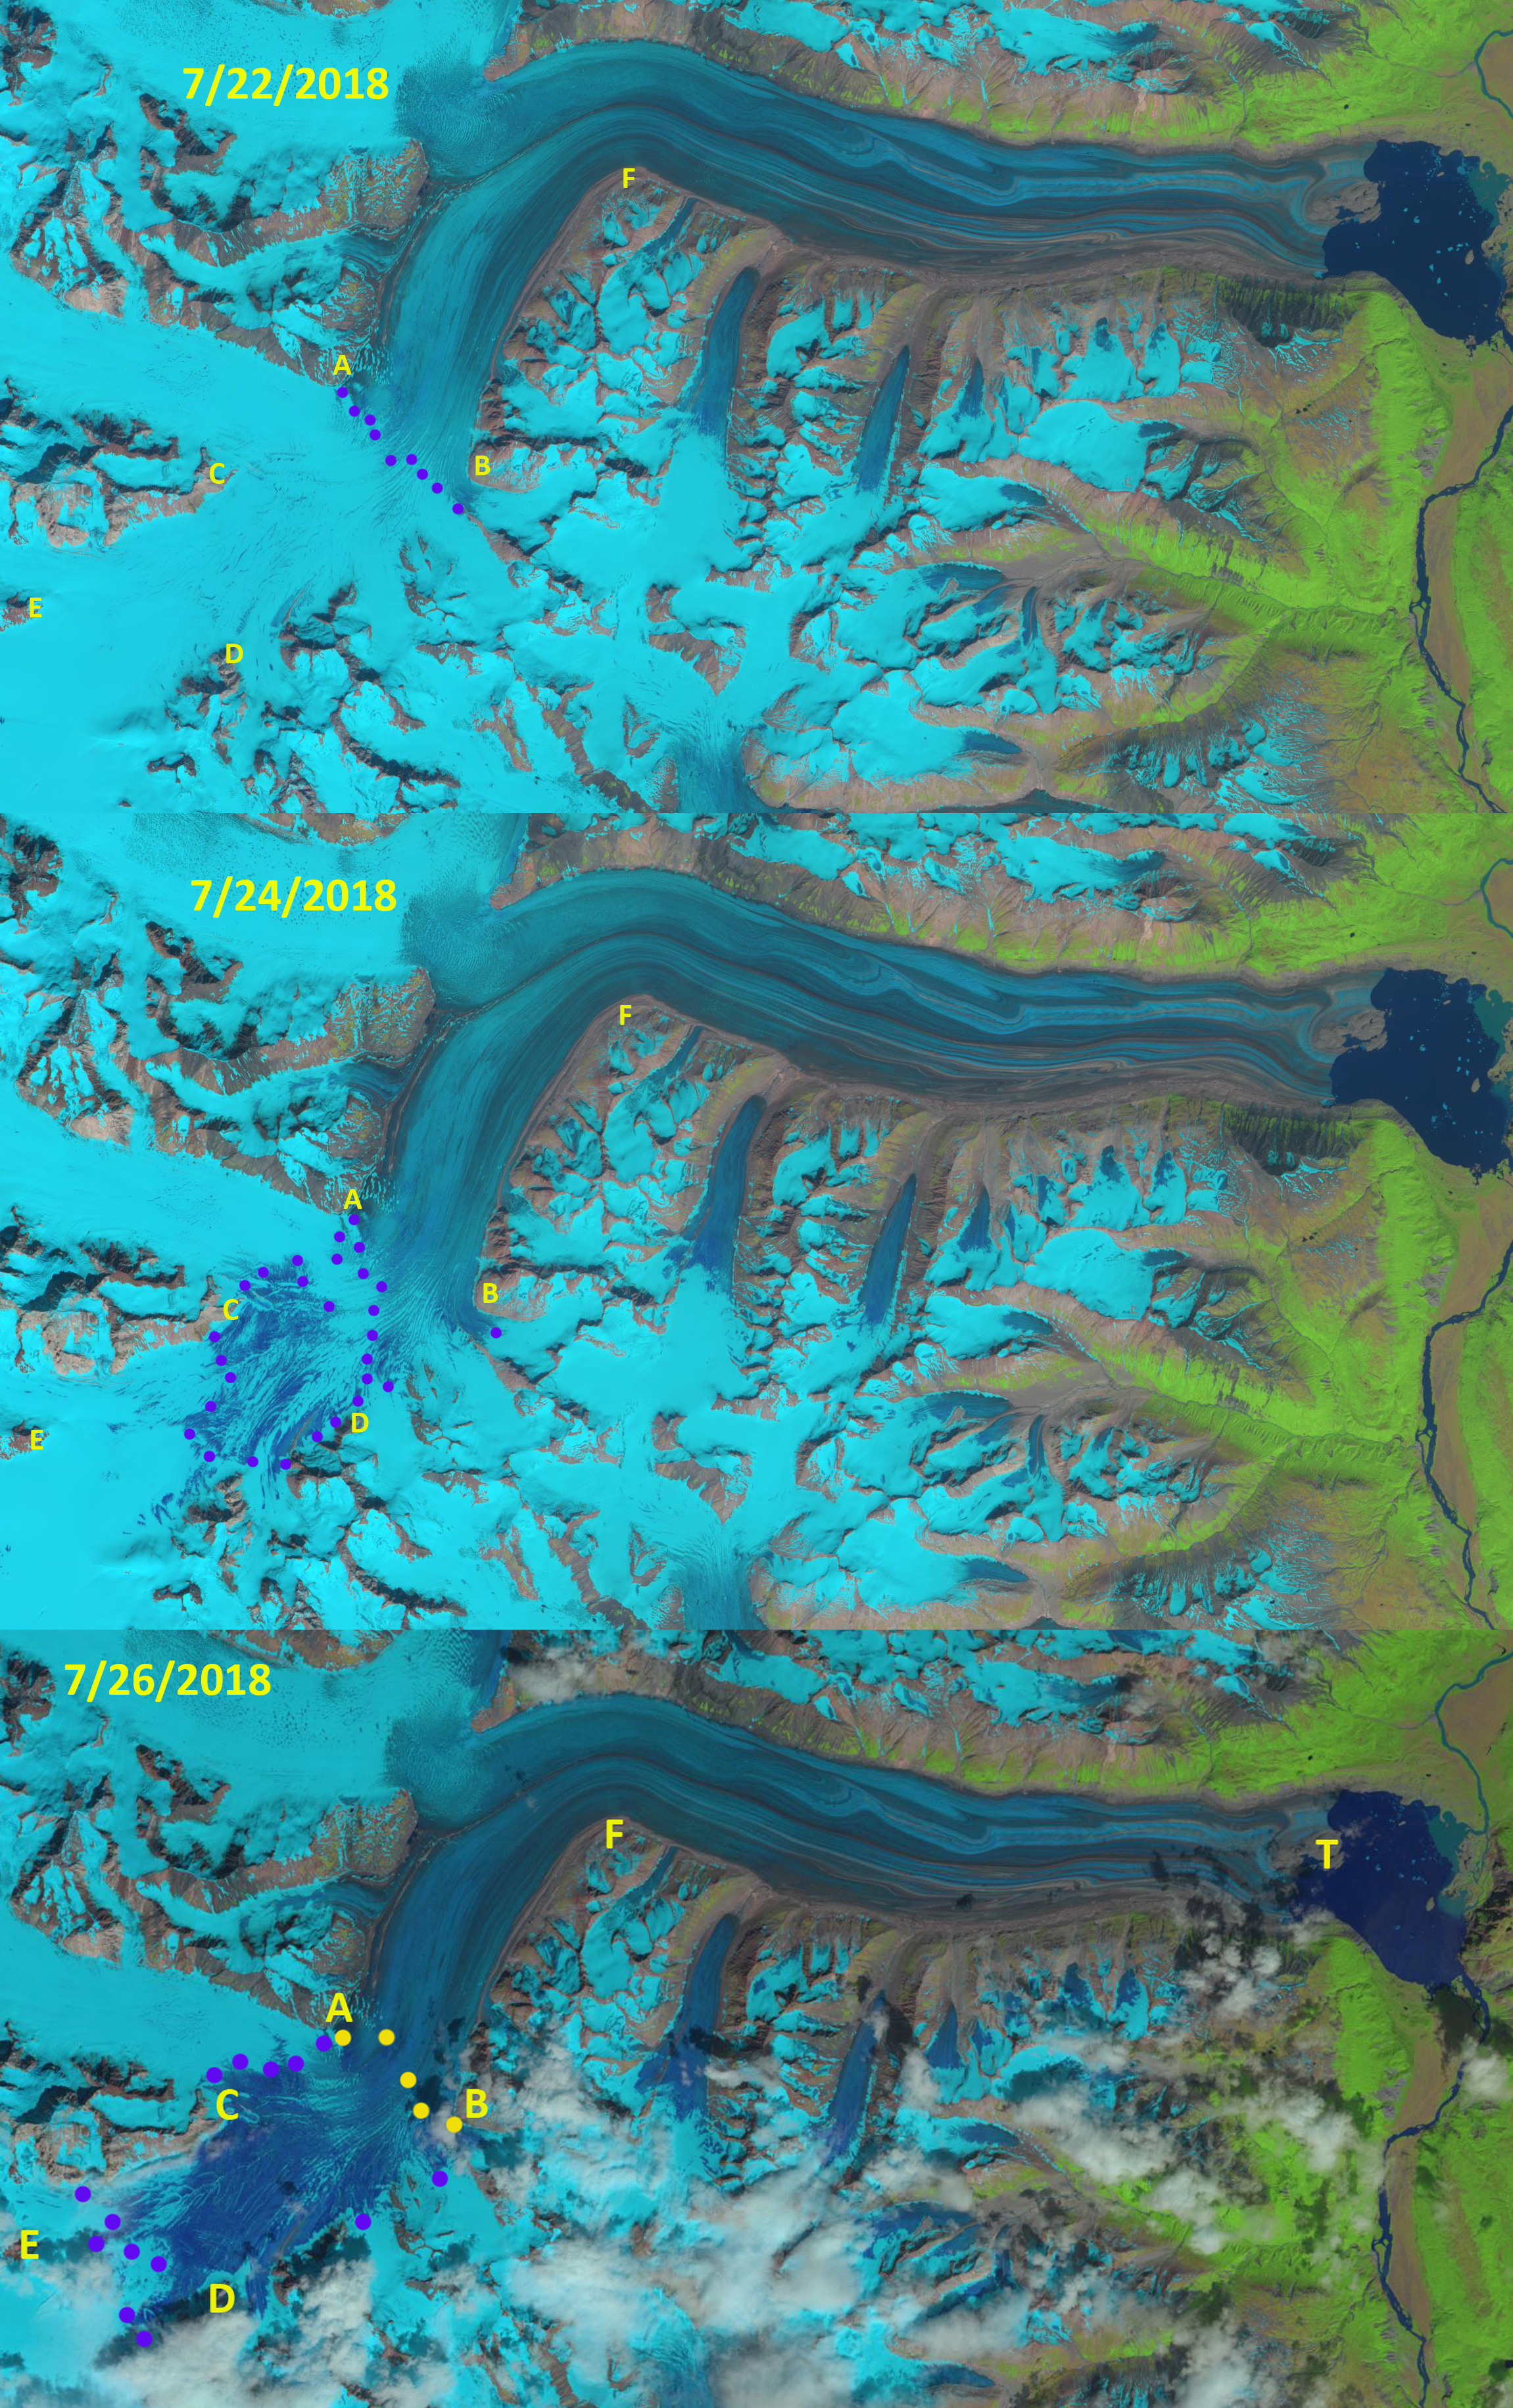
Sentinel from 7/22, 7/24 and Landsat from 7/26 indicating the change in snowline and snow swamp development, purple dots.  T indicates terminus of glacier.

Landsat image from 8/8/2017 indicating snowline near Point D and E at m on Lowell Glacier.

Landsat image from 8/3/2015 indicating snowline near Point D and E at m on Lowell Glacier.

Landsat image from 9/14/2010 indicating snowline near Point D and E at m on Lowell Glacier.


Potanin Glacier Area, Mongolia Retreat & Fragmentation

Potanin Glacier, Mongolia comparsion in 1991 and 2016 Landsat images.  Yellow dots indicate 2016 terminus, purple dots the snowline, red arrow the southeast margin of proglacial lake, and purple arrows peripheral alpine glaciers that are fragmenting. 

Potanin Glacier is in the Altay Mountains of the Tavan Bogd region in western Mongolia, and is the nations longest glacier.  The glacier ranges from 2800 to 4000 m a.s.l. and is length is about 11 km long. Konya et al (2008) note the ELA was roughly estimated as 3600 m. The conclude that given the area altitude distribution this indicates the  mass balance of Potanin Glacier is negative and it is probable that the glacier is experiencing a negative trend. Konya et al (2010) observed that ablation calculated by an equation using the measured radiation showed good correlation with observed daily ablation, whereas a degree-day model had good correlation with cumulative observed ablation.  This region has experienced a substantial warming of  1.6 C in the last sixty year, which has led to a 4.2% decrease in glacier area from 1989 to 2009 in the Tovan Bogd region (Krumwiede et al, 2014). A 2016 expedition to the area led by Aaron Putnam, UMaine Climate Change Institute provides an excellent view of the region (Climate Change, Northwestern, 2016).  There expedition was focused on assessing the timing of ice loss at the end of the last ice age. This warming abruptly ended the last ice age and Putnam’s team was looking for the switches that initiate such climate events.

Here we examine Landsat imagery from 1991 to 2016 to identify changes in Potanin Glacier and neighboring glaciers. In 1991 Potanin Glacier terminates near a 500 m diameter proglacial lake, red arrow.  The snowline is at 3600 m, purple dots. Three peripheral alpine glaciers at purple arrows 1-3 are each single contiguous glaciers. In 1996 the proglacial lake remains, the snowline is at 3500 m and the peripheral alpine glaciers remain contiguous. By 2014 the proglacial lake is 30% of its former size, with the southeastern margin of the lake remains the same. The snowline is at 3500 m in 2014.  In 2016 the three neighboring alpine glaciers have fragmented into multiple sections. Each section remaining has also lost significant area.  This is indicative of negative mass balance in the region during the period.  The smaller glaciers are more responsive to climate and subsequent mass balance change.  The yellow dots on the 1991 and 2016 image represent the 2016 margin. The margin has experience modest retreat averaging 250 m from 1992-2016. At Point 1 the glacier has fragmented into three sections since 1991 with the southern most nearly gone.  At Point 2 the glacier has separated into two parts with the eastern one largely gone. The continued fragmentation of smaller glaciers will lead to their disappearance in the coming decades.  The large supraglacial streams that are present indicate the limited velocity and high melt rates in the terminus region, see below. The mass balance of the World Glacier Monitoring Service Maliy Aktru, in the Russian Altay has been negative in all but five years since 1990. 

Potanin Glacier, Mongolia comparsion in 1996 and 2014 Landsat images. Purple dots the snowline, red arrow the southeast margin of proglacial lake, and purple arrows peripheral alpine glaciers that are fragmenting.


Streams channels on surface of Potanin Glacier in Google Earth image. The extent and size indicates limited velocity and high ablation.