34th Annual Field Program NORTH CASCADE GLACIER CLIMATE PROJECT 2017


2016 Field Season Video

NORTH CASCADE GLACIER CLIMATE PROJECT 2017

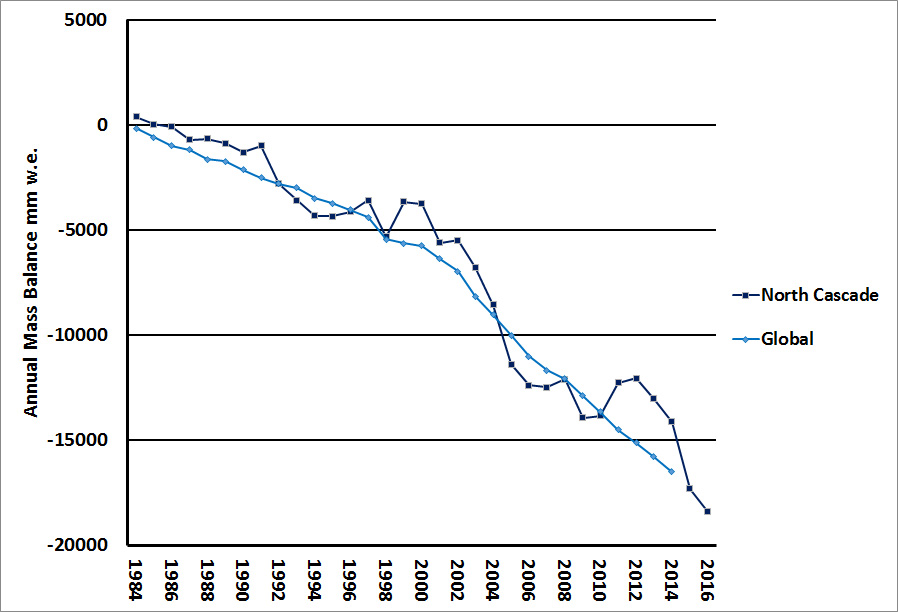
For the thirty fourth consecutive summer it is time to head into the field to monitor the continued response of North Cascade glaciers to climate change.  In 1984 when I began this program we selected 10 key glaciers to monitor.  Two of these have now disappeared.  All the glaciers have retreated extensively and lost considerable volume.  The mass balance loss is 19 m of water equivalent thickness, which is over 20 m of ice thickness loss on glaciers that averaged less than 75 m thick. This is significant with 25-30% of their entire volume lost. This project looks at the implications of the glacier loss as we complete an annual inventory of ice worms on Sholes Glacier, mountain goats on Ptarmigan Ridge region and monitor runoff all summer below Sholes Glacier with the Nooksack Indian tribe. 

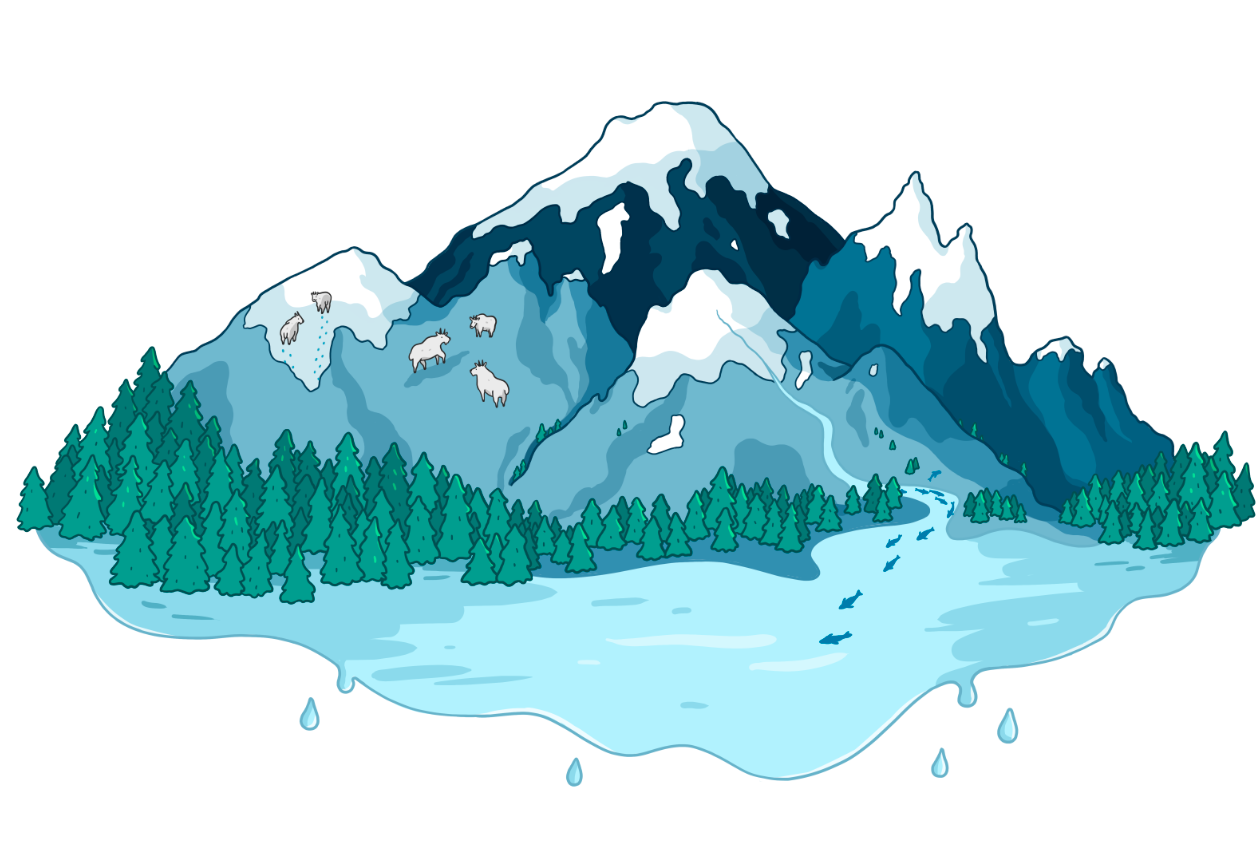
Illustration of research (Megan Pelto and Jill Pelto)

The result of volume loss and area loss is that despite higher melt rates, the reduction in area of melting glaciers has led to a decline in glacier runoff in the region. The reduced runoff effects salmon, hydropower and irrigation. Details of the runoff impacts are detailed in a Book “Climate Driven Retreat of Mount Baker Glaciers and Glacier Runoff and summarized in Salmon Challenges from the Glaciers to the Salish Sea.

The focus will be on mass balance observations, longitudinal profiles and terminus observations. For Mount Baker, Washington the winter freezing level was much lower than the previous two winters, and was 100 m below the long term mean. The snowpack on April 1st snowpack was 110% of normal, by June 10th, the snowpack is trending down steeply, but remained just above average.  Since then a persistent dry period and the impending heat wave that begins today, Aug. 1 has led to rapid snow loss.  The most recent  comparable year is 2009, which featured a good winter snowpack and very warm mid to late summer conditions. We will first travel north to Mount Baker and the Easton Glacier.    Of the 40 glacier in the World Glacier Monitoring Service Reference glacier list we have two Columbia and Rainbow, as soon as Easton Glacier has 30 years, the minimum requirement it will be added, that is in 2019. The field team consists of Mauri Pelto, 34th year, Jill Pelto, UMaine for the 9th year, Anthony Himmelberger, Clark University 1st year.  Tom Hammond, 14th year will join us for a selected period as will Pete Durr, Mt. Baker Ski Area, 2nd year.   We will report on our findings in a month. Field photos will be posted periodically on Twitter.

Measuring terminus change and snowpack thickness in 2016

Aug.   2:  Hike into Easton Glacier
Aug.   3:  Easton Glacier
Aug.   4:  Easton Glacier
Aug.   5:  Hike Out Easton Glacier, Hike in Ptarmigan Ridge
Aug.   6:  Sholes Glacier
Aug.   7:  Rainbow Glacier
Aug.   8:  Sholes Glacier
Aug.   9:  Hike out and into Lower Curtis Glacier
Aug. 10:  Lower Curtis Glacier
Aug. 11: Hike out Lower Curtis Glacier- Hike in Blanca Lake
Aug. 12:  Columbia Glacier
Aug. 13:  Columbia Glacier
Aug. 14:  Hike out Columbia Glacier; Hike in Mount Daniels
Aug. 15:  Ice Worm Glacier
Aug. 16:  Daniels and Lynch Glacier
Aug. 17:  Ice Worm Glacier, Hike out Mount Daniels-Hike out-

Conducting Long Term Annual Glacier Monitoring

2015 time lapse easton

Easton Glacier in 1990, 2003 and 2015 from same location. Below Painting by Jill Pelto of crevasse assessment using a camline.

camline

This is the story of how you develop and conduct a long term glacier monitoring program.  We have been monitoring the annual mass balance of Easton Glacier on Mount Baker, a stratovolcano in the North Cascade Range, Washington since 1990.  This is one of nine glaciers we are continuing to monitor, seven of which have a 32 year long record. The initial exploration done in the pre-internet days required visiting libraries to look at topographic maps and buying a guide book to trails for the area.  This was followed by actual letters, not much email then, to climbers who had explored the glacier in the past, for old photographs.  Armed with photographs and maps we then determined where to locate base camp and how to access the glacier.  The first year is always a test to make sure logistically you can reach enough of the glacier to actually complete the mass balance work with a sufficiently representative network of measurement sites.  The second test is if you can stand the access hike, campsite, and glacier navigation, to do this every year for decades; if the answer is no, move on.  That was the case on Boulder Glacier, also on Mount Baker:  poor trail conditions and savage bugs, were the primary issue. Next we return to the glacier at the same time each year, completing the same measurements each year averaging 210 measurements of snow depth or snow melt annually.  This occurs whether it is gorgeous and sunny, hot, cold, snowy, rainy, or recently on this glacier dealing with thunderstorms.  You wake up, have your oatmeal and coffee/cider/tea, and get to work.  Lunch on the snow features bagels, dried fruit, and trail mix. Happy hour features tang or hot chocolate depending on the weather.  It is then couscous, rice, pasta or quinoa for dinner, with some added dried vegetable or avocado.  The sun goes behind a mountain ridge and temperatures fall, and the tent is the haven until the sun returns.  Repeat this 130 times on this glacier and you have a 25 year record. During this period the glacier has lost 16.1 m of water equivalent thickness, almost 18 m of thickness.  For a glacier that averaged 70 m in thickness this is nearly 25% of the volume of the glacier gone.  The glacier has not maintained sufficient snow cover at the end of the summer to have a positive balance, this is the accumulation area ratio, note below.  The glacier has retreated 315 m from 1990-2015.  This data is reported annually to the World Glacier Monitoring Service.  The glacier has also slowed its movement as it has thinned, evidenced by a reduction in number of crevasses. During this time we have collaborated with researchers examining the ice worms, soil microbes/chemistry, and weather conditions on the ice. This glacier supplies runoff to Baker Lake and its associated hydropower projects.  Our annual measurements here and on Rainbow Glacier and Lower Curtis Glacier in the same watershed provide a direct assessment of the contribution of glaciers to Baker Lake.  The glacier is adjacent to Deming Glacier, which supplies water to Bellingham, WA. The Deming is too difficult to access, and we use the Easton Glacier to understand timing and magnitude of glacier runoff from Deming Glacier.

The glacier terminates at an elevation of 1650 m, but thinning and marginal retreat extends much higher.  A few areas of bedrock have begun to emerge from beneath the ice as high as 2200 m. The changes in ice thickness are minor above 2500 m, indicating this glacier can retreat to a new equilibrium point with current climate.

Mass balance, terminus and supra glacial stream assessment are illustrated in the video, Filmed by Mauri Pelto, Jill Pelto, Melanie Gajewski, with music from Scott Powers.

easton 2010
Mass balance Map in 2010 of Easton Glacier used in the field for reference in following years. 

easton aar

Accumulation Area Ratio/Mass balance relationship for Easton Glacier