North Cascade Glacier Accumulation Season 2025/26

View from Heather Meadows to Table Mt on May 2, 2026 (Jill Pelto photo)

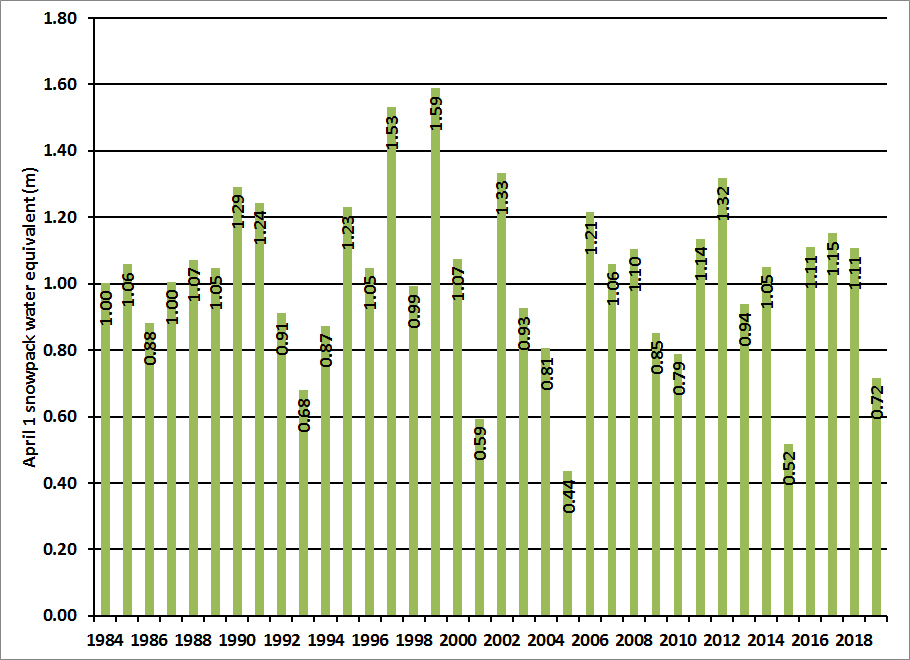
Since 1984 we have measured glacier mass balance on North Cascade glaciers every year. Mass balance is the difference between accumulation (income) and melt (expenses). The accumulation season typicallys ends around May 1. In 2026 it ended on April 19.

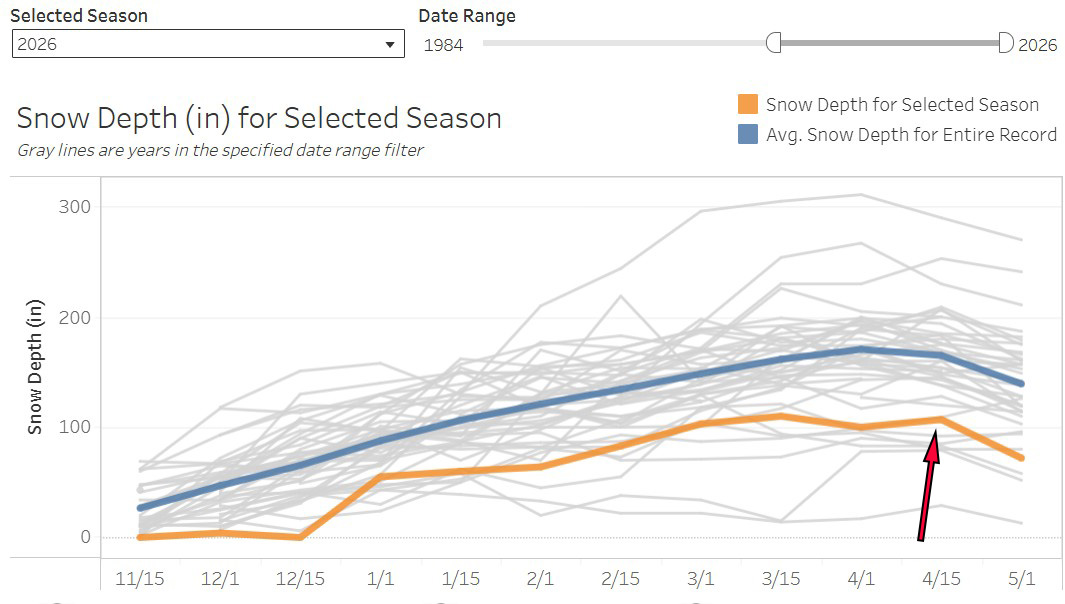
In early December snowpack was average above 1500 m (5000 feet) and limited below. The region was then impacted by a historic atmospheric river from Dec. 8-12. that led to flooding and landslides closing I-90 and Highway 2. Snowpack was completely lost at most locations below 1500 m including the Mount Baker station in Heather Meadows (1285 m). Above 1500 m at Lyman Lake (1825 m) SWE increased by 15 cm, which was 50% of the 30 cm of precipitation that fell in this period. The last half of December snow depth increased from 0 to 1.5 m at Heather Meadows. Snowpack built to 1.2 m w.e. at Lyman Lake by March 15, and then hovered around this peak until mid-April. At Heather Meadows snowpack depth peaked at 2.8 m on March 15th and was at 2.7 m on April 15th. This April 15th represented the maximum snowpack for elevations at 1500 m and above. The snowpack was less than 50% of normal below 1800 m. Above 2000 m warm wet winter events did deliver snowfall that was rain below and the situation is likely better. Working with Snowgoat Skimo as they prepare for the Kulshan Randoneee has noted snowpack of over 6 m at the 2000 m level.

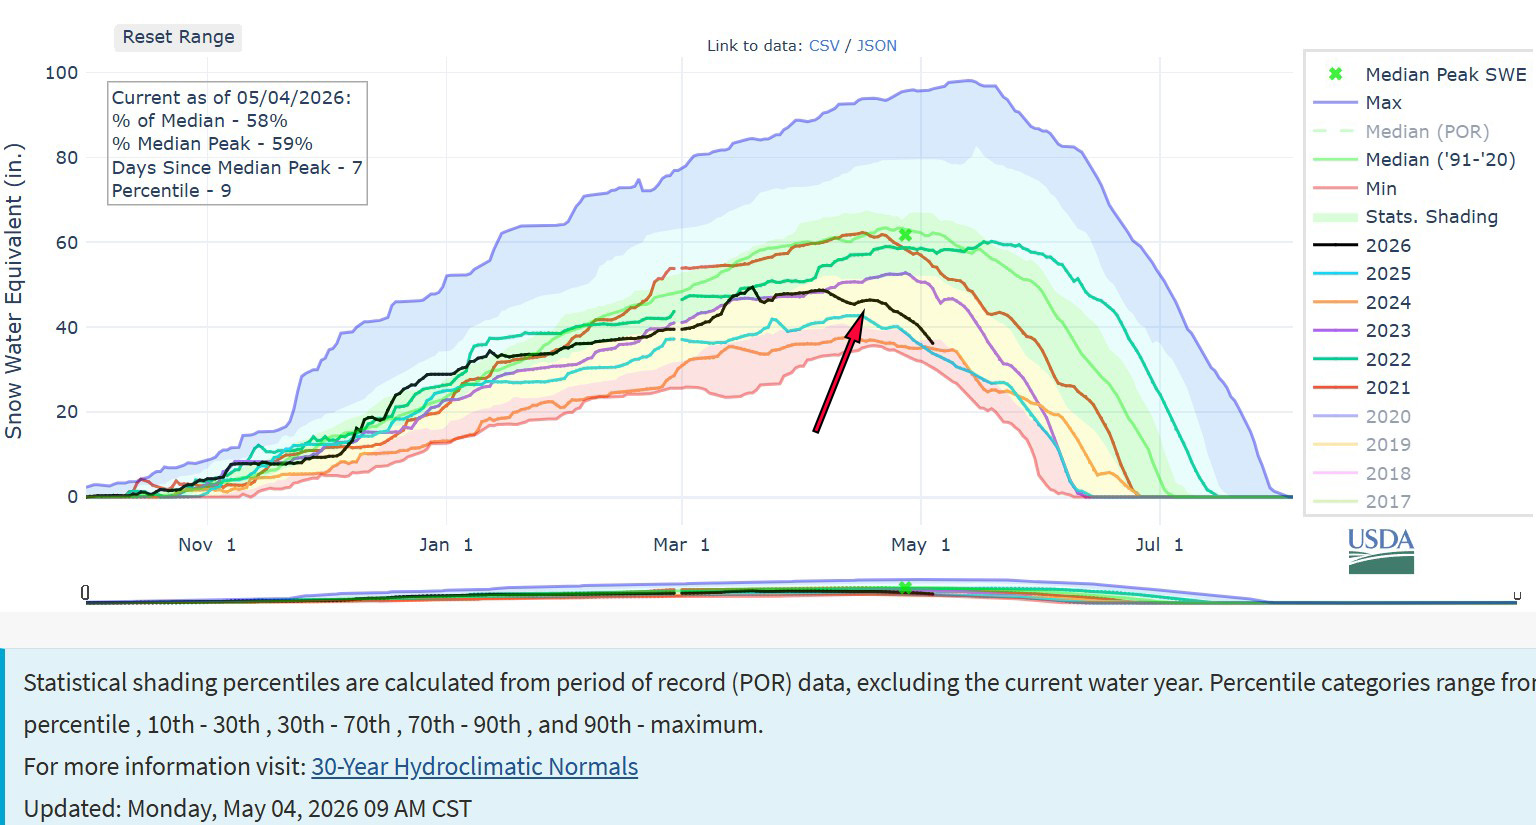
The transition to melt season was rapid with a particularly warm period from April 26-May 4 has led to rapid melt off of snowpack. At Lyman Lake a third of the snowpack was lost by May 8th. At Heather Meadow 50% of snowpack depth was lost by May 8th.

Mount Baker snow depth station indicating loss of snow in December atmospheric river, then rapid development and finally the unusually rapid drop in late April. WSCO graph.


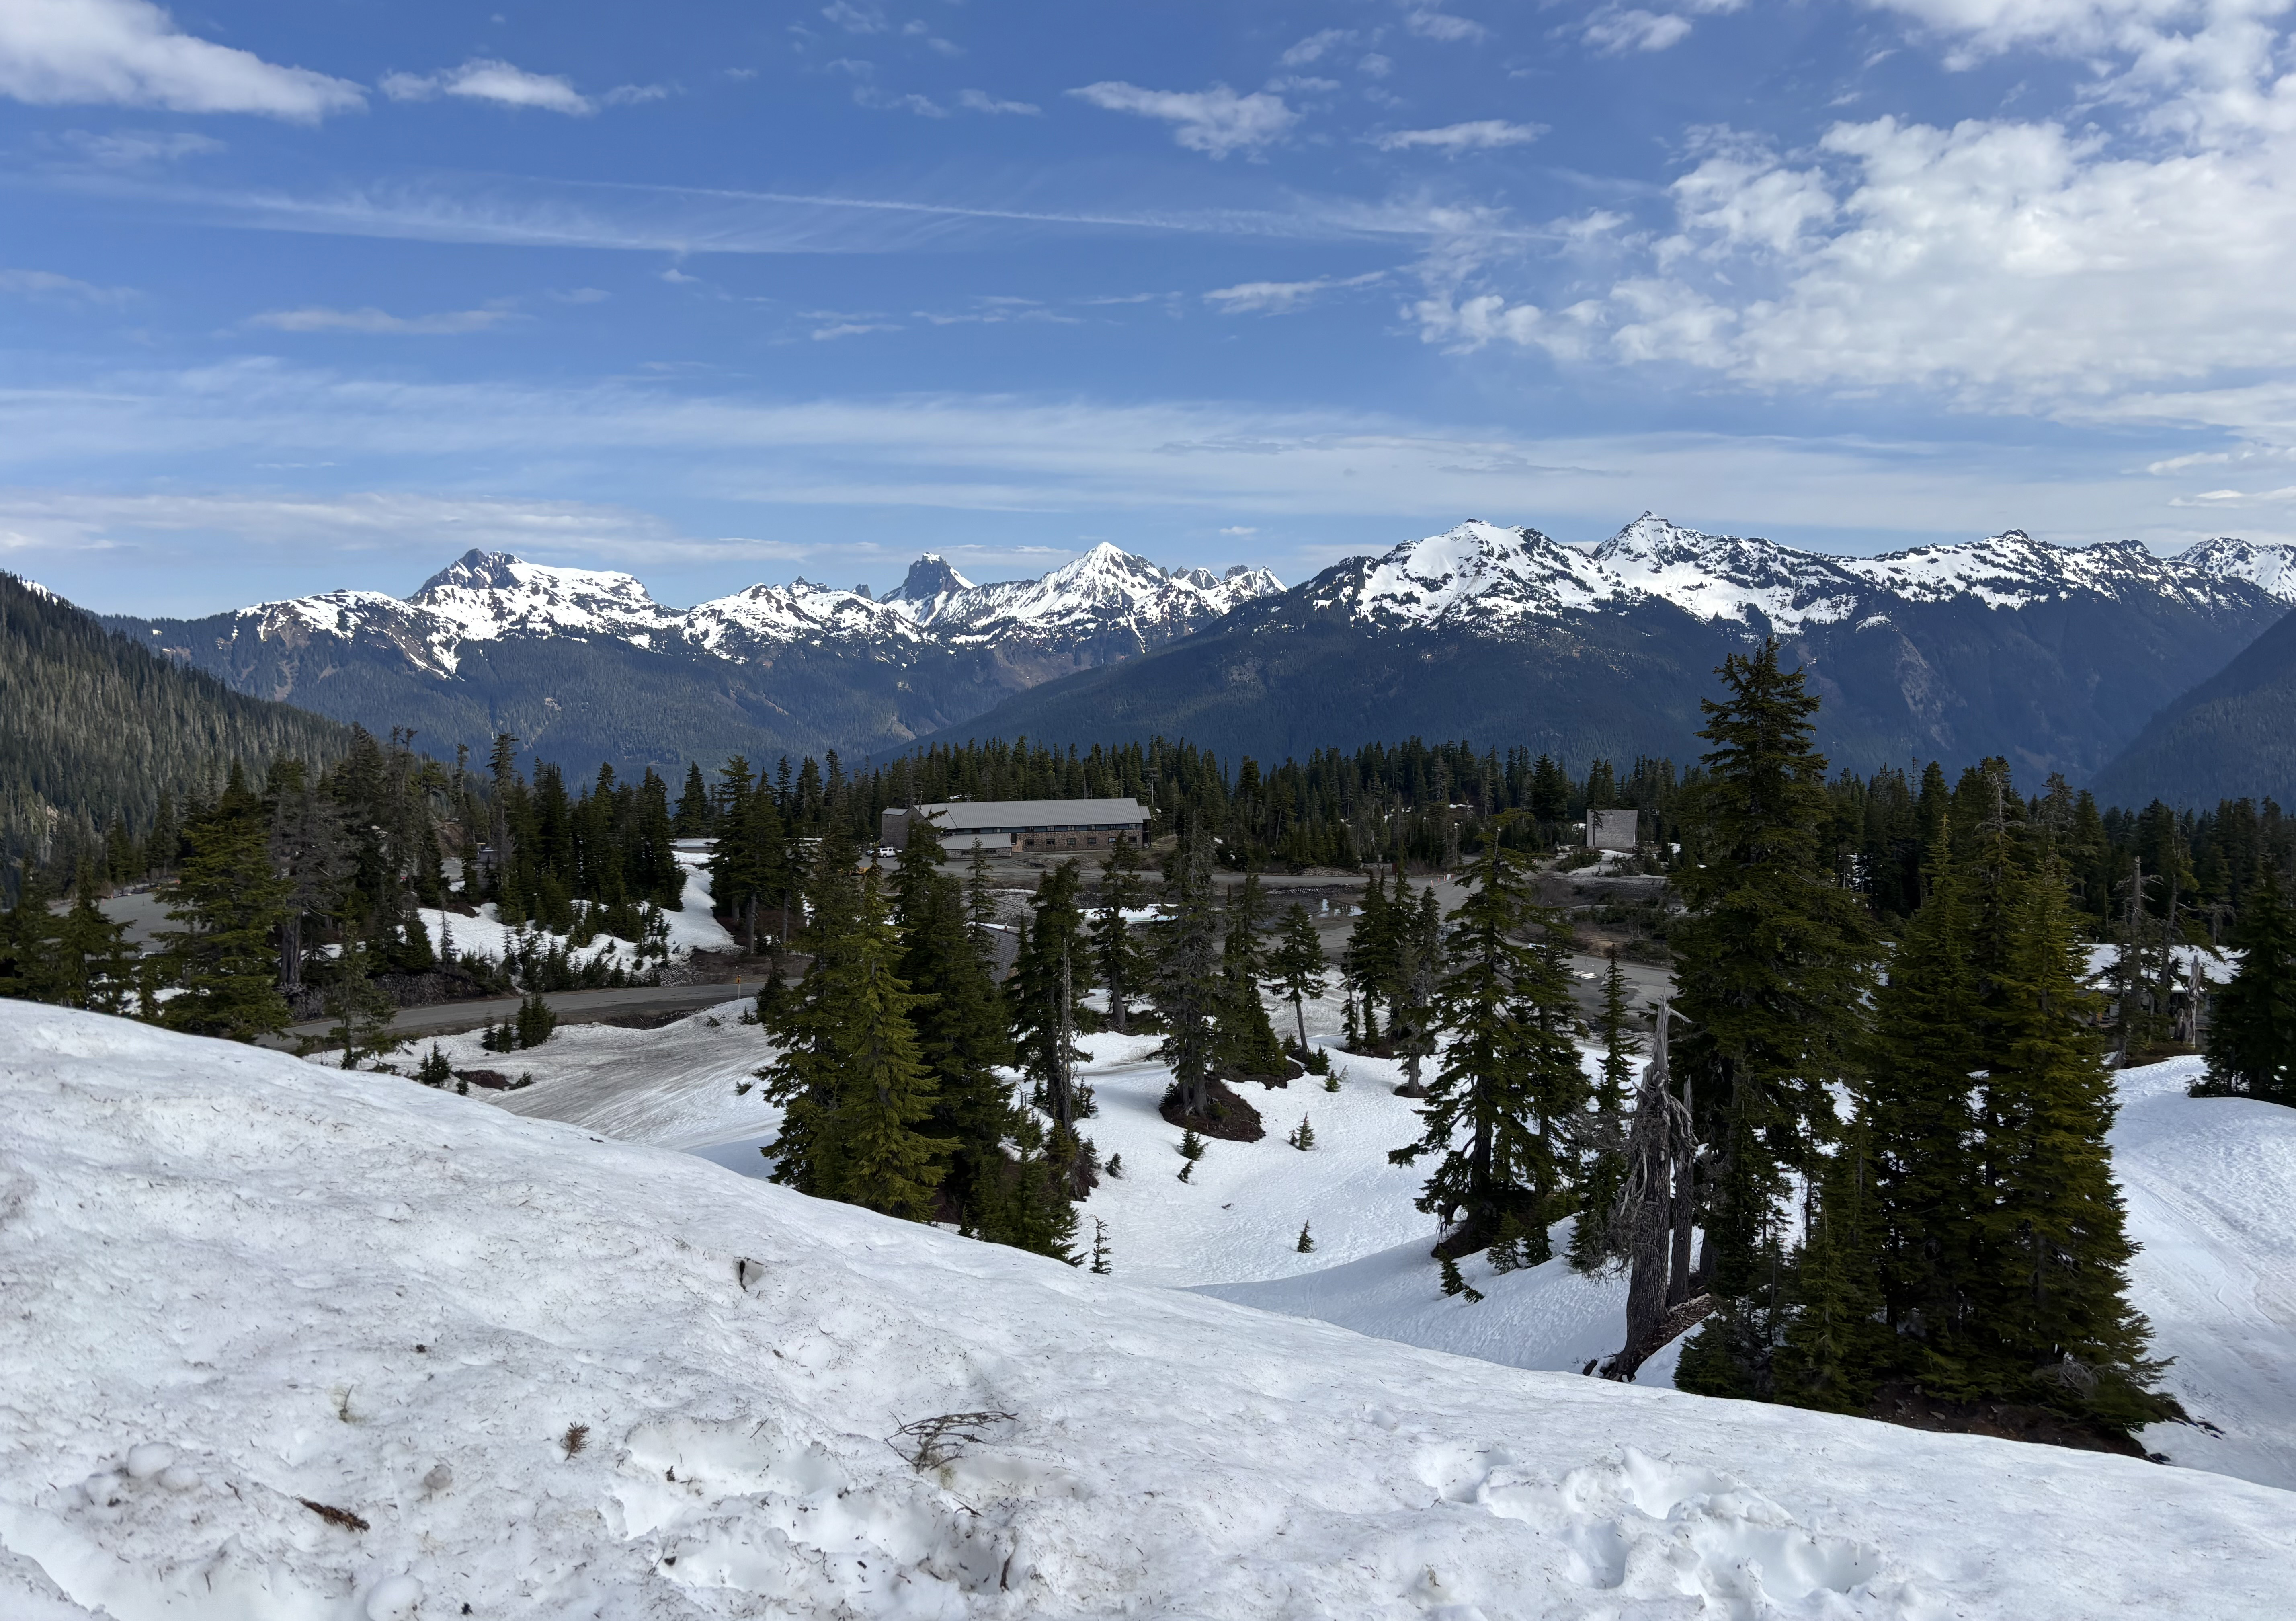
View toward lower Heather Meadows and Baker ski area-snowline above 1200 m on 5-2-26.-where the snowpack is already thin. (Jill Pelto photo)

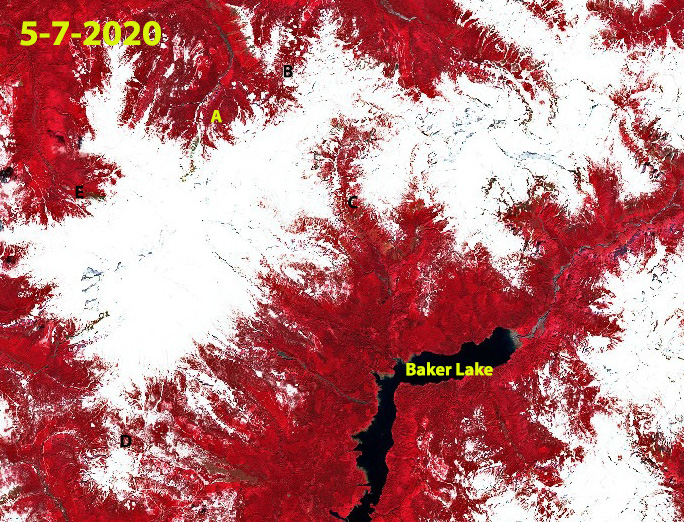
Sentinel Image from 5-7-2020 a normal snow year-snow line 850 m.

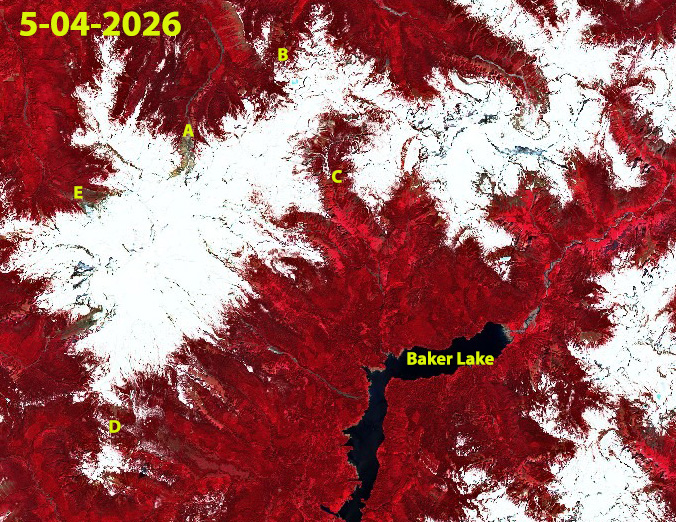
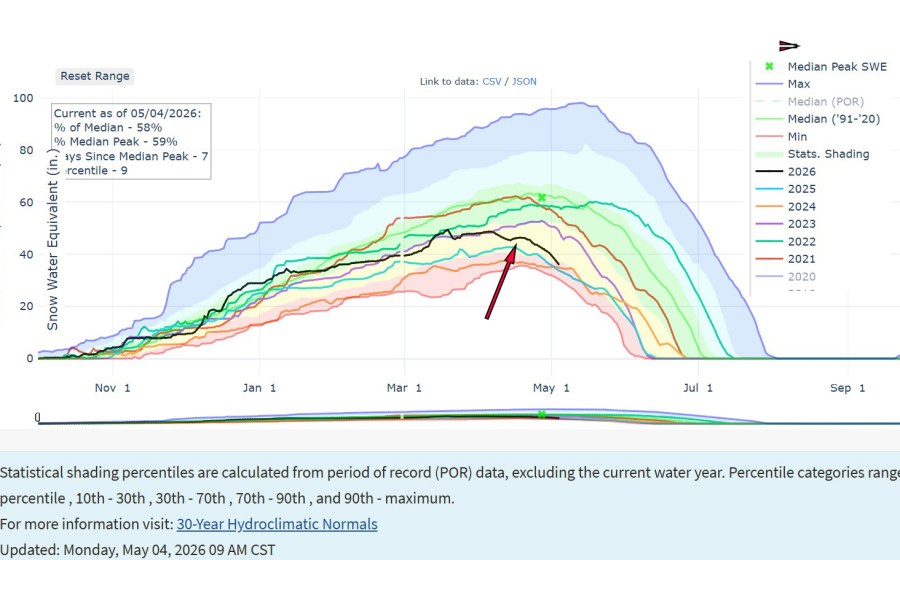
Sentinel image from 5-4-2026 illustrating regional snow line at 1200 m. The limited winter snowpack indicates that in 2026 we have a low accumulation/income for glaciers and melt/expenses already underway. Coleman Glacier terminus (E) is already exposed ice the first week in May. We will be in the field this summer to measure the details. We are expecting more bare ice and rockfall during our work.

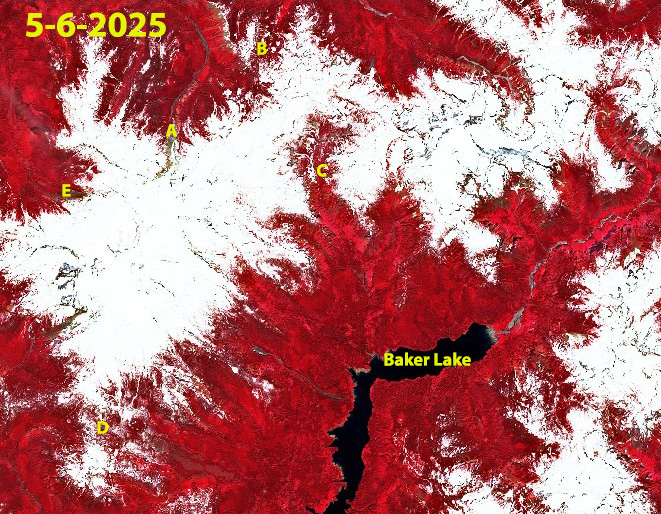
Sentinel image from 5-6-2025 snow cover- snow line 975 m.

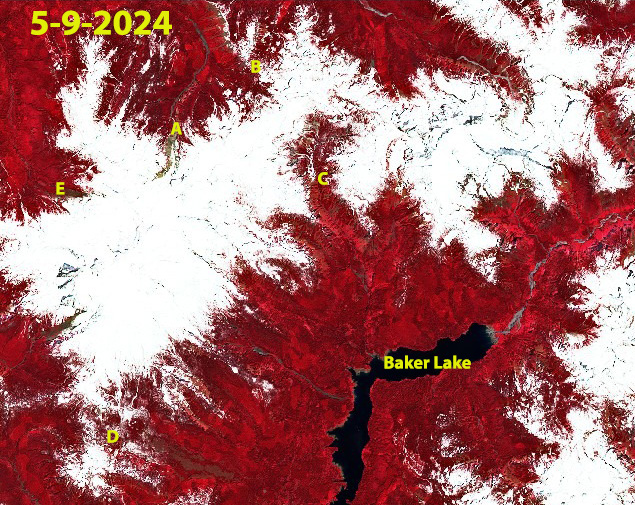
Sentinel image from 5-9-2024 with snow line at 975 m.

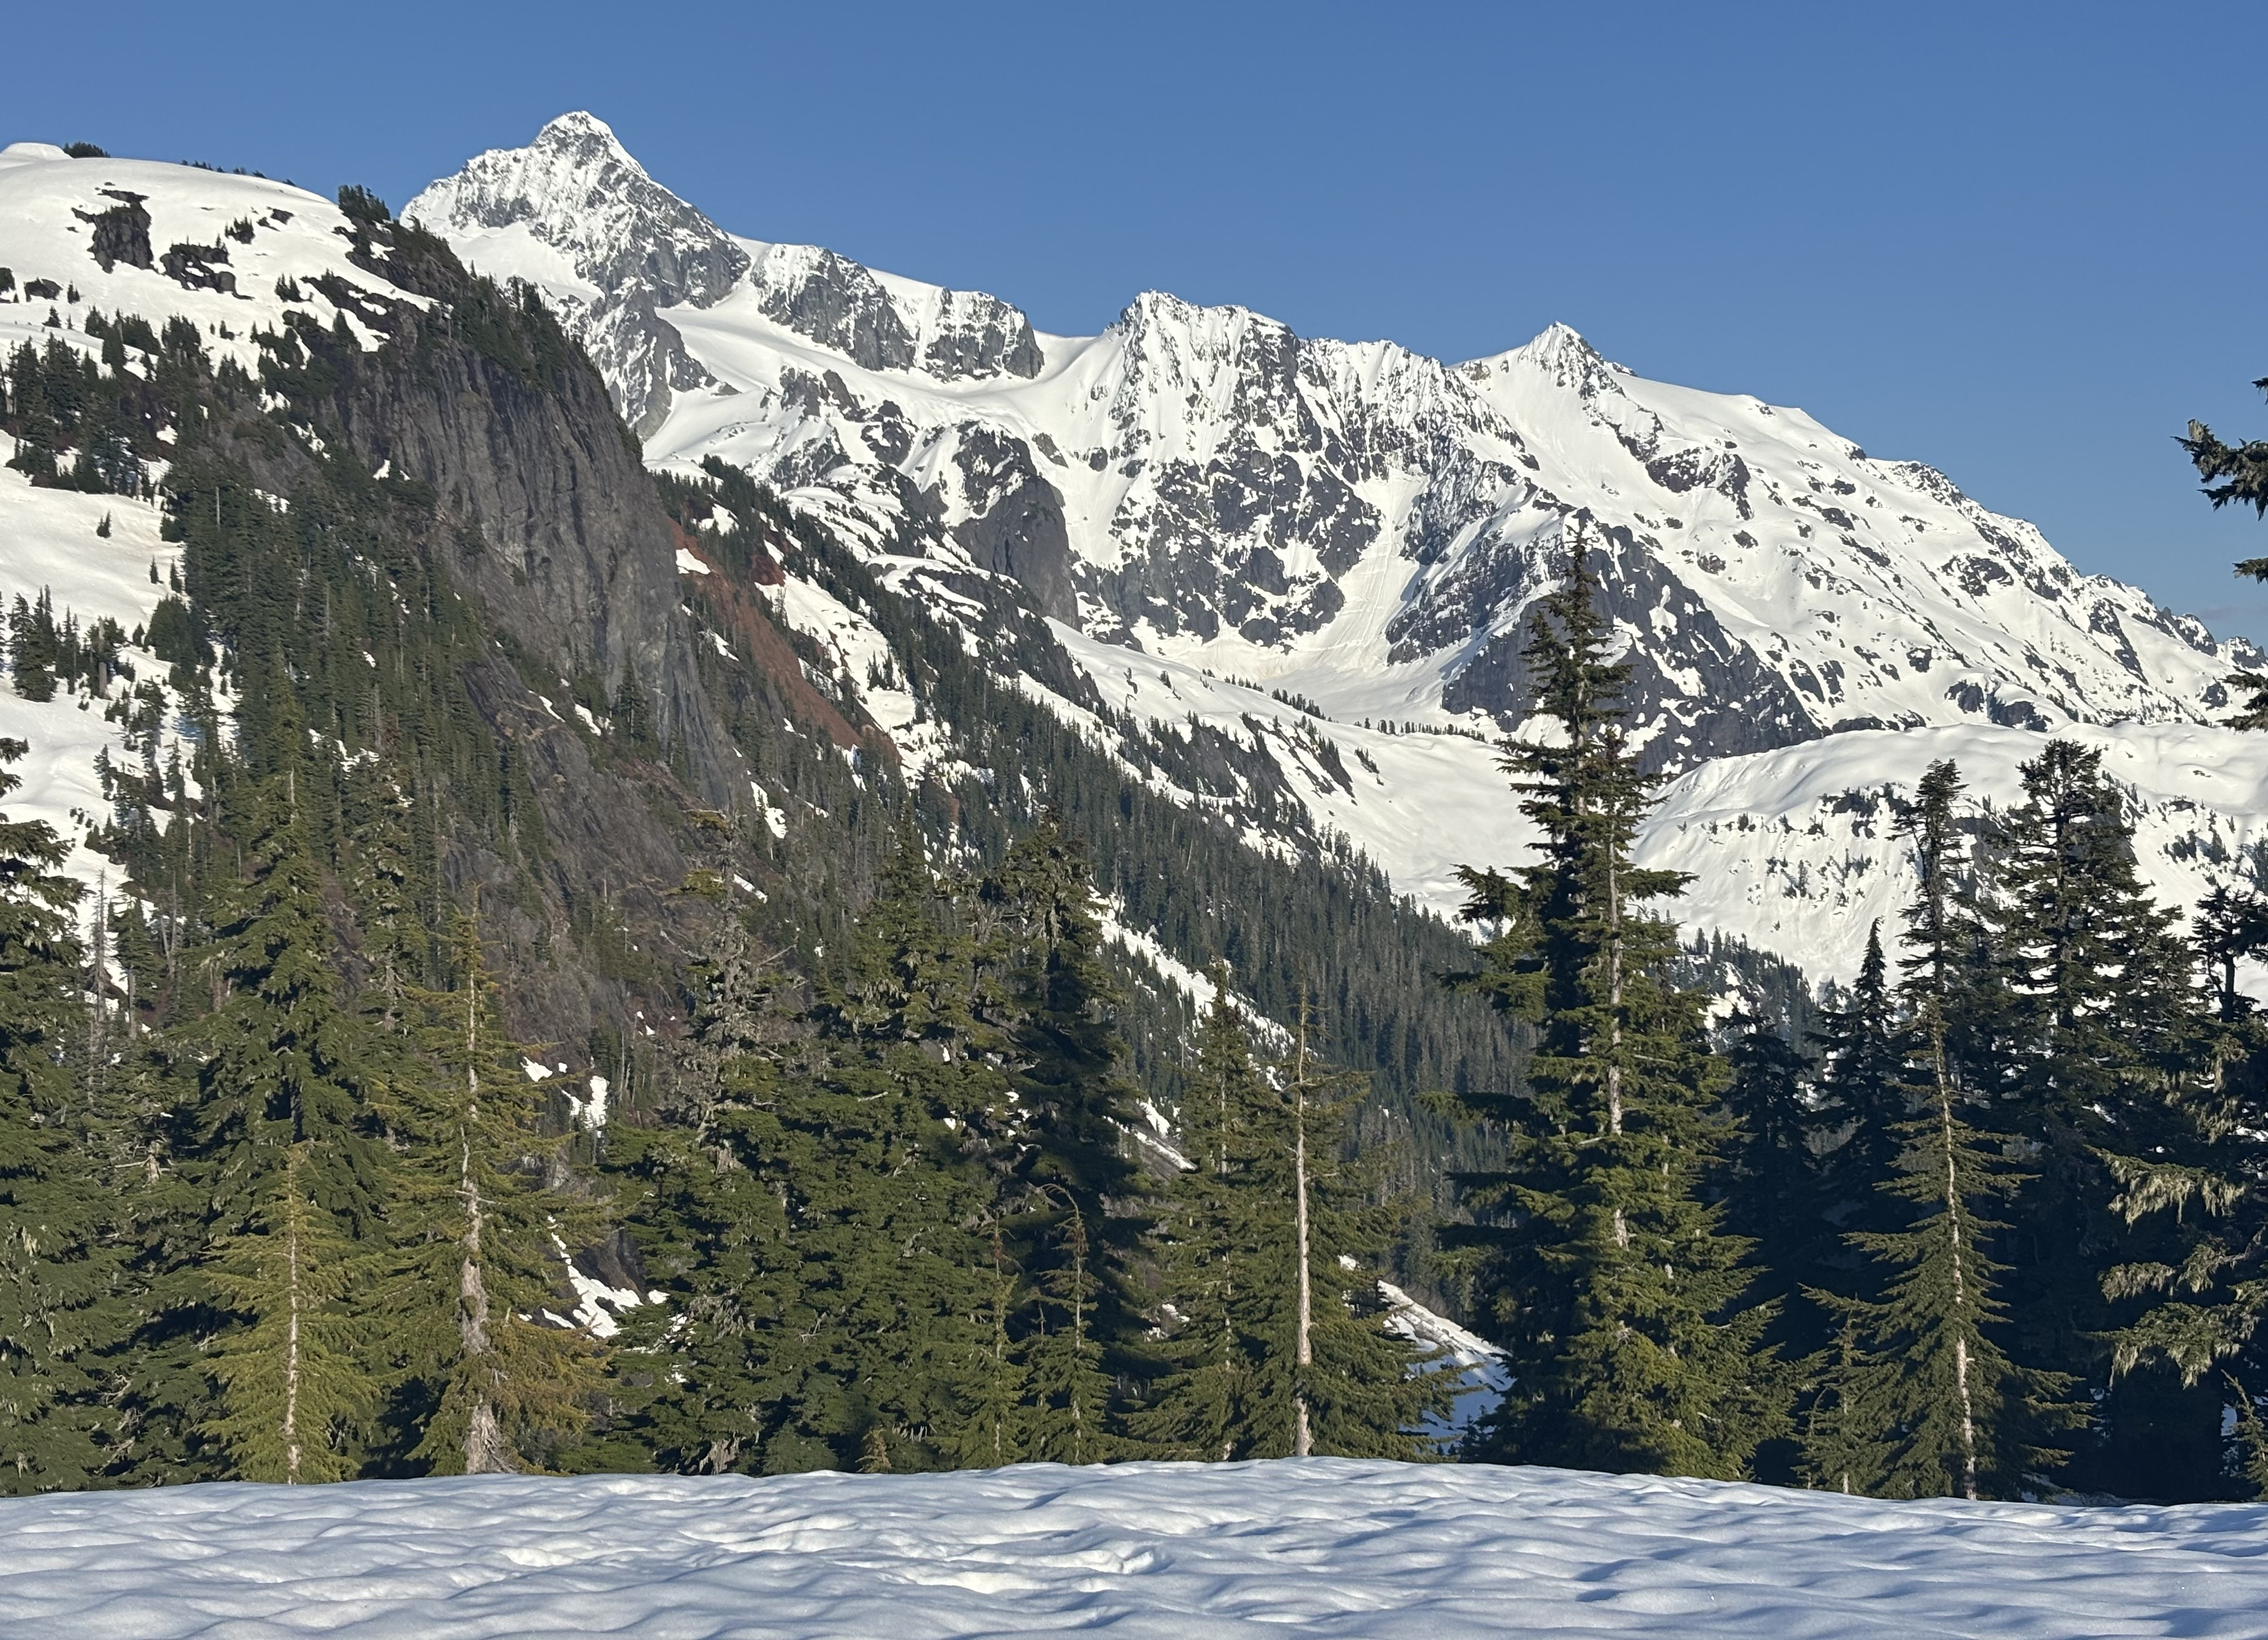
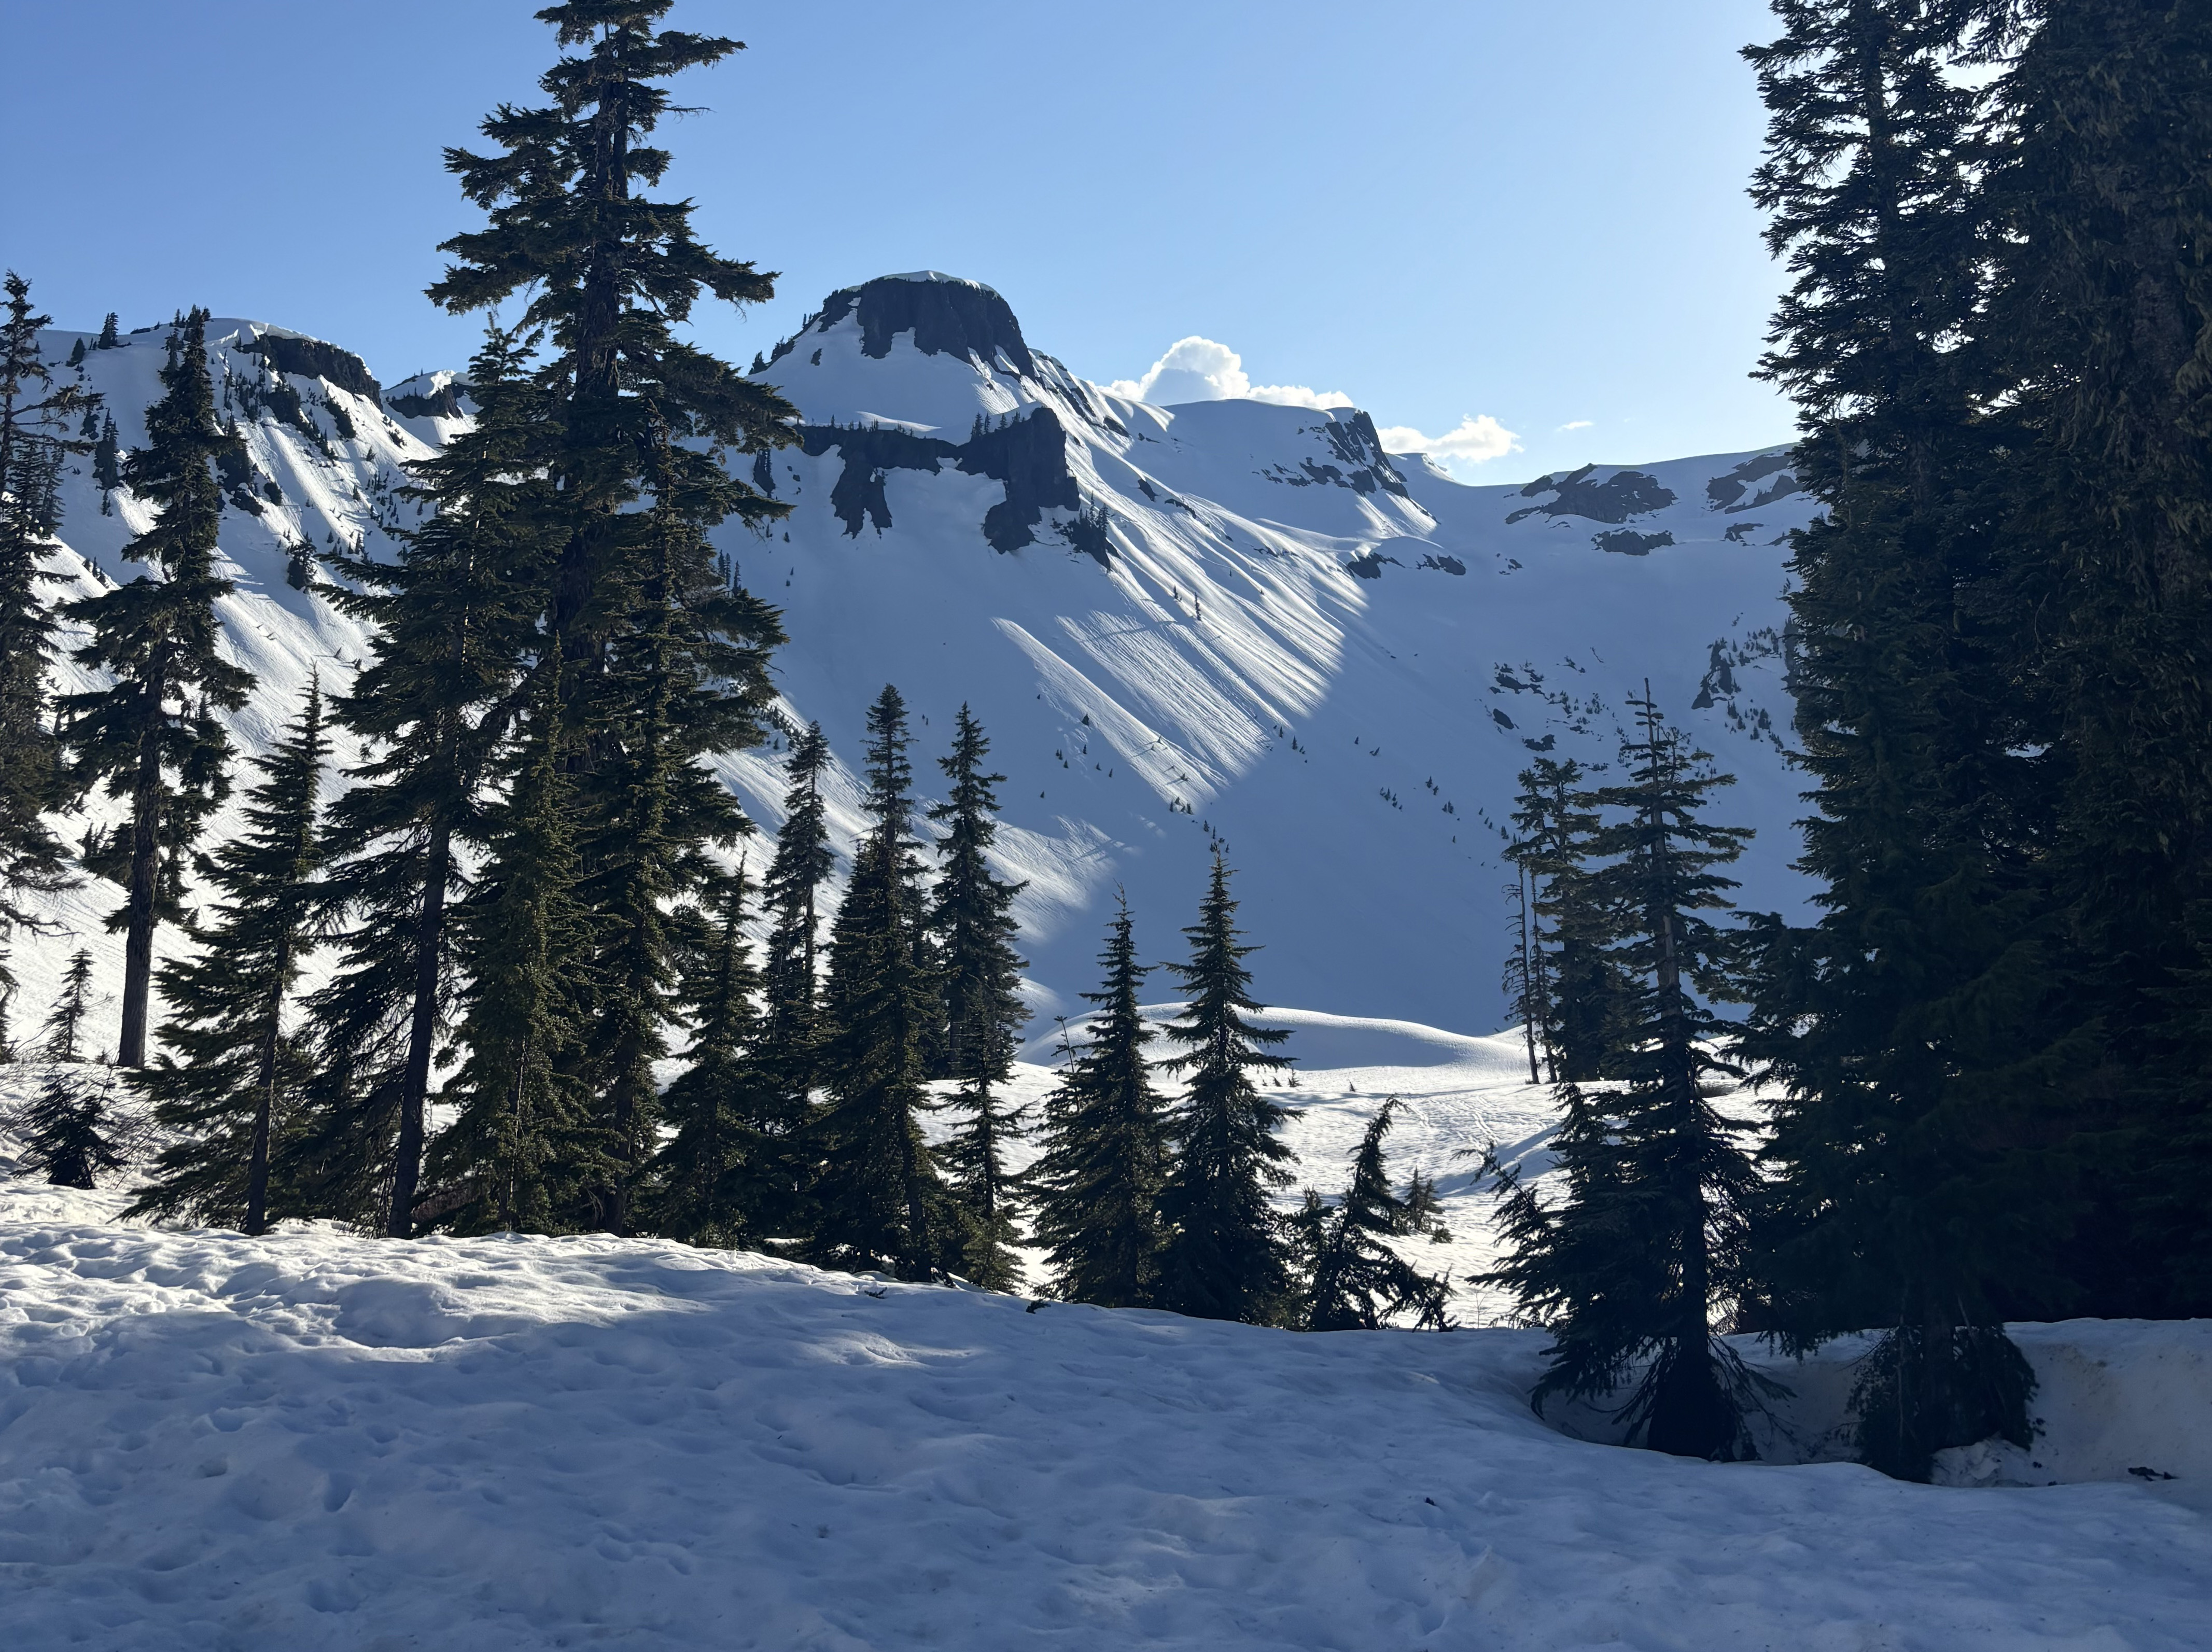
Looking from Austin Pass across to Shuskan on 5-3-26 (Jill Pelto photo)

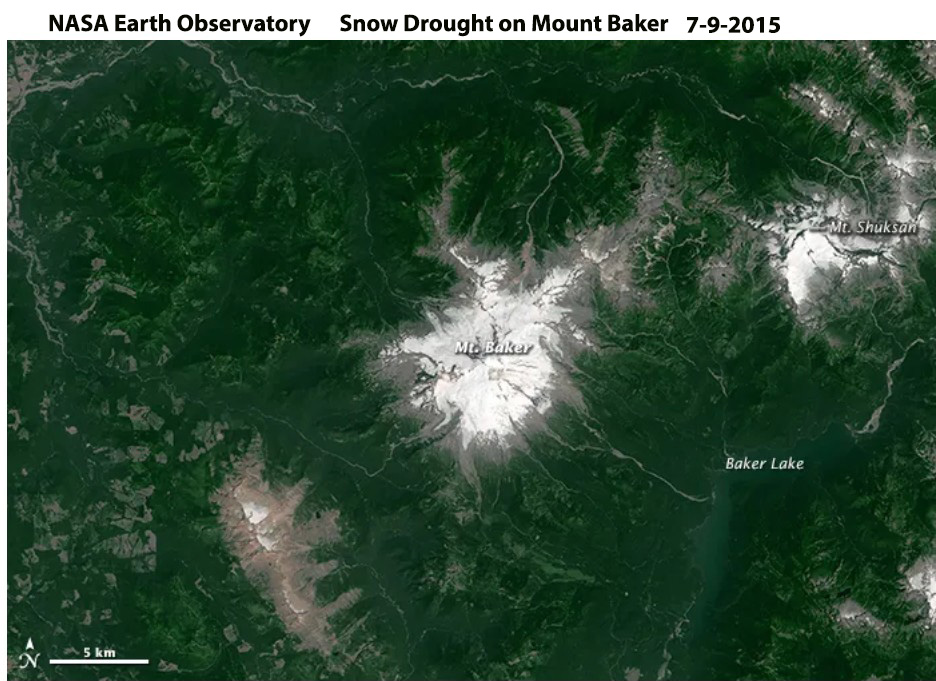
The outlook is poor for glaciers and snowpack in the Pacific Northwest in 2026. How this measures up with the snow drought of 2015 that we reported on in a project with NASA will be important to observe.

North Cascade 2019 Winter Accumulation Assessment

April 1 winter accumulation at the longer term North Cascade SNOTEL stations (Fish Lake, Lyman Lake, Park Creek, Rainy Pass, Stampede Pass and Stevens Pass).

For North Cascade glaciers the accumulation season provides that layer of snow, that must then last through the melt season.  A thin layer sets the glaciers up for a mass balance loss, much like a bear with a limited fat layer would lose more mass than ideal during hibernation. The 2019 winter season in the North Cascade Range, Washington has been unusual.  On April 1 the retained snow water equivalent in snowpack across the range at the six long SNOTEL sites is 0.72 m, which is ~70% of average.  This is the fifth lowest since 1984.  The unusual part is that freezing levels were well above normal in January, in the 95% percentile at 1532 m, then were the lowest level, 372 m of any February since the freezing level record began in 1948.  March returned to above normal freezing levels.  As is typical periods of cold weather in the regios are associated with reduced snowfall in the mountains and more snowfall at low elevations.  In the Seattle metropolitan area February was the snowiest month in 50 years, 0.51 m of snow fell, but in the North Cascades snowfall in the month was well below average. From Feb. 1 to April 1, snowpack SWE at Lyman Lake, the SNOTEL site closest to a North Cascade glacier, usually increases from 0.99 m to 1.47 m, this year SWE increased from 0.83 m to 1.01 m during this period.

The Mount Baker ski area snow measurement site has the world record for most snowfall in a season 1140 inches (28.96 m) during the 1998/99 snow season.  The average snowfall is 633 inches (16.07 m) with snowfall this year as of April 15th at 533 inches (13.53 m).  Below is a Landsat image from April 15, 2019 indicating the snowline at ~1000 m in the Nooksack River Valley and 900-1000 m in the Baker Lake valley.

This year for the 36th consecutive year the North Cascade Glacier Climate Project will be in the field measuring North Cascade glaciers, the early signs point towards a seventh consecutive negative balance year.

Freezing levels at Mount Baker, WA from the North American Freezing Level Tracker. February lowest mean freezing level since 1948.


Mount Baker Cloaked in winter snow in 4/15/2019 Landsat image MB=Mount Baker, MS=Mount Shuksan, NR=Nooksack River