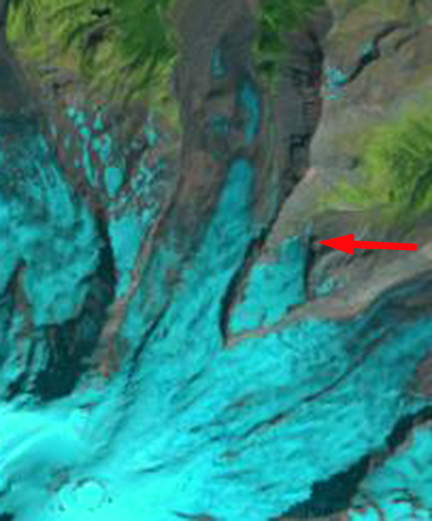
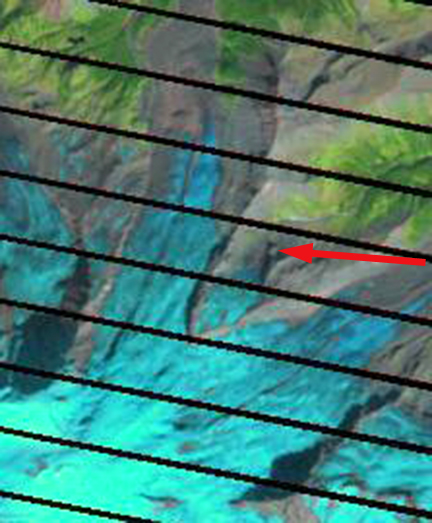
1966 Aerial image taken by Austin Post, USGS, red arrow indicates discharge stream. Emmons Glacier in 2005, red arrow indicates discharge stream, blue arrow lower limit of clean ice and green arrow region of peak velocity.
Emmons Glacier descends the northeast side of Mount Rainier into the White River, and is its largest glacier by area The river is host to pink, chum, coho and chinook salmon, note distribution map below. The lower glacier is heavily debris covered from a landslide off of Little Tahoma in 1963, the glacier was advancing at the time and continued to advance into the early 1980’s , maintaining the advanced position until 1994. Retreat was negligible from 1994-2003. Since 2003 retreat has increased but is still modest. Thinning of the ablation zone has been ongoing and has been more significant than retreat. The National Park Service mass balance work led by Jon Riedel indicates an approximate 10 m thinning from 2003-2014.
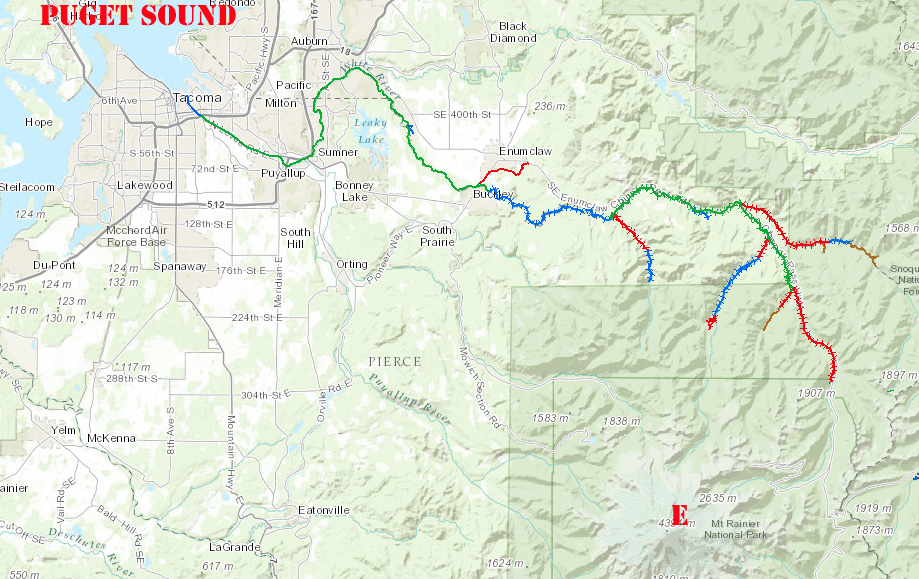
White River chinook salmon distribution from the Washington Department of Fish and Wildlife SalmonScape, green=rearing, red= documented spawning blue=documented presence.
A recent paper by Allstadt et al (2015) examines velocity on this glacier using terrestrial radar interferometry. There key observations are that: Emmons has a slow velocity near the summit < 0.2 m per day , high velocities over the upper and central regions 1.0–1.5 m per day and stagnant debris-covered regions near the terminus < 0.05 m per day. That glacier movement is mostly via sliding. Lastly that there is a large seasonal decrease from July to November. The late summer slowdown is typical of alpine glaciers, where despite peak melt, the drainage system is well developed and basal water pressure is reduced as a result.
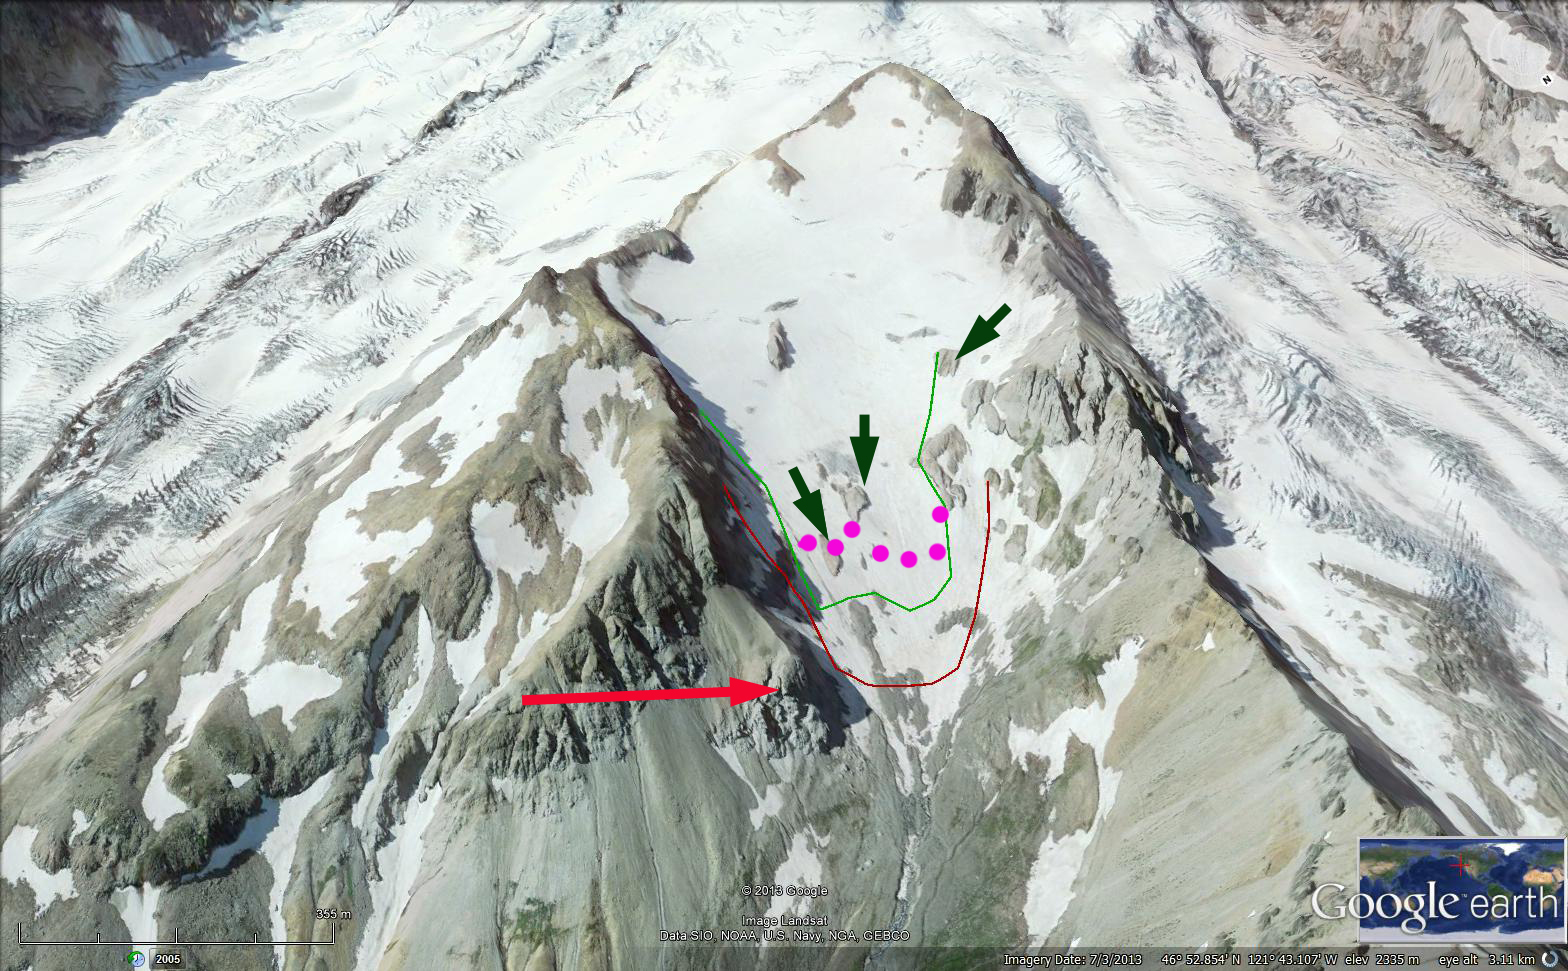
The image below indicates velocity distribution in a cursory fashion compared to the excellent detail of Allstadt et al (2015). The glacier has had a negative mass balance in recent years and this combined with the lack of glacier movement near the terminus, indicates this section of the glacier will continue to melt away, slowed by the insulating debris cover. Google Earth images from 1994 and 2012 indicate an approximately 200 m retreat in the glacier center, and evident thinning in the region up to the yellow arrows. In 2015 record melt was observed in the North Cascades and at least through mid-summer on Mount Rainier. Currently the area of the glacier has not decline enough to reduce late summer streamflow which would impact salmon during the low flow period.
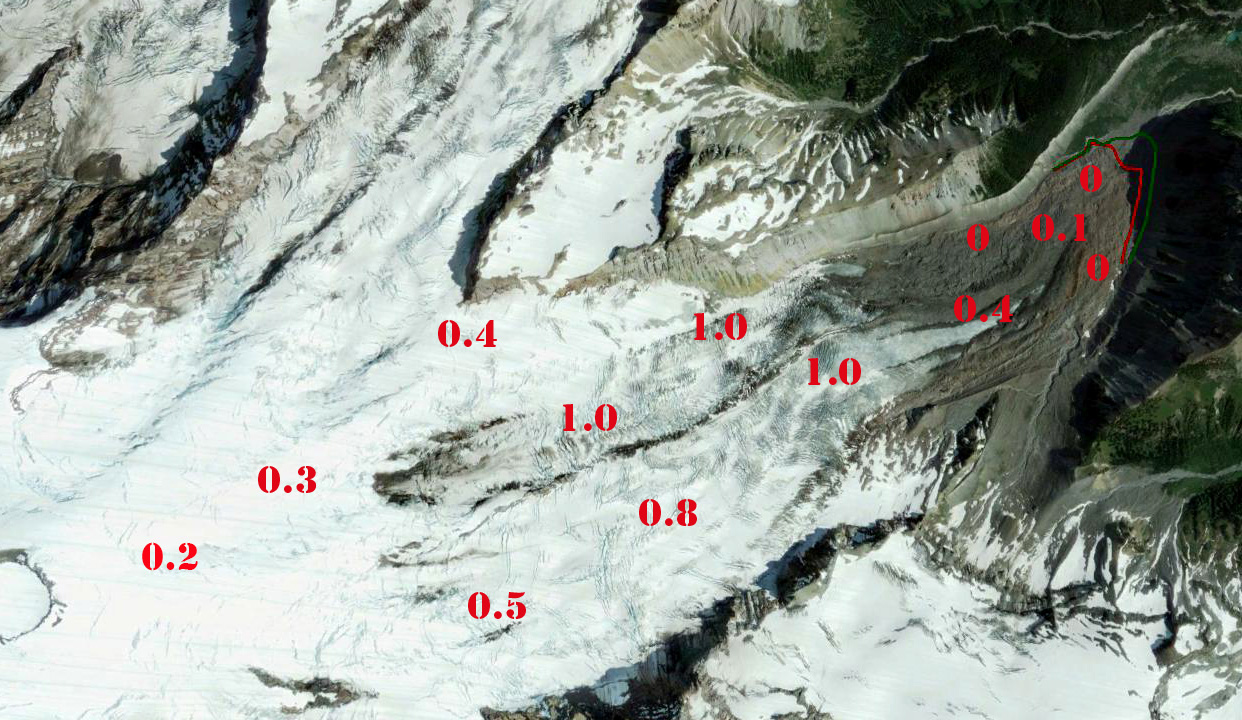
Velocities noted by Allstadt et al (2015) displayed on Google Earth image.

1994 Google Earth Image, red is 2012 terminus position, green the 1994 terminus position

2012 Google Earth Image, red is 2012 terminus position, green the 1994 terminus position