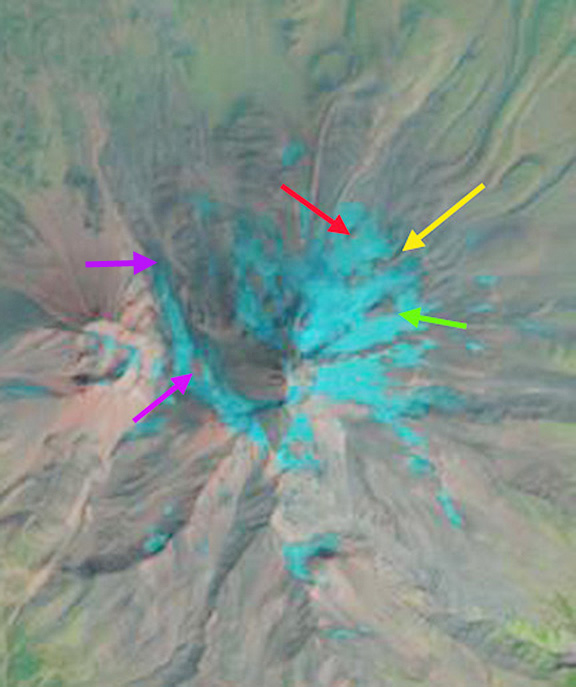
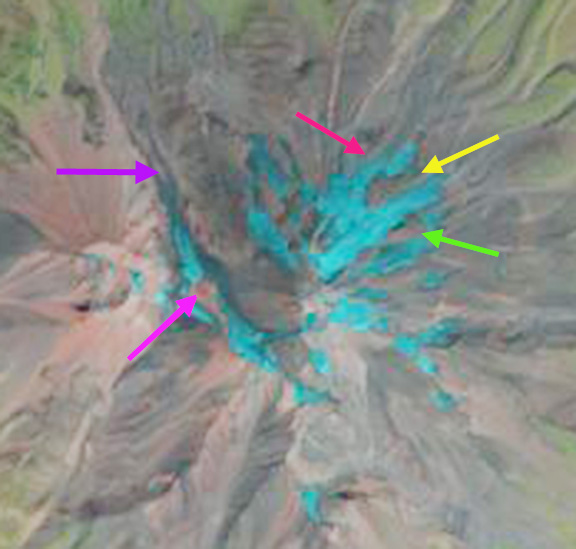
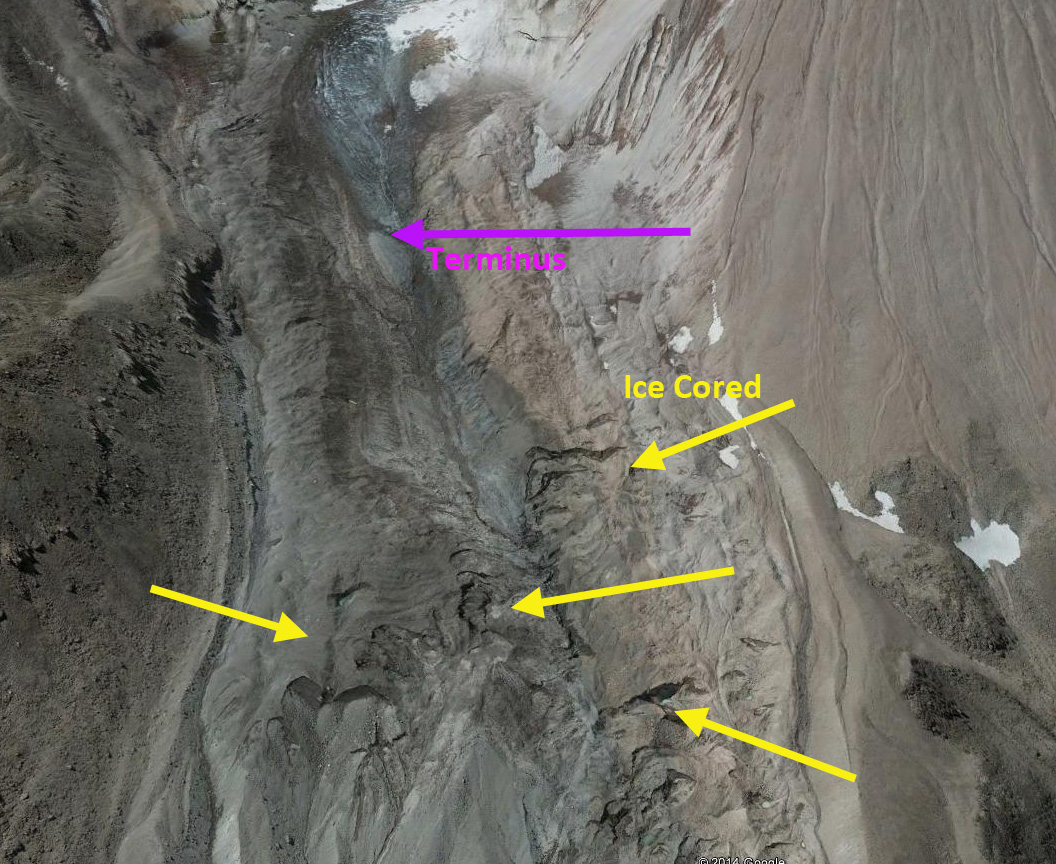
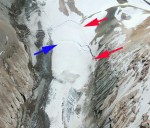
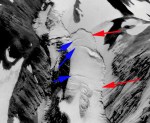
Sentinel 2 False and True Color images from 8-25-2021. Yellow arrows indicate where glacier is separating and purple arrows the small remanent of 2021 snowpack remaining. This remanent will not last to the end of the melt season.
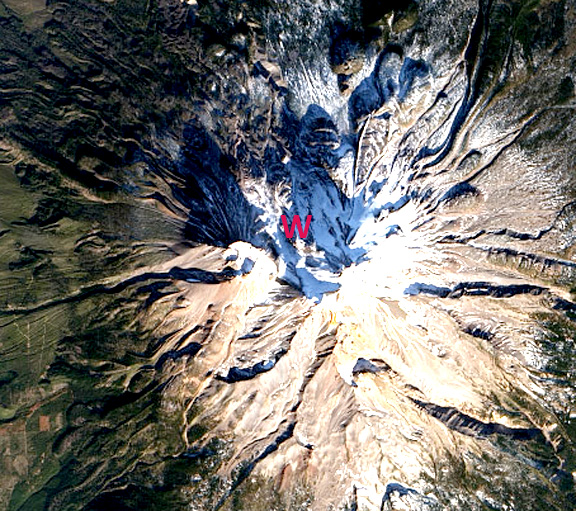
The summer of 2021 is proving to be catastrophic for Whitney Glacier on Mount Shasta, California in terms of volume loss, ~15-20% this year leading to long term impacts, adding to the 50% area reduction and 1000 m retreat since 2005. The glacier will lose 100% of its 2021 snowpack and is in the process of separating into two glaciers. Here we review the glaciers behavior in recent decades and examine using Sentinel Imagery the impacts in summer of 2021.Mount Shasta is a stratovolcano home to the largest glaciers in California, Whitney Glacier on the north side is the longest. In 1981 USGS (Driedger and Kennard, 1986) mapped the area and volume of several of the glaciers, in a landmark study of glacier volume on Cascade volcanoes. Whitney Glacier had an area of 1.3 km2, a maximum depth of 38 m, and a volume of 25 million m 3. The majority of the glacier was in the 20-35 m thick range. The glacier was noted as having a length of 3.0 km ending on the USGS map at 9900 feet.

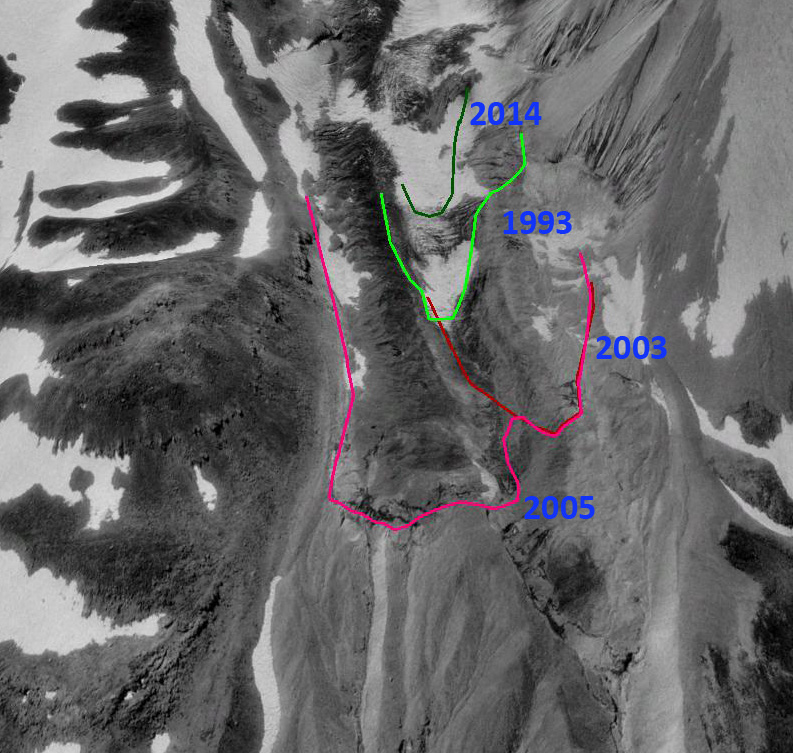
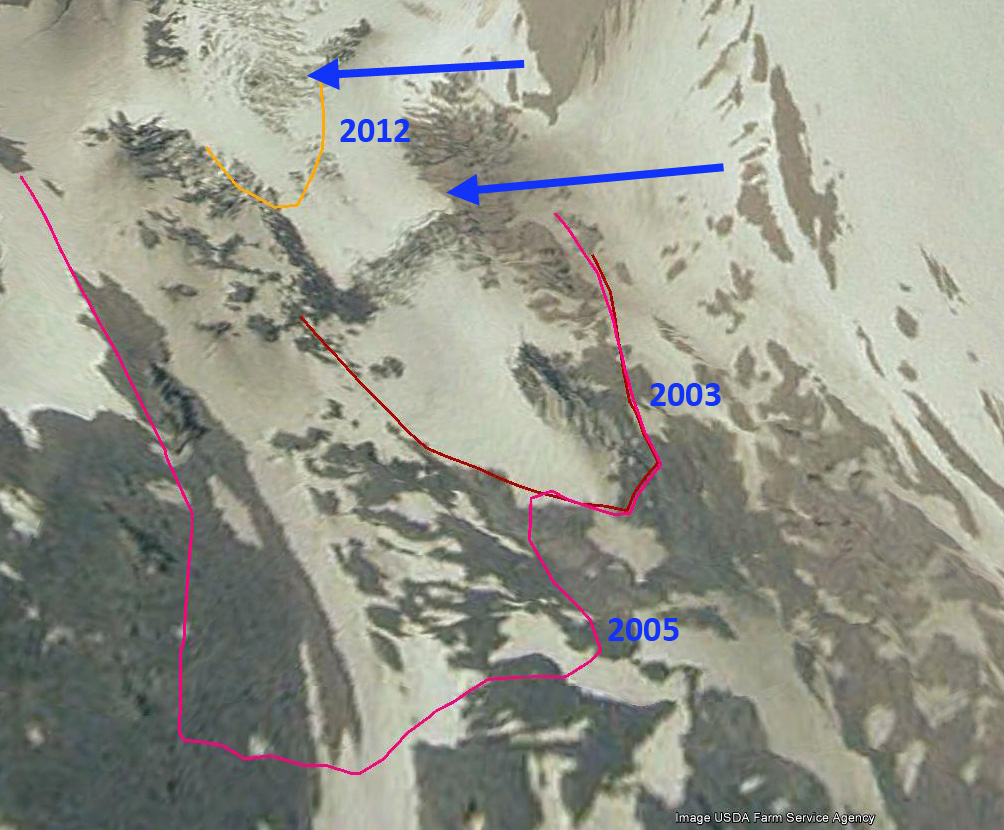
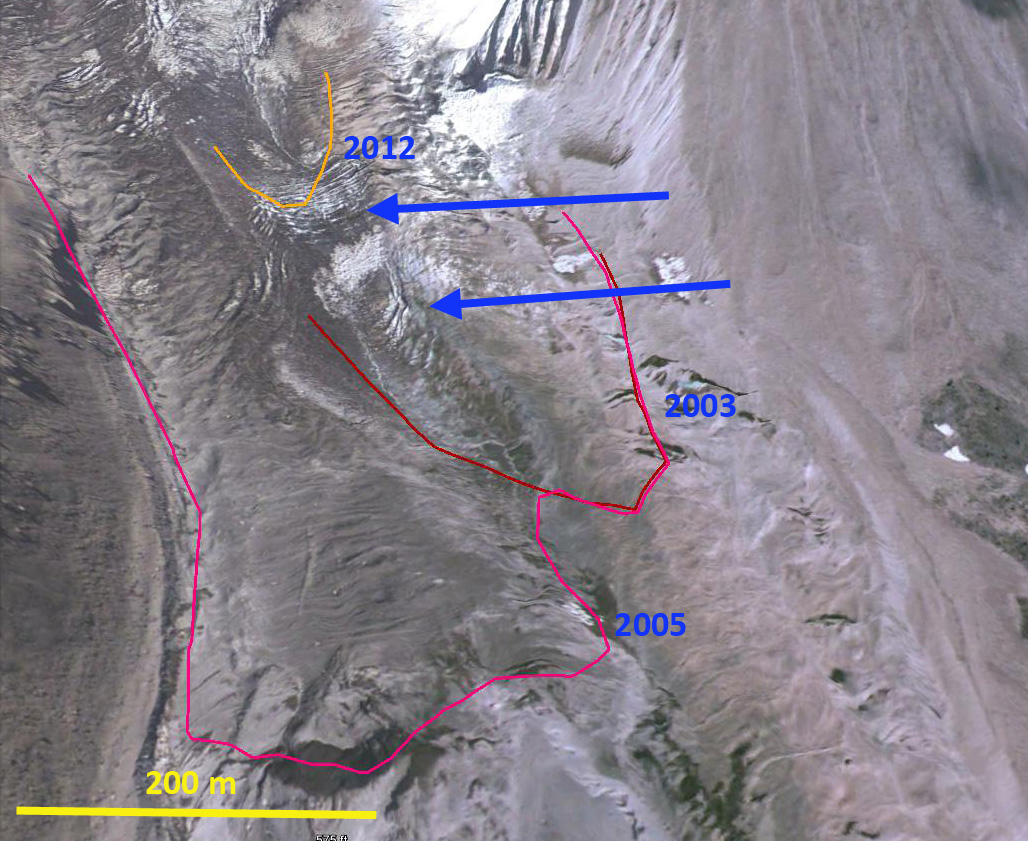
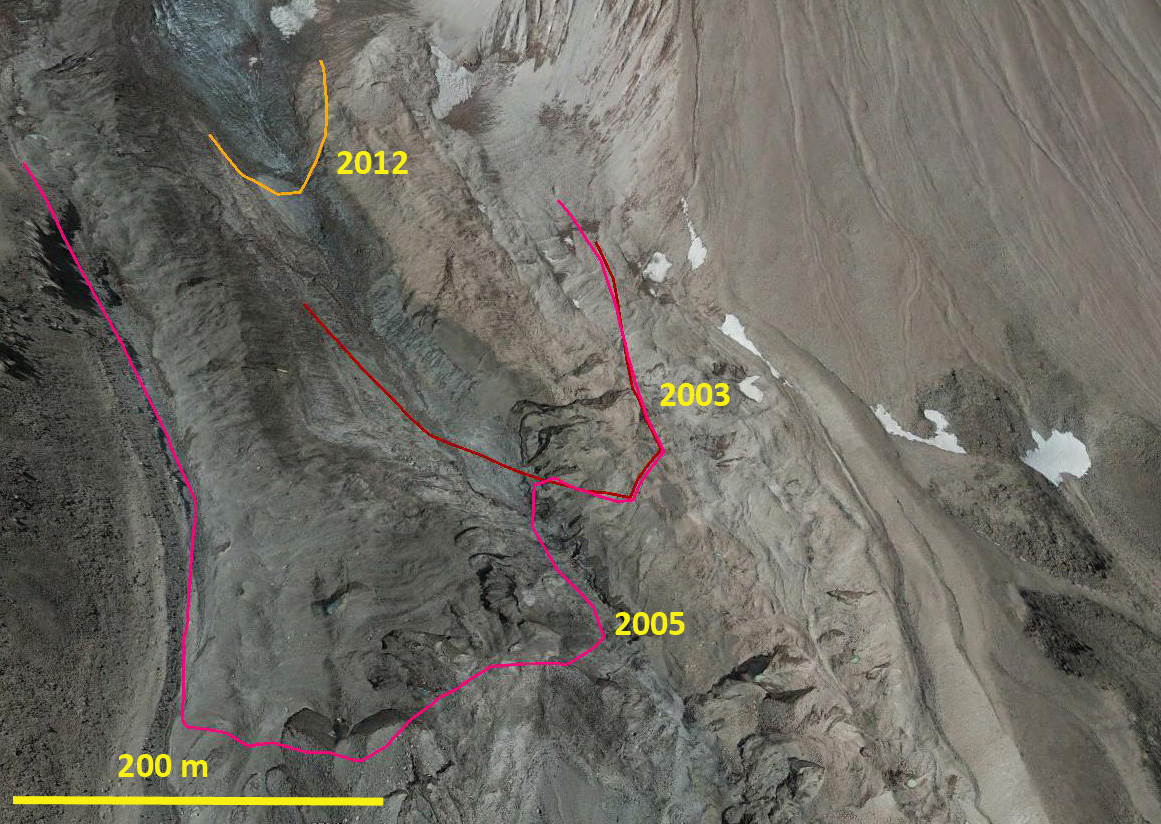
Digital Globe image indicating a area of retreat from 2005-2012 and the limited crevassing near 2012 terminus.
Tulaczyk and Howat (2008) noted that Whitney Glacier did advance during the 2000-2005 period, following a retreat in the 1980’s and 1990’s. The most recent advance was limited to the 1999-2005 period due to heavy snowfall from 1998-2002, ended with the glacier 850 m in advance of its 1951 position. There was a period of advance for many Cascade volcanoes glaciers between 1950 and 1980, followed by retreat after. On Mount Baker, Washington all of the glaciers advanced during the 1944-1979 period by an average of 480 m (Pelto and Hedlund, 2001). By 2010 Pelto and Brown (2012) observed all were retreating with an average retreat of 370 m. In 2012 the glacier is thin in its lower reaches with no crevassing. By 2014 the terminus of the glacier had retreated 700 m from 2005 and was 2.6 km in length and terminated at 10200 feet, 300 feet higher than a decade before or in the 1981 map.

Sentinel 2 True Color images from 6-16-2021, 6-28-2021 and 7-18-2021 illustrating the progressive snowcover loss on the glacier. Point A and D are on the upper Glacier, Point B is where the upper and lower glacier have joined and Point C is near the top of the lower glacier.
The summer of 2021 followed a 15 year period of overall significant mass loss and retreat on Whitney Glacier that led to a thinner glacier with a reduced velocity and consequently fewer crevasses. The stage was set with 60-75% of normal snowpack in early April 2021 at the stations in the region in the 6000-7600′ range, dropping to 20-25% of normal by early May (CDEC, 2021). This was followed by an exceptionally warm early summer, that helped strip the snowpack away early. By June 16, the snowline on Whitney Glacier had risen to 10,800 feet, near Point C, while the upper glacier extending from Point A and D to Point C was nearly all snowcovered. By June 28 the snowline had risen to 11,200 feet on the lower glacier and the upper glacier snowline was near 12,500 feet, with the west facing upper section (Point A) above 13000 feet nearly all bare. By July 18 there is a small area of snowcover near Point C on the lower glacier and Point D on the upper glacier. Most of the glacier is bare of snowcover. This underscores the particularly detrimental impact of early season heat waves that strip away winter snowpack and exposes the dirtier glacier ice and firn. The ice and firn melt ~30% faster than the snowcover for the same weather conditions. Our measurements on Mount Baker during heat waves over the last three decades indicate typical ice melt of 7-9 cm of melt per day. The average temperature over the last 70 days since much of the glacier was bare ice has been 16.8 C at Snow Bowl station at 7617 feet. Given area summer lapse rates this equates to a temperatures of ~12-13 C at the mean glacier elevation. The temperature at this station reached 29 C on June 27, 28 C on June 28 and exceeded 25 C from June 25-June 30. The rapid melt rate led to a number of areas of slushy, swampy glacier surface conditions even high on the glacier (Mount Shasta Avalanche Center ). Using the degree day formula for melt derive on Mount Baker during warm summer conditions (Pelto, 2015 and 2018) of .0053m w.e.C-1D-1, yields a cumulative melt of 4.8 m w.e., equivalent to over 5 m of ice thickness.
This given mean ice thickness in the 25-30 m range indicates that this summer ~15-20% of the glacier ice volume will be lost on Whitney Glacier. The glacier is now 2300 m long and has an area of 0.6 km 2, which is less than 50% of its area just 16 years ago. This is leading to separation of the lower and upper glacier at the yellow arrows. There is certainly still stagnant ice in this zone, but there is no longer a dynamic connection between the upper and lower Whitney Glacier.
 Topographic map of Mt. Shasta.indicating the top of Whitney Glacier near the summit of Shasta and the ~1981 and 2005 terminus position.